CRED iQ examined revenue trends for over 10,000 multifamily properties across the Agency and CMBS securitization universe covering over $800 billion of securitized debt. Data was derived from full-year property-level financial statements for 2021. Partial-year financial statements from 2022 were also considered when available and appropriate. However, annualized financial statements from partial-year periods may have included abnormalities from the timing of revenue recognition in certain cases and were subsequently excluded. Property-level financial statements for securitized mortgages are generally reported on a lag basis and can take several months to be reported after borrowers’ initial reporting and subsequent servicer adjustments.
In our observations, revenue per occupied unit included gross earnings for a multifamily property. Total revenue per unit comprised base rents as well as ancillary income, which included supplemental tenant services such as parking, laundry, and common area amenities.
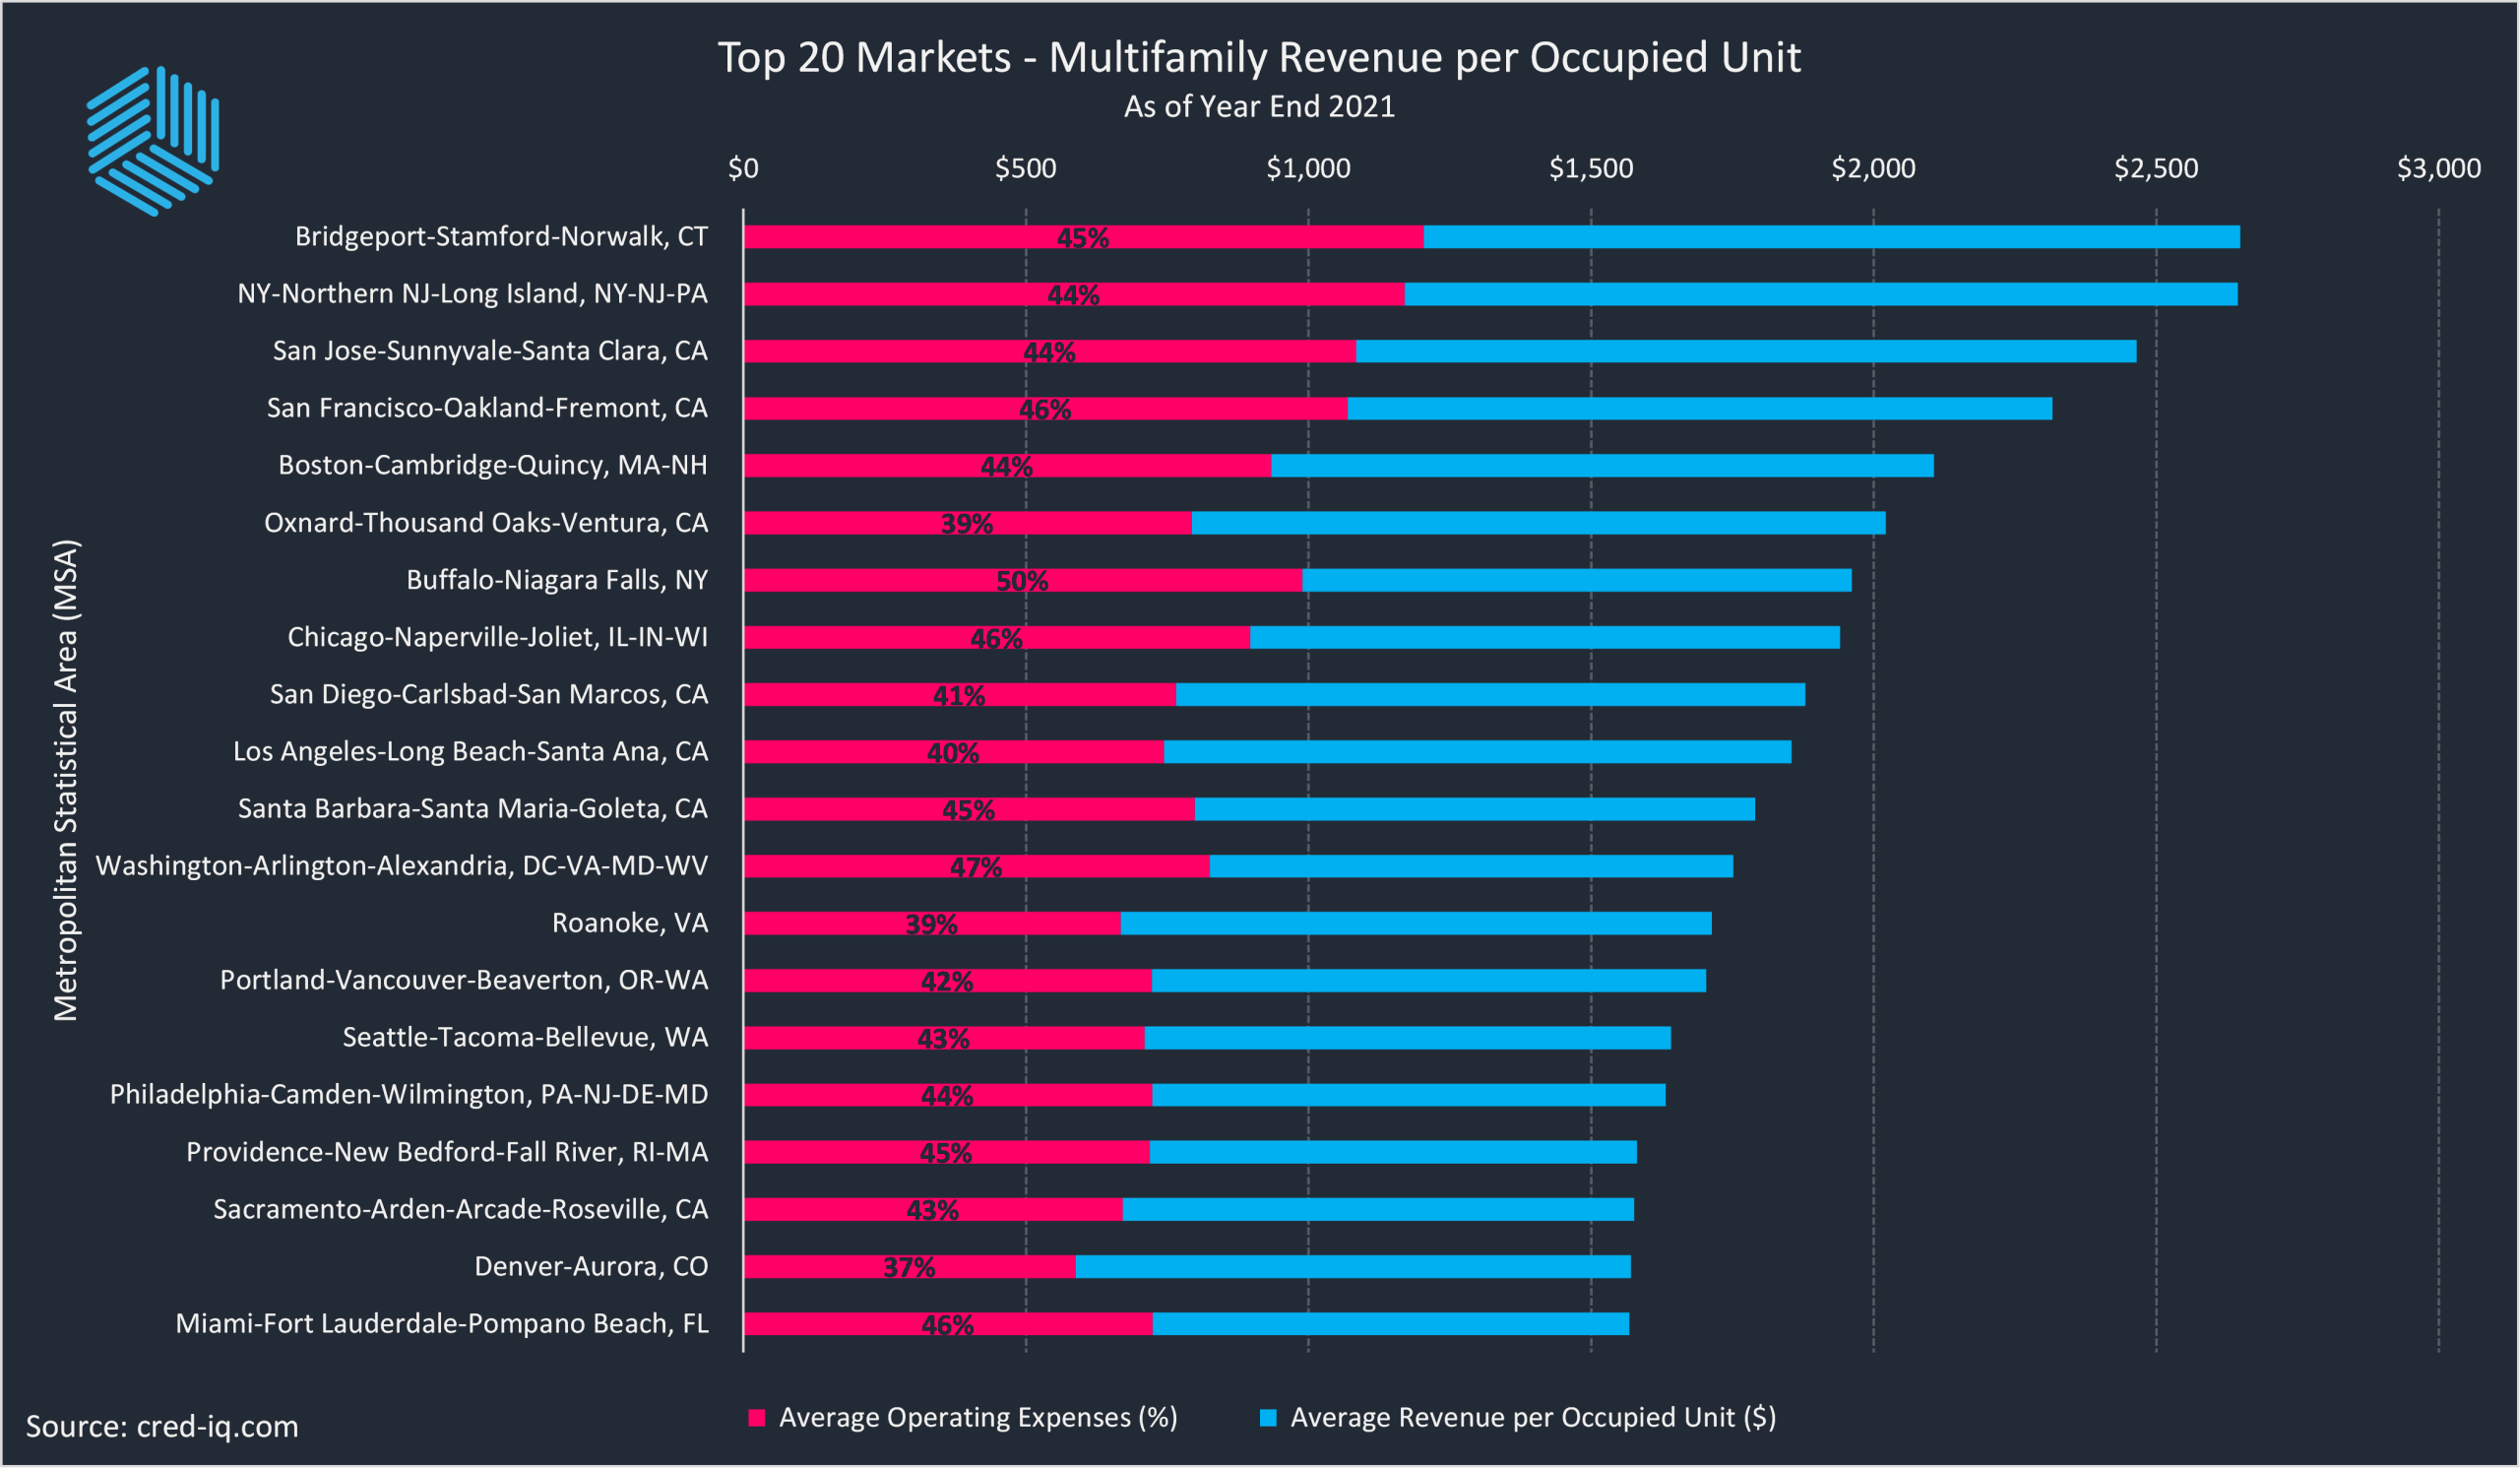
CRED iQ aggregated year-end 2021 financial data by MSA for the 100 largest primary and secondary multifamily markets. Revenue figures were then analyzed on a per unit basis and adjusted for property-level occupancy performance to determine the highest grossing multifamily markets in the country. As a baseline, average revenue per occupied unit across all primary and secondary markets was approximately $1,568. Isolating the Top 20 markets, the average revenue per occupied unit was $1,918 – approximately 22% higher than the average for all markets. MSAs located in the state of California accounted for seven (35%) of the Top 20 markets with the highest revenue per occupied unit. Among the top MSAs in California were San Jose and San Francisco, which both ranking in the five highest grossing multifamily markets.
The Bridgeport-Stamford-Norwalk, CT MSA had the highest average revenue per occupied unit in 2021 with $2,648. Operating leverage averaged about 45% with average operating expenses per unit of $1,203. The Bridgeport market barely edged out the New York-Northern New Jersey-Long Island MSA, which had average revenue per occupied unit of $2,644 – less than 1% lower than Bridgeport. The average operating leverage for the New York MSA was approximately 44%, which was in line with the Bridgeport MSA. New York and Bridgeport were two of six submarkets with average revenue per occupied unit that was greater than $2,000.
Accounting for operating expenses on a per unit basis, the Top 20 highest grossing markets had an average operating expense ratio of 44%. The Denver-Aurora, CO MSA has the highest margins with an average operating expense ratio of 37% while multifamily properties in the Buffalo-Niagara Falls, NY MSA performed with the highest operating leverage, equal to 50%. When accounting for lower operating leverage, markets can be viewed more favorably based on Net Operating Income (NOI) potential. Comparable expense per unit figures can vary widely across markets in a number of categories, including real estate taxes, insurance premiums, or utility costs.
Shifting focus to the opposite side of the scale, some notable high-inventory markets with relatively lower revenue per occupied unit metrics included Kansas City ($995), Detroit ($1,081), San Antonio ($1,143), Houston ($1,146), and Columbus, OH ($1,161).
About CRED iQ
CRED iQ is a commercial real estate data, analytics, and valuation platform designed to unlock investment, financing, and leasing opportunities. CRED iQ provides real-time property, loan, tenant, ownership, and valuation data for over $2.0 trillion of commercial real estate.
