

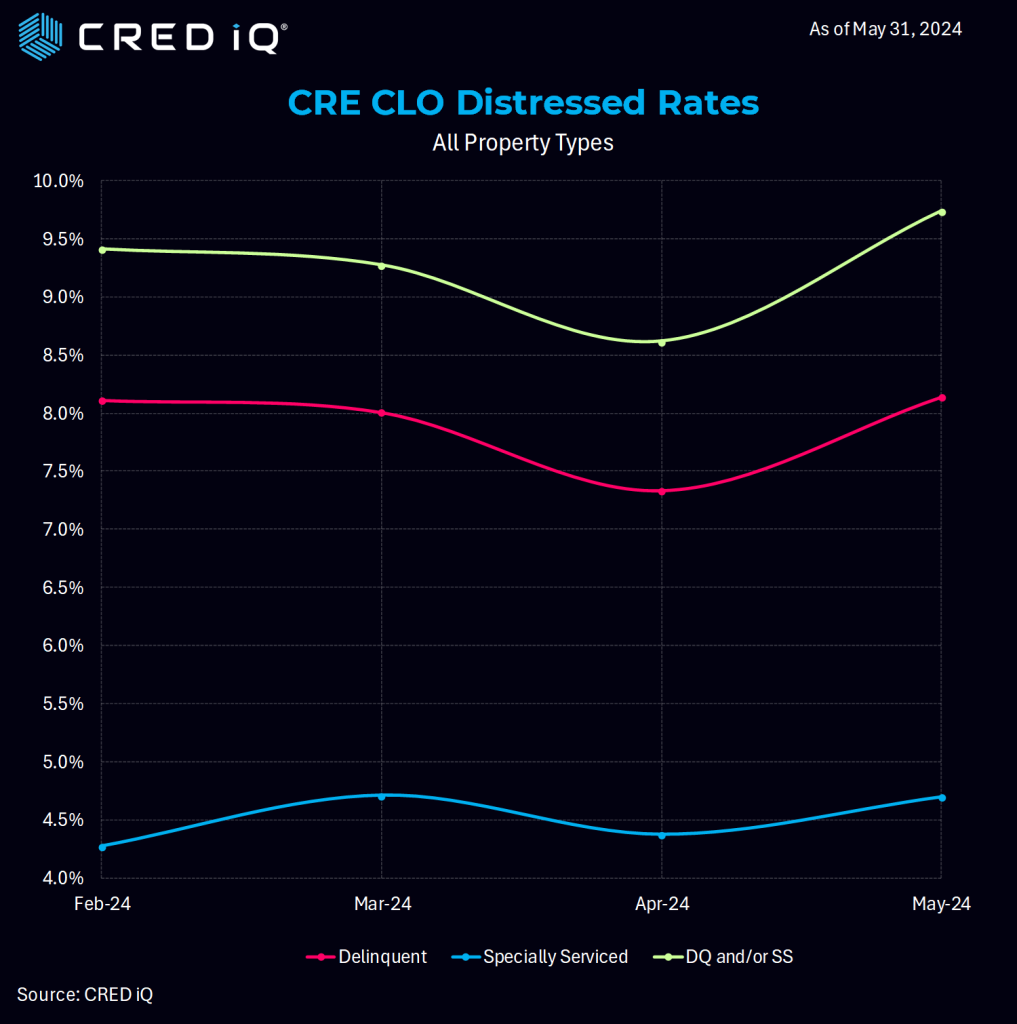
The CRED iQ research team continued its examination of the CRE CLO ecosystem as the distress rate reached 9.74%, an increase of 114 basis points since our May 3rd print. This includes any loan reported 30 days delinquent, past their maturity, specially serviced, or a combination of these.
CRED iQ consolidated all of the loan-level performance data for every outstanding CRE CLO loan to measure the underlying risks associated with these transitional assets. Many of these loans were originated in 2021 at times where cap rates were low, valuations high, low interest rates, and are starting to run into maturity issues given the spike in rates.
Some of the largest issuers of CRE CLO debt over the past five years include MF1, Arbor, LoanCore, Benefit Street Partners, Bridge Investment Group, FS Rialto, and TPG.
As in our May report, our research team analyzed ~$78 billion in active CRE CLO loans (an increase of ~$3 billion from the May report) to better understand current distress levels and exposing any potential forecasting bellwether metrics. Along those lines we further explored 1) Loans that have been added to the servicer watchlist. 2) The triggers that caused the watchlist designation.
Just over 36.5% of CRE CLO loans are currently on the servicers watchlist (a decrease of 2.1% since our May report). Combining the 9.74% distress rate with the 36.5% watchlist percentage, CRED iQ calculates 46.2% of these loans have some level of issues with their loans – generally flat to May’s 46.3% print.
As mentioned in our May report, our analysis exposes a wide gap between the distress and watchlist rates which could imply that the special serving & delinquency percentages may be likely to grow.
By property type, no surprise that office sector loans maintained their dominant lead –notching a 16.8% distressed rate. Multifamily’s distress rate of 13.3% earned them a second-place finish, followed by retail and industrial at 7.8% and 4.7% respectively. Hotel loans were not far behind industrial at 4.1%. (the “other” loan category saw a 6% distress rate).
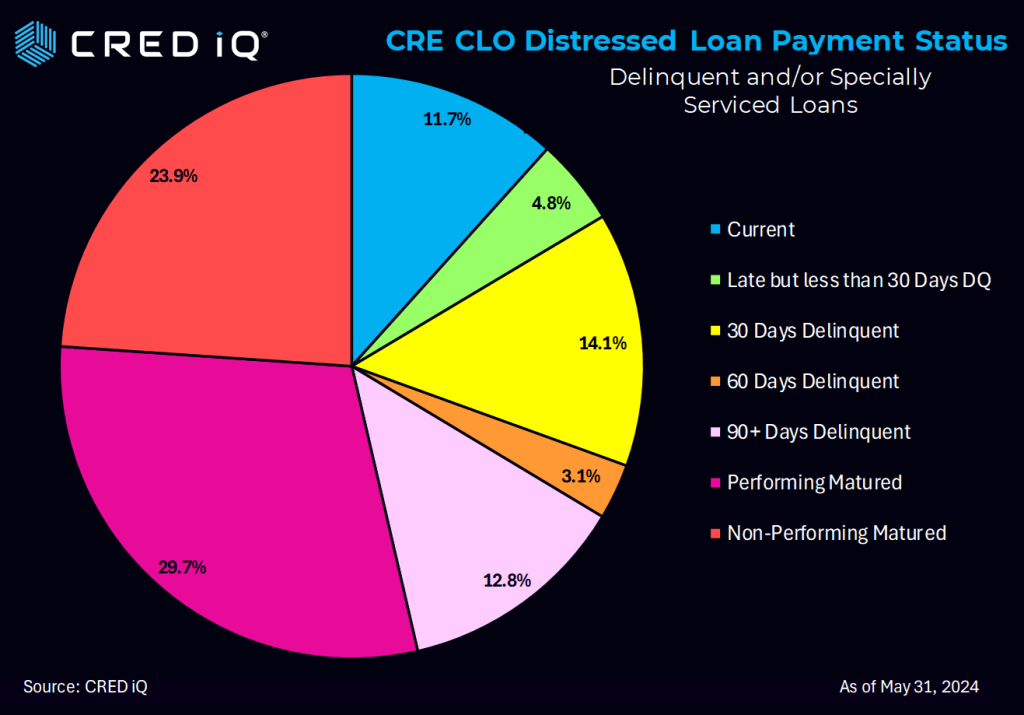
Breaking down the distress rate by payment status, 29.7% of loans were designated as performing matured, with non-performing matured not far behind at 23.9%. (combined, performing and non-performing matured loans comprise over half of the distressed universe (53.6%). 12.8% of loans have reached 90+ days delinquent, and finally 11.7% of distress loan payment status are current.
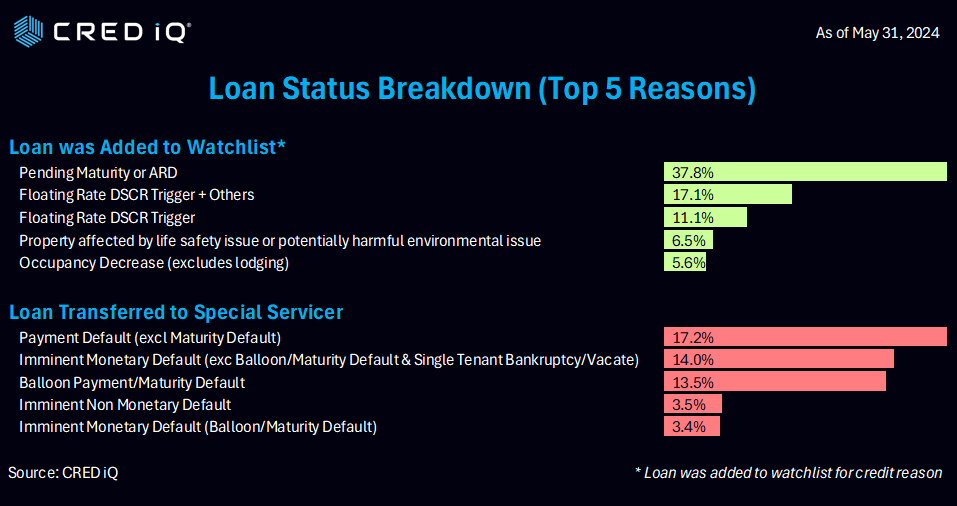
Examining the watchlist breakdown by credit reason reveals that 37.8% of loans are on the watchlist due to pending maturing or ARD. Floating rate DSCR triggers are broken into two categories (one with “+others”) and the second as a pure DSCR trigger category. Combined, they account for 28.2% of the watchlist loans. Other notable categories include property affected by safety issue or potentially harmful environmental issue (6.5%) and occupancy decrease (excludes lodging) (5.6%)
The vast majority of the ~$78 billion in CRE CLO loans are structured with floating rates with 3-year loan terms equipped with loan extension options if certain financial hurdles are met.
About CRED iQ
CRED iQ is an official market data provider for the Commercial Real Estate and financial industries. Powered by over $2.3 trillion in loan and transaction data that includes all property types and geographies.
CRE professionals leverage CRED iQ for a wide spectrum of use cases such as uncovering acquisition & lending opportunities, market analysis, underwriting, and risk management.
