
After September’s rate hike, $6.8 billion of fresh equity stands between maturing multifamily loans and a refinance. Loans written at 2021 and 2022’s low coupons are the hardest hit.
20 Exchange Place, a 54-story, 767-unit apartment tower near Wall Street built in 1929, was 94% occupied in the second quarter, and its loan is current. But the $246 million Freddie Mac loan behind it carries a 4.01% coupon and matures in February 2027. The property’s 2025 net operating income of $15.5 million would support a new loan of about $183 million at today’s agency rates, leaving a gap of roughly $63 million. The borrower has been calling capital from investors as needed to cover operating shortfalls, according to servicer commentary.
That arithmetic is now common. CRED iQ re-sized every multifamily loan in Fannie Mae, Freddie Mac and commercial mortgage-backed securities deals maturing between October 2026 and December 2028, $136 billion in all, at current new-issue coupons plus September’s rate hike. Nearly one in four (23%) of those loans, and 31% of the balance, could not refinance without new equity. Borrowers would need to bring $6.8 billion to the table. The median shortfall is 15% of the loan, or about $25,000 per apartment.
What the Hike Did
The Secured Overnight Financing Rate jumped from 3.62% to 3.85% on Sept. 17. Passed through to permanent loan coupons, the hike pushed 178 more loans ($4.0 billion of balance) below a 1.25x coverage test and added $846 million to the equity gap. Each further 25 basis points adds roughly $1.0 billion more. Two more hikes would leave 39% of maturing multifamily debt short of a refinance.
| Scenario | Coupon, conduit / Freddie / Fannie | Loans short | Balance short | Equity needed |
|---|---|---|---|---|
| Before Sept. hike | 6.21% / 5.21% / 5.34% | 21% | 28% | $6.0B |
| After hike (+25 bp) | 6.46% / 5.46% / 5.59% | 23% | 31% | $6.8B |
| One more (+50 bp) | 6.71% / 5.71% / 5.84% | 26% | 35% | $7.7B |
| Two more (+75 bp) | 6.96% / 5.96% / 6.09% | 29% | 39% | $8.8B |
| Three more (+100 bp) | 7.21% / 6.21% / 6.34% | 32% | 42% | $9.8B |
The 2021-2022 Problem
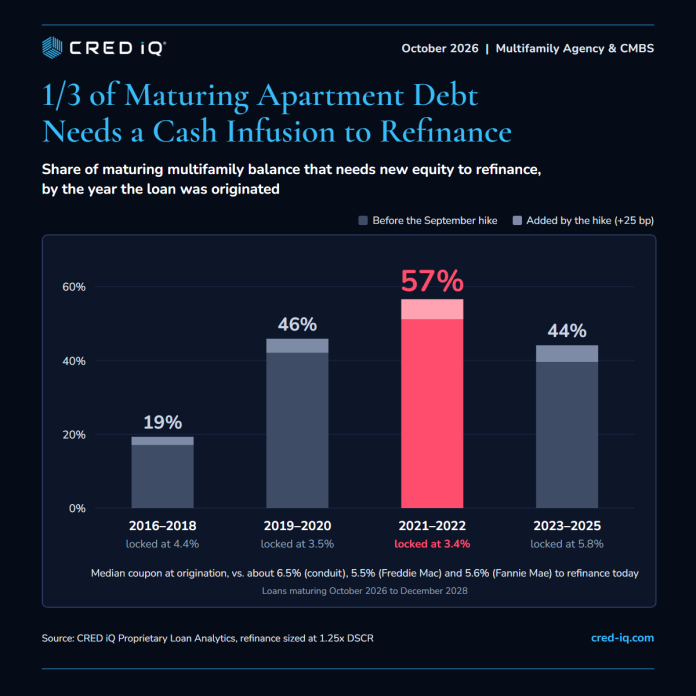
The gap is concentrated in loans written at the bottom of the rate cycle. Loans originated in 2021 and 2022, with a median coupon of 3.35%, now face refinancing rates roughly two to three percentage points higher. Some 46% of them, and 57% of their balance, need new equity, against 15% of the loans written in 2016 to 2018, which had years of rent growth to catch up with higher rates. Income is the other half of the story: loans that clear the test have grown net operating income a median 31% since underwriting, while those that fall short have seen it drop a median 12%.
| Originated | Maturing balance | Median coupon | Loans short | Balance short | Equity needed |
|---|---|---|---|---|---|
| 2016-2018 | $70.1B | 4.37% | 15% | 19% | $2.6B |
| 2019-2020 | $10.3B | 3.46% | 33% | 46% | $0.8B |
| 2021-2022 | $18.5B | 3.35% | 46% | 57% | $1.9B |
| 2023-2025 | $21.0B | 5.78% | 38% | 44% | $1.4B |
Where the Gap Is Widest
Among the largest markets, Western and Sunbelt metros lead. In San Francisco, 70% of maturing multifamily debt falls short; in Atlanta, 55%; in Denver, 51%. Chicago (13%) and Los Angeles (24%) are at the other end.
| Metro | Maturing balance | Loans short | Balance short | Equity needed |
|---|---|---|---|---|
| San Francisco | $4.0B | 47% | 70% | $603M |
| Atlanta | $3.9B | 44% | 55% | $398M |
| Denver | $3.9B | 51% | 51% | $368M |
| Phoenix | $3.9B | 40% | 46% | $299M |
| Dallas-Fort Worth | $5.2B | 34% | 42% | $478M |
| Seattle | $3.6B | 32% | 40% | $223M |
| New York | $10.8B | 33% | 39% | $739M |
| Houston | $3.7B | 30% | 37% | $200M |
| Washington, D.C. | $4.4B | 31% | 33% | $231M |
| San Diego | $3.2B | 24% | 33% | $140M |
| Los Angeles | $8.4B | 25% | 24% | $352M |
| Chicago | $4.1B | 17% | 13% | $68M |
New York’s Park West Village shows how fast a gap can open. The 850-unit property’s loan, split across seven conduit deals, was underwritten at 1.34x coverage; by year-end 2025 coverage was 0.61x as expenses rose, according to servicer commentary. It was modified by the special servicer last November and matures in August 2027.
The Takeaway
Most maturing multifamily loans still refinance on their own. But for the 2021 and 2022 class, a refinance now means a check, and every additional hike makes it bigger. Expect more paydowns, extensions and rescue capital through 2028.
Source: CRED iQ proprietary loan-level analytics, October 2026. Multifamily loans in Fannie Mae DUS MBS, Freddie Mac K and SB deals, and conduit and fixed-rate SASB CMBS maturing October 2026 to December 2028; floating-rate SASB, CRE CLO and co-op loans excluded. Refinance sized at 1.25x debt service coverage on a 30-year amortization at the average coupon on 2026 multifamily new issuance (6.21% conduit and SASB, 5.21% Freddie Mac, 5.34% Fannie Mae) plus 25 basis points, using 2025 net operating income. September 2026 numbers are preliminary.