

2400 Market Street in Philadelphia is 99.5% occupied, and its largest tenant, Aramark, has a lease that runs to 2034. The $205 million loan on the building still moved to a special servicer on Sept. 29 for imminent default ahead of its Dec. 9 maturity. The servicer is pursuing a modification.
In October alone, CRED iQ’s property alerts flagged $4.5 billion of conduit and single-asset (SASB) CMBS debt as newly delinquent or newly in special servicing, and 93% of it was past maturity or within six months of it. Office made up $1.5 billion, hotels $1.1 billion, retail $0.7 billion and industrial $0.5 billion.
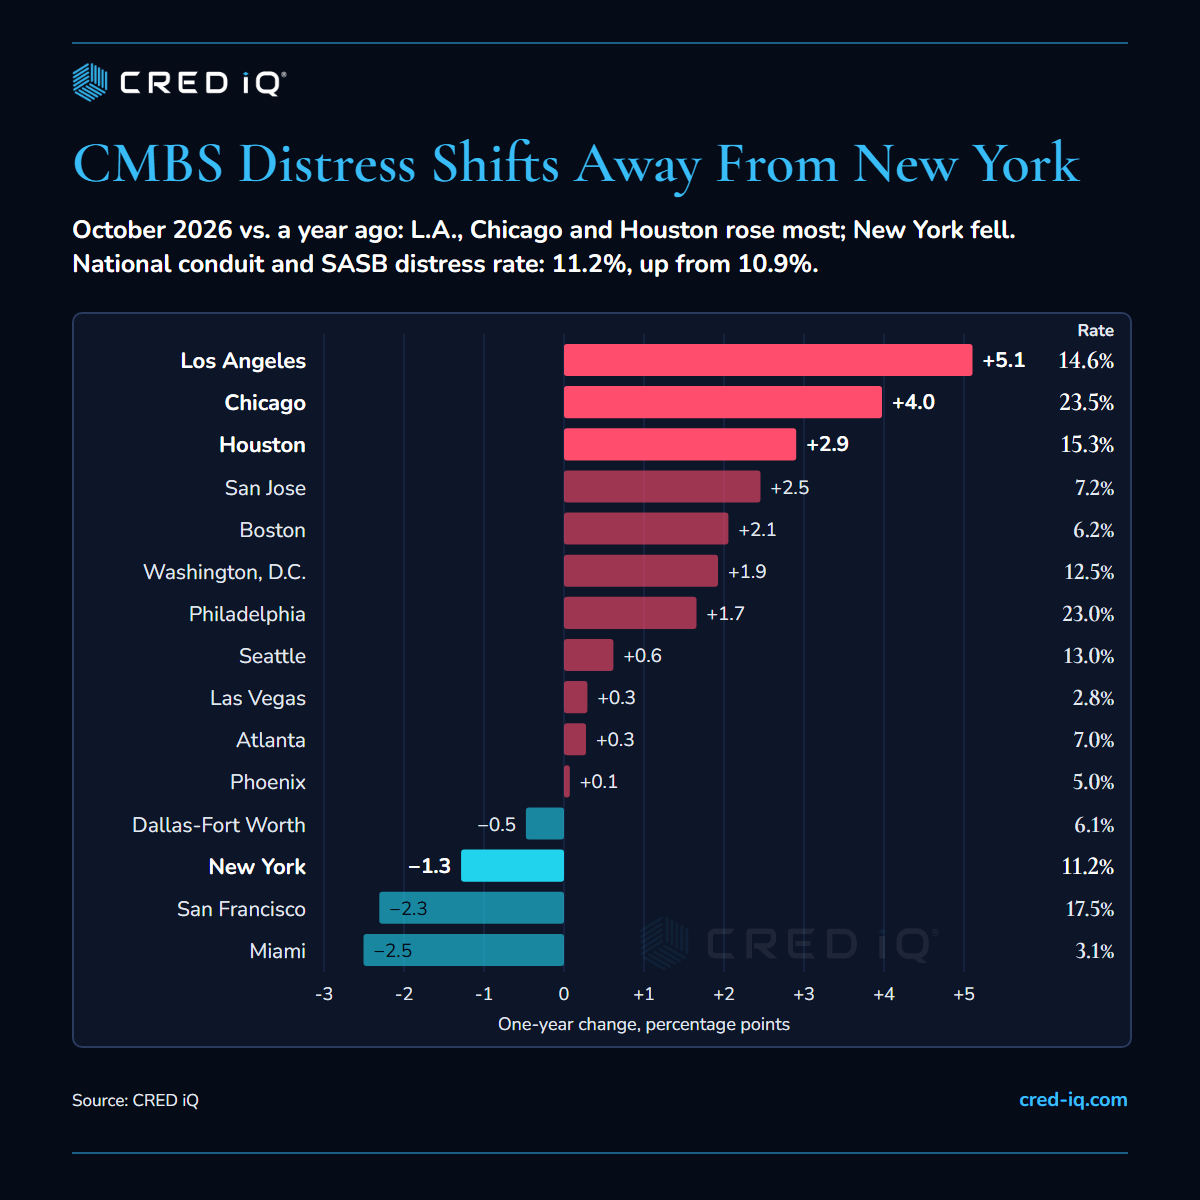
The national rate is creeping up: 11.2% of the $617 billion of conduit and SASB loans in the October remittance was delinquent, past maturity or with a special servicer, against 10.9% a year earlier. The map moved more. New York fell to 11.2% from 12.5%, while Los Angeles rose to 14.6% from 9.4%, Chicago to 23.5% from 19.5% and Houston to 15.3% from 12.4%.
| Metro | CMBS balance | Distress rate | A year ago | Change (bp) | Office distress |
|---|---|---|---|---|---|
| Chicago | $22.1B | 23.5% | 19.5% | +398 | 32.6% |
| Philadelphia | $12.0B | 23.0% | 21.3% | +166 | 37.4% |
| San Francisco | $23.2B | 17.5% | 19.8% | -231 | 5.8% |
| Houston | $14.1B | 15.3% | 12.4% | +290 | 31.5% |
| Los Angeles | $33.3B | 14.6% | 9.4% | +511 | 21.5% |
| Seattle | $11.9B | 13.0% | 12.4% | +62 | 21.3% |
| Washington, D.C. | $22.1B | 12.5% | 10.6% | +192 | 19.7% |
| New York | $147.0B | 11.2% | 12.5% | -129 | 12.7% |
| San Jose | $9.6B | 7.2% | 4.7% | +246 | 5.7% |
| Atlanta | $16.5B | 7.0% | 6.7% | +27 | 17.1% |
| Boston | $18.3B | 6.2% | 4.2% | +205 | 2.7% |
| Dallas-Fort Worth | $16.5B | 6.1% | 6.6% | -48 | 20.3% |
| Phoenix | $9.9B | 5.0% | 4.9% | +7 | 15.0% |
| Miami | $19.9B | 3.1% | 5.6% | -251 | 3.3% |
| Las Vegas | $22.0B | 2.8% | 2.5% | +29 | 1.6% |
New York Is Improving, but Its Maturities Keep Missing
New York’s October alerts were maturity failures. The Essex, a $117 million loan on a mostly residential Manhattan building, went to a special servicer after the borrower said it could not repay at its Oct. 30 maturity. The $100 million 60 Madison Avenue loan, on an office building 58% occupied at year-end, passed its Oct. 6 maturity as the borrower seeks an extension. Across the river, the $250 million loan on 101 Hudson Street in Jersey City, 65% occupied, went unpaid at its Oct. 11 maturity.
Office Trouble Spreads to L.A., Chicago and Houston
Office is 16.4% distressed nationally and 44% of all distressed balance. In Los Angeles, where office distress more than doubled to 21.5% from 9.9%, the $74 million Equitable Plaza loan missed its extended Oct. 6 maturity; the tower was last valued at $57.7 million, against $150.5 million at origination. Chicago office distress is 32.6%, and the $54 million Executive Towers West loan in suburban Downers Grove, 63% occupied, went to a special servicer. Houston office distress rose to 31.5% from 21.9%, and the strain is reaching last year’s loans: three Houston apartment loans made in 2025, $93.5 million in all, went 30 days delinquent in October.
Warehouses, Malls and Hotels Hit Their Maturity Dates
Industrial is not exempt. The $321 million LBA 2024-7IND loan, on warehouses in 10 states, matured Oct. 9 without being repaid; an extension is in process. The $325 million Fresno Fashion Fair loan went 30 days delinquent ahead of its Nov. 1 maturity, even though the mall is 97.6% occupied. A $746 million loan on more than 70 select-service hotels (THPT 2023-THL) was transferred for imminent default ahead of a Dec. 6 maturity.
| Property type | Conduit | SASB | CMBS total | CMBS a year ago | CRE CLO |
|---|---|---|---|---|---|
| Office | 20.2% | 12.9% | 16.4% | 14.7% | 19.2% |
| Mixed-use | 14.7% | 12.7% | 13.8% | 14.5% | 10.7% |
| Retail | 10.0% | 12.4% | 10.8% | 10.0% | 1.5% |
| Lodging | 11.0% | 9.3% | 9.9% | 9.2% | 5.5% |
| Multifamily | 9.4% | 7.9% | 8.7% | 9.3% | 6.3% |
| Industrial | 3.5% | 1.0% | 1.9% | 2.8% | 0.9% |
| All | 12.6% | 9.8% | 11.2% | 10.9% | 6.5% |
CRE CLOs: A Clean Headline, a Troubled Legacy Book
CRE CLO distress is 6.5% overall but 34.8% in the 17 CLOs left from 2021 and 2022, where 71% of the balance has been modified. Matured CLO loans tend to stay out of special servicing: of the 18 CLO loans flagged in October, 16 were delinquencies at or near maturity and only 2 were transfers, both notes on Tides at Wynn Palms in Las Vegas: $98 million across two 2022 MF1 deals, modified in 2025 and now covering debt service 0.50 times.
The Takeaway
Full occupancy is no protection, as 2400 Market and Fresno Fashion Fair show. The test is whether a loan can be refinanced at today’s rates and values, and in October it was failing in Los Angeles, Chicago and Houston as well as New York.
Source: CRED iQ proprietary loan-level analytics and CRED iQ Property Alerts, October 2026. Conduit and SASB/large-loan CMBS, October 2026 remittance versus October 2025 (deals whose October file has not yet loaded use their September data); CRE CLO shown separately; agency deals and defeased loans excluded. Distress = balance 30+ days delinquent, past maturity (performing or not) or in special servicing, as a share of outstanding balance. Portfolio loans allocated to metros by property. New alerts = loans newly delinquent or newly transferred to special servicing, alerts dated Oct. 1 – Oct. 29, 2026. Loan details from servicer commentary.
