CRED iQ Research | Proprietary Multifamily & CMBS Loan Analytics
Across eight Freddie Mac multifamily securitizations priced in early 2026, underwriting has tightened decisively: weighted-average debt service coverage on the conduit K-series sits at 1.41x against a 63.9% loan-to-value, with full-term or partial interest-only structures attached to roughly 95% of balance.
CRED iQ analyzed the loan-level annexes behind FREMF 2026-K179, K180, K561, K562, K563, K766, the floating-rate KF172, and the small-balance Q040, representing 472 loans and more than $7.2 billion in unpaid principal. The picture that emerges is a market that has repriced risk without abandoning leverage, leaning on interest-only relief to keep coverage above water while the rate curve stays elevated. Below we walk the dominant underwriting themes, the originators driving the volume, three loans that bring those themes to life, and where the second half of 2026 is likely headed.
What are the dominant underwriting themes in the 2026 Freddie K-series?
Coverage is being manufactured through structure, not cash flow. Fixed-rate K-deals cleared with weighted DSCRs between 1.35x and 1.51x, but those figures lean heavily on interest-only periods. Full-term IO carried about 30% of K-series balance and partial IO another 65%, meaning amortizing dollars are now the exception rather than the rule. Strip the IO benefit away and several loans underwrite near or below 1.20x on a fully amortizing basis.
Leverage held, pricing did the adjusting. Weighted LTVs clustered in the low-to-mid 60s across the fixed-rate book, in line with historical Freddie discipline. What moved was coupon: gross rates ranged from roughly 4.9% on the cleanest refinances to 5.66% on the floating KF172 pool. Acquisition activity made up about 40% of K-series balance, a healthy sign that transaction volume is returning even as borrowers absorb higher carry.
The floating-rate pool is where the stress concentrates. KF172 underwrote to a 1.21x weighted DSCR and a 68.7% LTV, the thinnest and most levered of the group, with every loan carrying SOFR-based pricing and mandatory rate caps. This is the segment to watch: coverage that looks adequate on an IO basis compresses fast if SOFR stays sticky into refinancing windows.
Who are the top originators in the 2026 K-series?
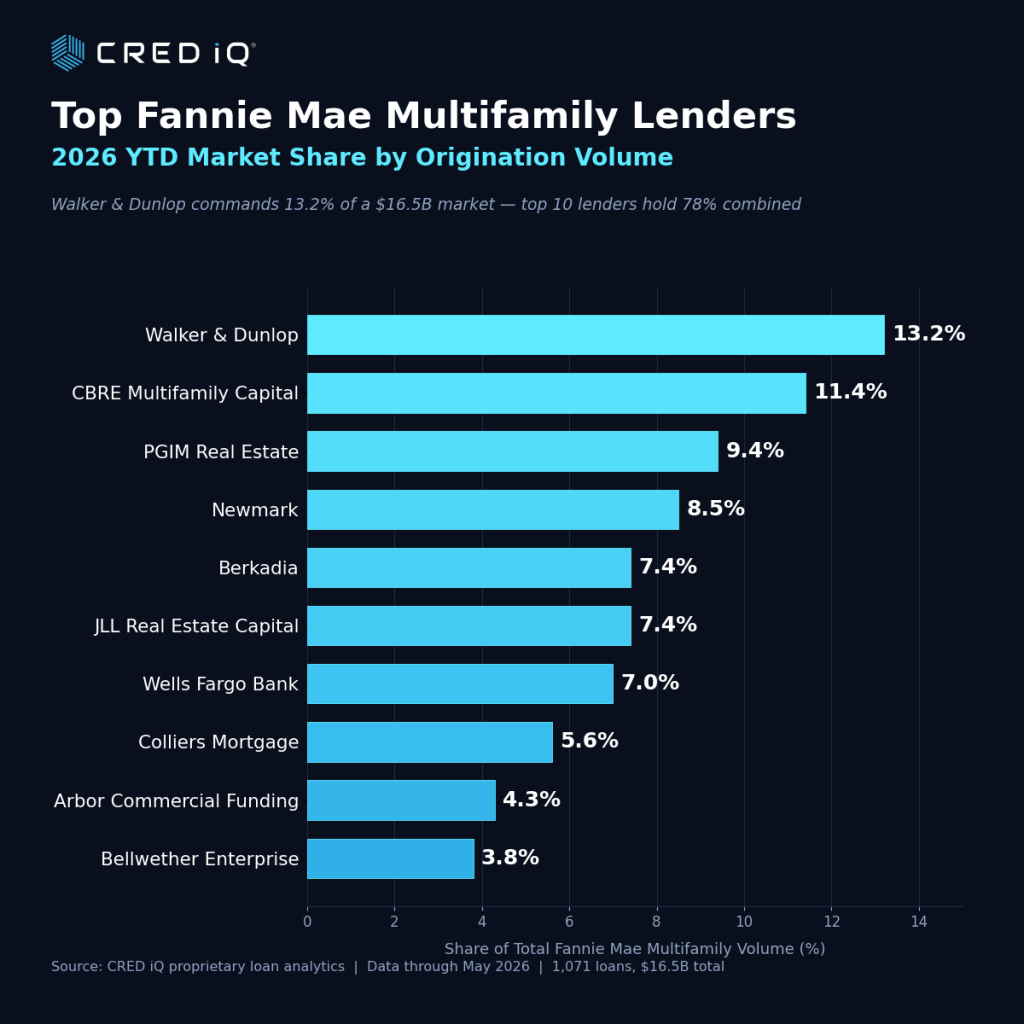
Origination is concentrated among a handful of agency specialists. CBRE Capital Markets leads with roughly $1.42 billion across the eight deals, about 20% of pooled balance, followed by Berkadia at $1.05 billion and Walker & Dunlop at $680 million. Those three alone account for more than 43% of issuance. JPMorgan Chase ranks fourth by balance but first by loan count, driven by its 228 small-balance loans in the Q040 pool. JLL, PNC Bank, Capital One, Lument, KeyBank, and PGIM round out the top ten.
The credit signal is in the spread between shops. PNC Bank’s book carries the strongest weighted coverage among large originators at 1.61x, while Lument’s sits at 1.29x, reflecting a more leveraged, IO-heavy mix. CBRE and Berkadia, the two largest, underwrite near the pool average at 1.43x and 1.35x respectively. The takeaway: balance leadership and credit conservatism are not the same thing, and the originators pushing the most paper are not always the ones pushing the thinnest coverage.
Which loans best illustrate how 2026 deals are being underwritten?
Three loans capture the spread of risk appetite in these pools, from conservative refinance to leveraged value-add acquisition.
| Centerpointe II (K179) | Rodgers Forge (K180) | Canterbury Green (KF172) |
| Irvine, CA — refinance | Baltimore, MD — acquisition | Fort Wayne, IN — acquisition |
| $140.1M balance | $78.9M balance | $159.9M balance |
| 1.48x DSCR / 64.9% LTV | 1.28x DSCR / 73.4% LTV | 1.17x DSCR / 74.1% LTV |
| Full-term IO, 5.11% fixed | Partial IO, 5.20% fixed | Floating, 30-day SOFR + 1.87% |
| Built 2015, 372 units | Built 1945, 498 units | Built 1970, 2,000 units |
Centerpointe II is the template for a clean 2026 refinance. A 2015-vintage Irvine asset at 95.4% occupancy, it carries a full-term interest-only loan at a 1.48x DSCR and a conservative 64.9% LTV against a $216 million appraisal. The borrower is not stretching; the IO simply preserves cash flow at a 5.11% coupon. This is the kind of credit Freddie can underwrite all day.
Rodgers Forge shows the cost of acquiring older product. The 1945-built, 498-unit Baltimore property was renovated in 2010 and trades at a 73.4% LTV with a partial-IO structure that lifts coverage to 1.60x during the IO window but settles to 1.28x once amortization begins. At a $158,000 balance per unit it is reasonably priced, yet the amortizing coverage leaves little room if expenses on a 1940s asset surprise to the upside.
Canterbury Green is the pool’s pressure point. At $159.9 million it is the single largest loan across all seven deals, a 2,000-unit Fort Wayne acquisition underwritten to just 1.17x amortizing coverage and a 74.1% LTV on floating-rate debt indexed to 30-day SOFR. The interest-only DSCR of 1.42x masks how thin the amortizing math is. A rate cap is required, but cap protection expires, and refinancing 2,000 units of 1970s garden product into a higher-for-longer curve is precisely the scenario that keeps credit officers up at night.
What does this mean for the second half of 2026?
We expect interest-only reliance to peak and then retreat. Lenders cannot keep pushing coverage uphill on IO alone; as the curve normalizes, look for amortizing structures to creep back into K-deals and for full-term IO to fall below a quarter of balance by year-end.
The floating-rate book will define the next distress cycle, if there is one. CRED iQ’s view is that fixed-rate K-series credit is sound, but pools like KF172 concentrate the refinancing and cap-expiry risk. Watch the sub-1.25x amortizing coverage loans in Florida and the Midwest garden segment; that is where any 2026 deterioration shows up first.
Acquisition volume keeps building. With acquisitions already near 40% of K-series balance and refinances pricing cleanly in the high-4% to low-5% range, transaction activity should accelerate into the back half of the year. Our bold call: by Q4 2026, acquisition share of new K-series issuance crosses 50% for the first time since the rate shock, signaling that multifamily price discovery has finally caught up to the cost of capital.
The bottom line: Freddie’s 2026 underwriting is disciplined on leverage, aggressive on structure, and quietly concentrating its real risk in the floating-rate corner of the program. The fixed-rate book should perform. The floating-rate book is the one to model loan by loan.
Data attributed to CRED iQ proprietary loan analytics. Figures are balance-weighted across loan-level annex disclosures for FREMF 2026-K179, K180, K561, K562, K563, K766, KF172, and Q040. cred-iq.com
About CRED iQ
CRED iQ is the enterprise data and intelligence platform powering the securitized commercial real estate market — spanning CMBS, SASB, CRE CLO, and GSE/Agency Multifamily. Delivered via web platform, API, bulk feeds, and MCP server, CRED iQ is the data provider of choice for institutional market participants and the canonical data layer for AI-driven CRE workflows. Learn more at www.cred-iq.com.