

In February, one loan on The Cosmopolitan of Las Vegas became a $3.05 billion bond deal on its own. No conduit priced this year came close: the biggest, BMARK 2026-V21, pooled 49 loans into $1.20 billion. Fifteen single-borrower and large-loan deals were bigger than that.
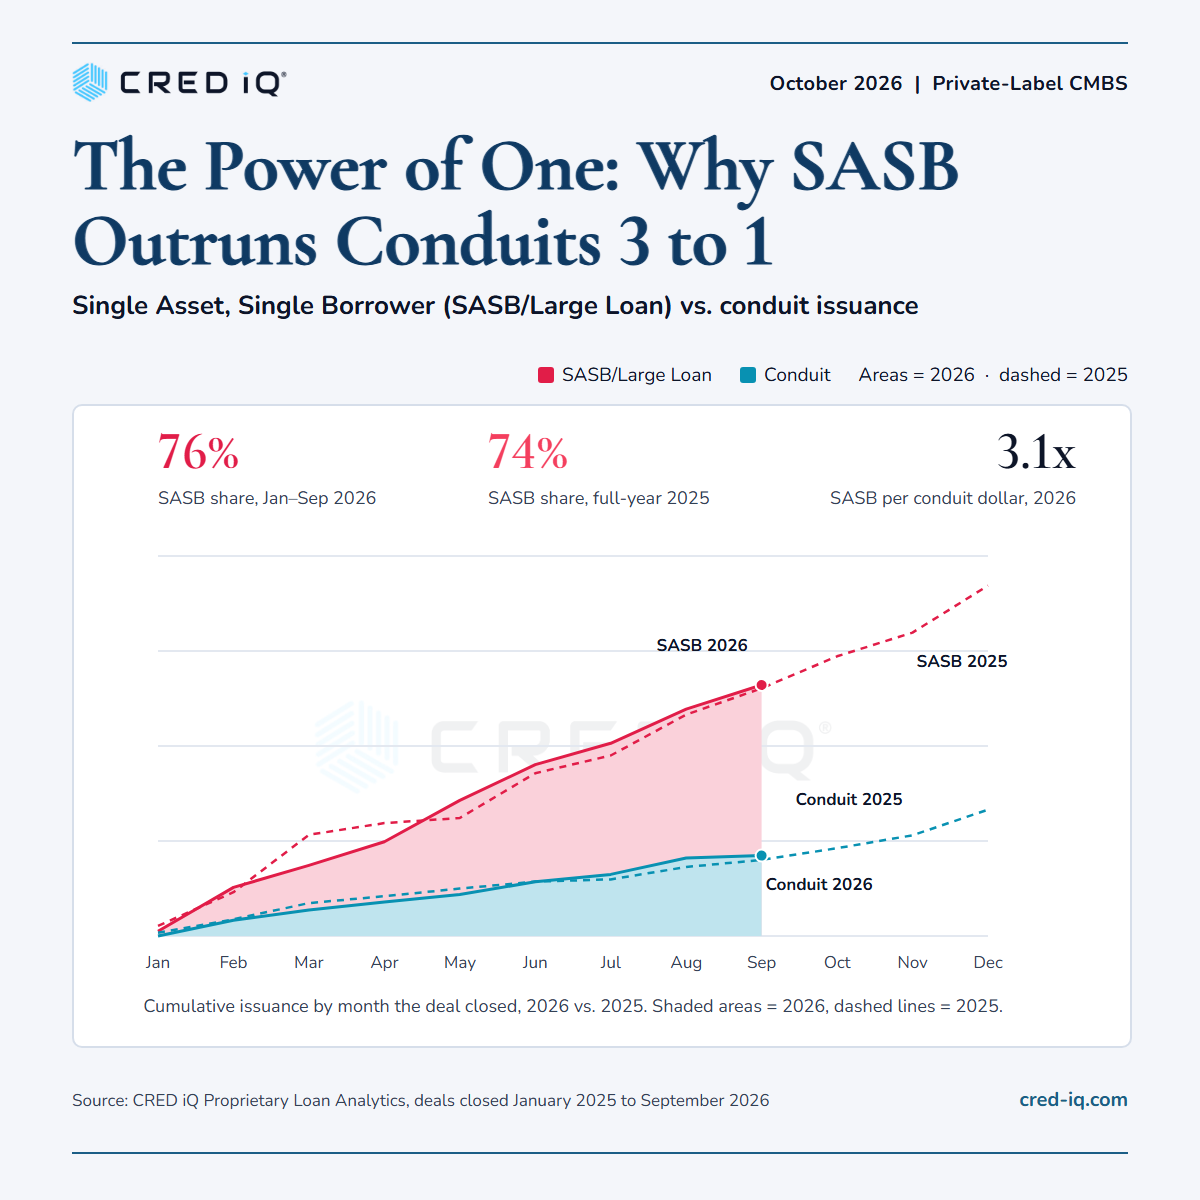
That is the market in 2026. Through September, single-asset, single-borrower (SASB) and large-loan deals totaled $66.0 billion, against $21.2 billion of conduits: $3.12 for every conduit dollar, and 76% of private-label CMBS issuance. Combined volume of $87.2 billion is up 2% from the same months of 2025, with SASB up 1% and conduits up 6%. SASB out-issued conduits in every month of the year.
| Deal type | 2026 deals | 2026 volume | 2025 deals | 2025 volume | Change |
|---|---|---|---|---|---|
| SASB / large loan | 95 | $66.0B | 91 | $65.2B | +1% |
| Conduit | 28 | $21.2B | 27 | $20.0B | +6% |
| Total | 123 | $87.2B | 118 | $85.2B | +2% |
It wasn’t always this way. In the first nine months of 2017, 2019, 2020 and 2023, conduits out-issued single-borrower deals, and SASB’s share was 42% in 2017. Conduit volume has stayed in a narrow band, $13 billion to $28 billion in each January-to-September stretch, while SASB volume has more than doubled. SASB surges in strong years (2021, 2024 onward) and retreats in weak ones: its share fell to 37% in 2020 and 47% in 2023.
The biggest SASB deals read like a list of the country’s marquee assets. After The Cosmopolitan come a $2.1 billion Jersey City multifamily portfolio, a $2.05 billion QTS data center portfolio financed by nine banks, and $1.9 billion on Two Manhattan West. Manhattan office and mixed-use towers, including 9 West 57th Street, One Madison Avenue and 10 Hudson Yards, fill out the top ten.
Where the Money Went
The two channels finance different buildings. Conduits remain the home of everyday collateral: multifamily is 26% of conduit balance and retail 13%, spread across 1,067 loans averaging $20 million. SASB money goes to trophy assets and big portfolios. Office is still the largest SASB property type at 19% of balance, but SASB office volume fell to $12.5 billion from $22.4 billion a year earlier, and SASB retail halved to $5.1 billion. Apartments and hotels took up the slack: SASB multifamily rose to $10.0 billion from $2.9 billion and hotels to $11.3 billion from $8.8 billion, while data centers reached $6.2 billion, 9% of SASB balance. Across both channels, multifamily’s share more than doubled to 18% from 8%, while retail fell to 9% from 16%.
Structure differs too: 60% of SASB balance is floating-rate, while conduit loans are fixed, 90% of them interest-only, at a weighted average coupon of 6.43%.
| Property type | SASB / large loan | Conduit | All 2026 | All 2025 |
|---|---|---|---|---|
| Office | 19% | 17% | 18% | 30% |
| Multifamily | 15% | 26% | 18% | 8% |
| Hotel | 17% | 12% | 16% | 13% |
| Industrial | 13% | 10% | 12% | 14% |
| Mixed use | 11% | 10% | 11% | 7% |
| Retail | 8% | 13% | 9% | 16% |
| Data center | 9% | 0% | 7% | 6% |
| Self storage | 3% | 5% | 4% | 3% |
| Manufactured housing | 0% | 4% | 1% | 1% |
| Other | 5% | 4% | 5% | 1% |
The Originator Leaderboard
Seven banks write most of it. Goldman Sachs, Wells Fargo and Citi lead CRED iQ’s 2026 ranking of loans contributed to conduit and SASB deals, and the top seven account for 80% of the attributed volume. Goldman Sachs originated $12.0 billion, $10.1 billion of it in SASB deals. Citi led conduit lending with $2.6 billion. The ranking has barely moved from 2025: the same eight banks make the top eight, with Citi climbing to third and Morgan Stanley slipping to fifth.
| Rank | Originator | Total | SASB | Conduit | Deals | 2025 rank |
|---|---|---|---|---|---|---|
| 1 | Goldman Sachs | $12.0B | $10.1B | $1.9B | 49 | 2 |
| 2 | Wells Fargo | $11.8B | $9.5B | $2.3B | 46 | 1 |
| 3 | Citi | $9.8B | $7.2B | $2.6B | 31 | 4 |
| 4 | JPMorgan | $8.6B | $7.2B | $1.4B | 36 | 5 |
| 5 | Morgan Stanley | $8.3B | $6.5B | $1.8B | 33 | 3 |
| 6 | Bank of America | $6.8B | $5.0B | $1.8B | 28 | 6 |
| 7 | Deutsche Bank | $5.9B | $4.3B | $1.6B | 26 | 7 |
| 8 | Barclays | $3.6B | $2.0B | $1.5B | 23 | 8 |
The Takeaway
Issuance is running slightly ahead of last year, and SASB still sets the pace with three of every four private-label dollars. What has changed is the collateral: less office and retail, more apartments, hotels and data centers. Conduits keep financing the broad middle of the market, one $20 million loan at a time, but the big money in 2026 is moving one asset at a time.
Source: CRED iQ proprietary loan-level analytics, October 2026. Private-label CMBS: conduit and single-asset, single-borrower / large-loan deals that closed January through September of each year, measured at the deal’s initial loan balance; CRE CLO, Freddie Mac and single-family rental deals excluded. Originator credit is split equally among co-originators on each loan.
