

SS = All specially serviced CMBS loans in the conduit and SASB universe, including current, delinquent and REO
DQ + SS = All distressed CMBS loans in the conduit and SASB universe that are delinquent, specially serviced, or a combination of both
The CRED iQ overall delinquency rate for CMBS continued its downward trend this month with a sharp decline, representing the 21st consecutive month-over-month improvement. The delinquency rate, equal to the percentage of all delinquent specially serviced loans and delinquent non-specially serviced loans, for CRED iQ’s sample universe of $500+ billion in CMBS conduit and single-asset single-borrower (SASB) loans was 4.02%, which compares to the prior month’s rate of 4.32%. CRED iQ’s special servicing rate, equal to the percentage of CMBS loans that are with the special servicer (delinquent and non-delinquent), declined month-over-month to 6.43% from 6.91%. The special servicing rate has declined for three consecutive months. Aggregating the two indicators of distress – delinquency rate and special servicing rate – into an overall distressed rate (DQ + SS%) equals 6.60% of CMBS loans that are specially serviced, delinquent, or a combination of both. The overall distressed rate declined compared to the prior month rate of 6.87%. The overall distressed rates typically track slightly higher than special servicing rates as most delinquent loans are also with the special servicer.

SS = All specially serviced CMBS loans in the conduit and SASB universe, including current, delinquent and REO
DQ + SS = All distressed CMBS loans in the conduit and SASB universe that are delinquent, specially serviced, or a combination of both
Individual delinquency rates by property type declined compared to the prior month, except for a nominal increase in delinquent loans secured by industrial properties. Lodging exhibited the highest volume of improvement with nearly $200 million in delinquency cures, loans that have paid current or paid off in full after delinquency in the prior month. The lodging delinquency rate was 8.46%, which compared to 8.95% last month. The retail delinquency rate was 7.41%, a decline from 7.73% in the prior month. The spread between the lodging and retail delinquency rates has narrowed significantly over the trailing 12 months – there was 5.49% variance between lodging and retail delinquency as of February 2021 compared to a 1.05% variance as of the current month. The lodging sector has exhibited a trend of curing delinquencies more expeditiously than retail properties, indicating signs of permanent impairment within the retail sector. A crossover event — where the lodging delinquency rate declines below the retail delinquency rate — is within the range of possibilities over the course of the next year based on the delinquency trends over the past year.
One of the more notable new delinquencies this month was the $425 million Woodlands Mall loan, which is secured by a 758,231-sf regional mall in The Woodlands, TX. Additionally, the $77.1 million Bellis Fair Mall loan, secured by a 538,226-sf regional mall in Bellingham, WA, failed to pay off at maturity. The maturity default was likely anticipated by market constituents given the loan’s debt service coverage ratio (DSCR) of 1.06 based on net cash flow through the first nine months of 2021 coupled with sub-optimal collateral occupancy of 80%.
With the exception of multifamily, special servicing rates declined compared to the prior month across all major property types. Multifamily transfers to special servicing included two properties located in the Permian Basin region of southwest Texas — Aviare Place and University Gardens. The multifamily special servicing rate was 2.55%, which increased compared to 2.49% last month. The lodging sector had the highest special servicing rate (13.19%), which was following by retail (11.47%) and office (3.31%). Although the office special servicing rate tracked lower compared to last month (3.46%), the percentage of office loans in special servicing is still higher than special servicing rates from 6 months and 12 months prior.
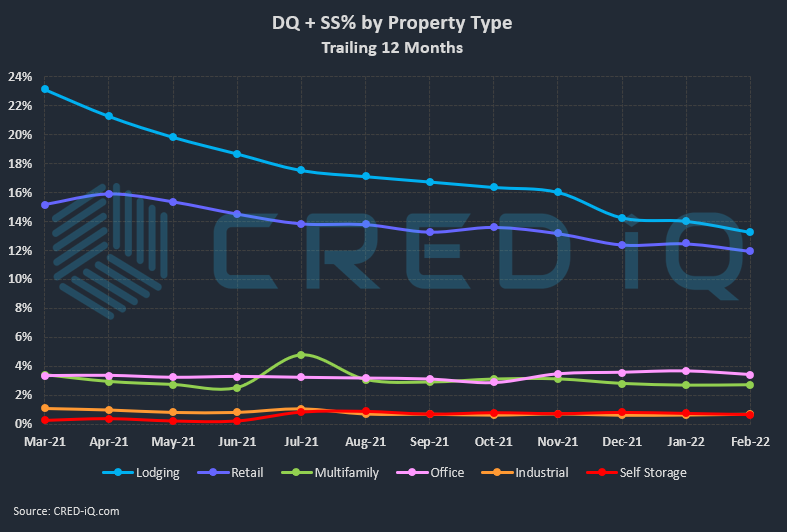
CRED iQ’s overall CMBS distressed rate (DQ + SS%) by property type accounts for loans that qualify for either delinquent or special servicing subsets. This month, overall distressed rates for lodging, retail, office, and self storage declined while multifamily and industrial exhibited modest increases in overall distress. Two of the largest loans to transfer to special servicing this month were secured by office properties — the $46.7 million Princeton South Corporate Center loan, secured by 267,426-sf office property in Ewing, NJ, and the $36.6 million 55 Green Street loan, secured by a 54,414-sf office building located in San Francisco’s Financial District. For additional information about these 2 loans, click View Details below:
| [View Details] | [View Details] | |
| Loan | Princeton South Corporate Center | 55 Green Street |
| Balance | $46,709,131 | $36,600,000 |
| Special Servicer Transfer Date | 2/7/2022 | 1/28/222 |
About CRED iQ
CRED iQ is a commercial real estate data, analytics, and valuation platform providing actionable intelligence to CRE and capital markets investors. Subscribers to CRED iQ use the platform to identify valuable leads for leasing, lending, refinancing, distressed debt, and acquisition opportunities. Our data platform is powered by over $2.0 trillion of CMBS, CRE CLO, SBLL, and GSE Agency loan and property data.
