A CRED iQ Preliminary Analysis
DATA HEREIN PROVIDED TO CRED IQ IS FROM A PRELIMINARY PROSPECTUS AND MAY BE AMENDED OR SUPPLEMENTED PRIOR TO TIME OF SALE
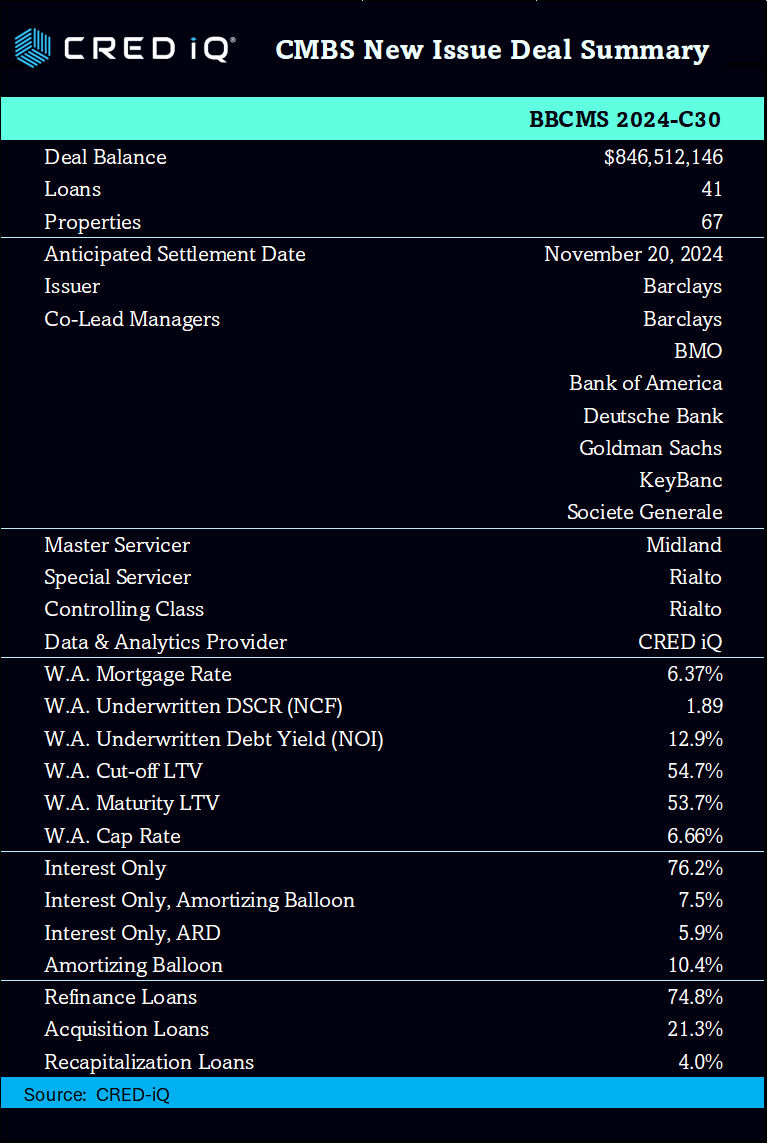
Deal Overview
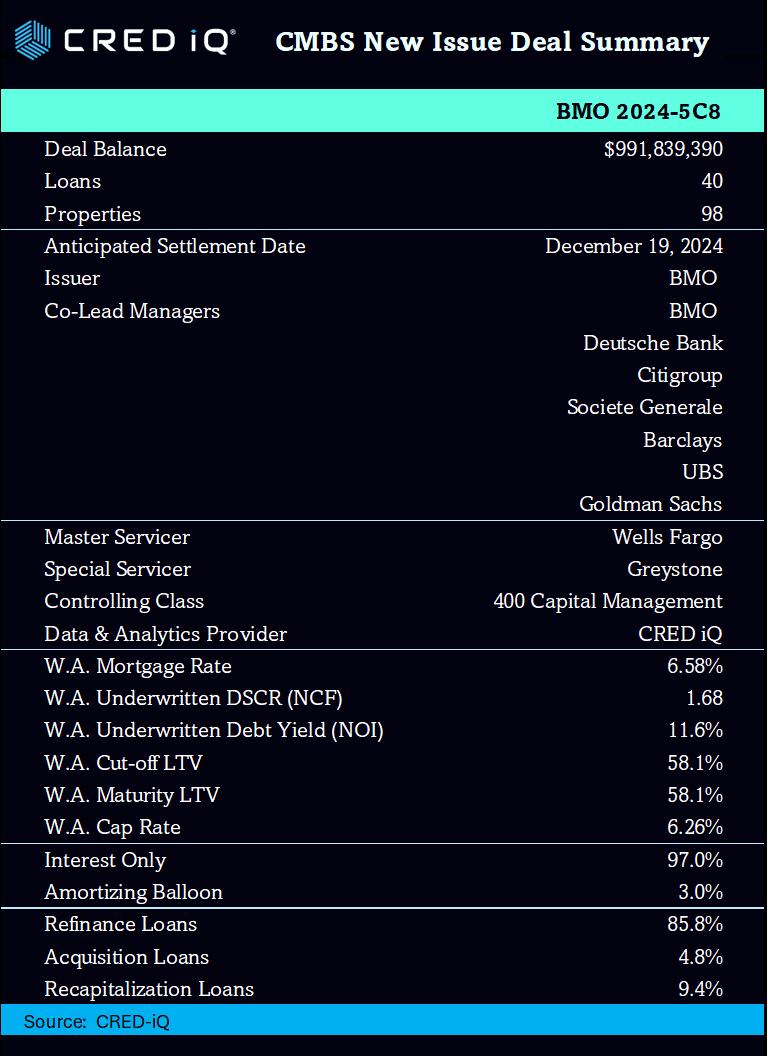
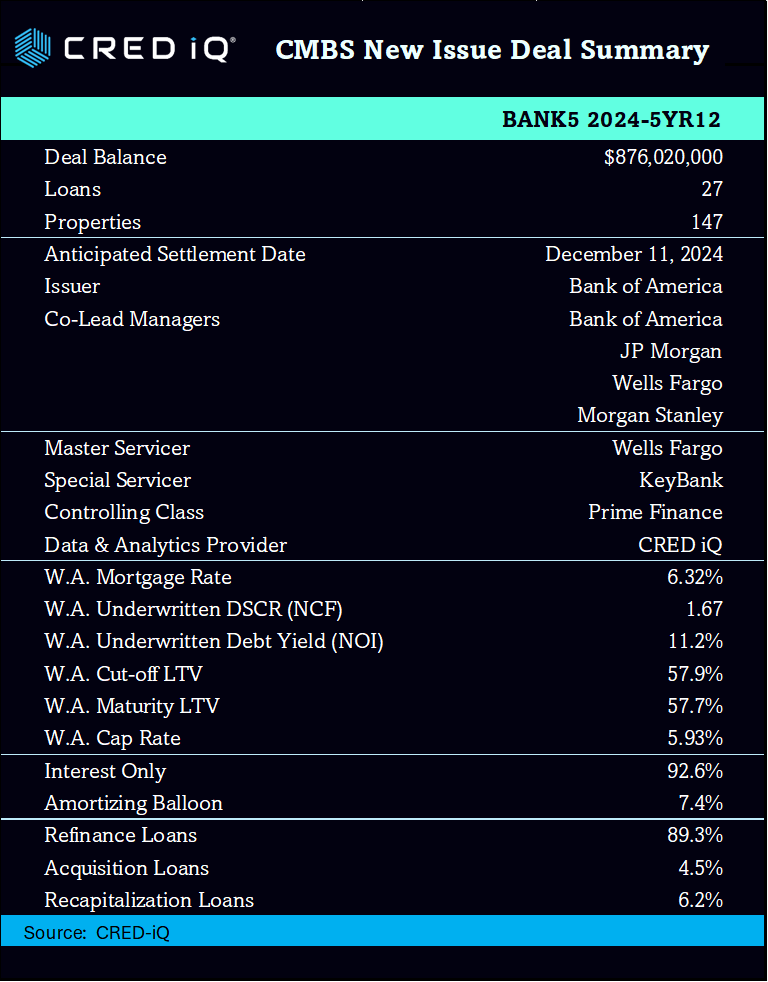
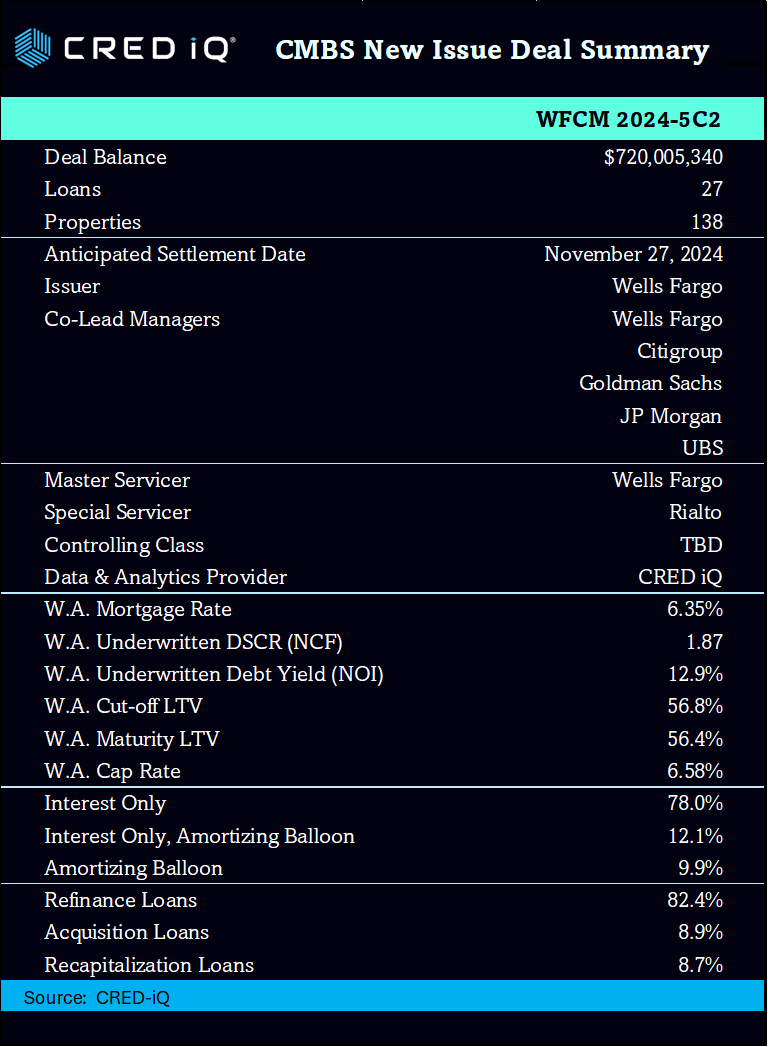
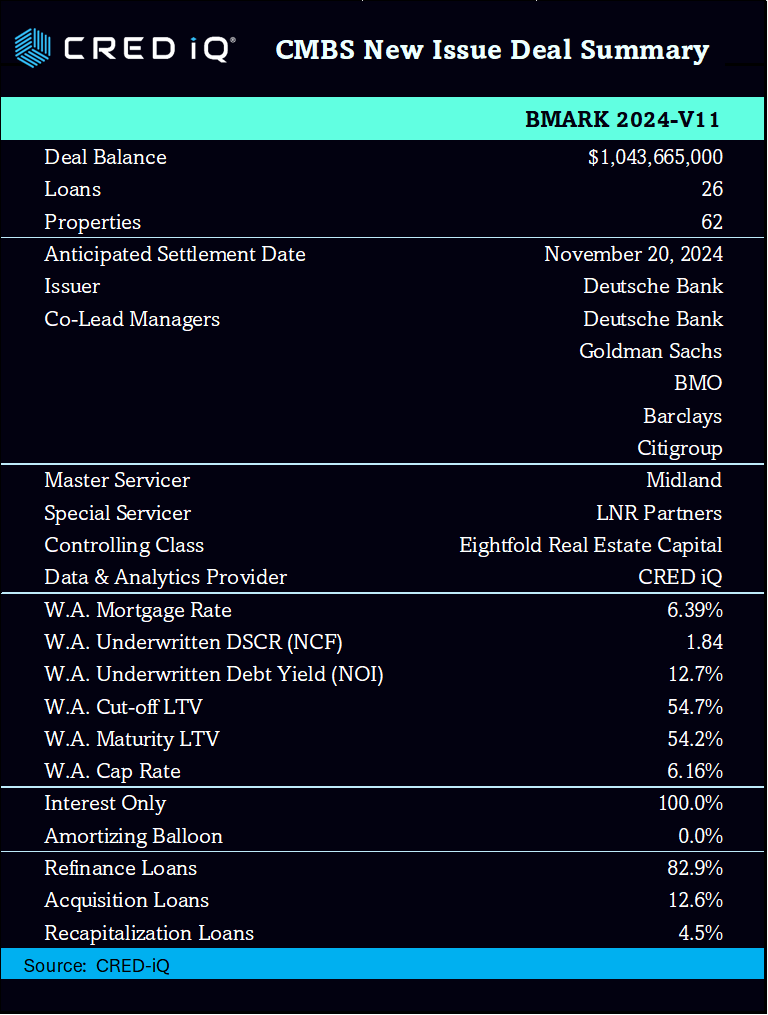
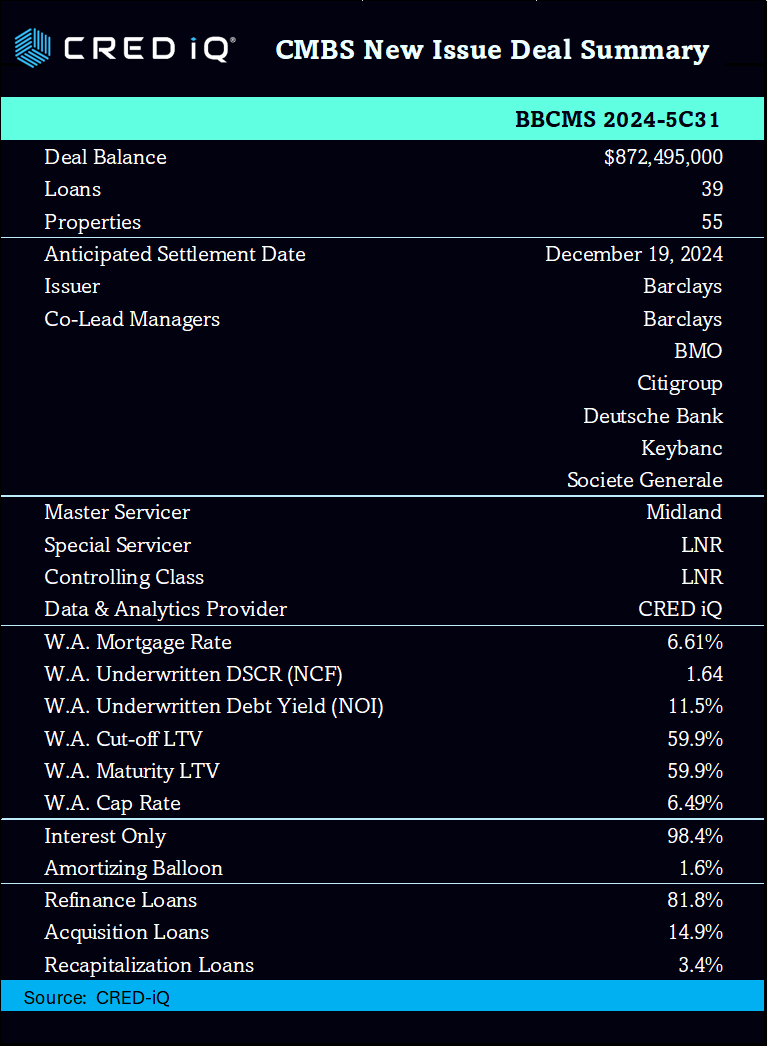
The BBCMS 2024-5C31 CMBS deal is a new issuance securitization for the CMBS market, with a total pooled balance of approximately $872.5 million. The deal is jointly managed by prominent financial institutions including Barclays, BMO, Citigroup, Deutsche Bank, Keybanc, and Societe Generale. The deal is collateralized by 39 loans and secured by 55 properties across a variety of sectors, including retail, multifamily, and mixed use. The strategic geographic distribution of these properties ensures balanced exposure across major markets. The deal’s weighted average loan-to-value (LTV) ratio of 59.9%, and the weighted average mortgage interest rate is 6.61%.
Key Metrics
The loan pool for BBCMS 2024-5C31is structured to include a mix of amortizing and interest-only loans, with 1.6% of the mortgage pool having scheduled amortization. The remainder of the pool (98.4%) consists of interest-only payments throughout the loan term, offering investors a steady income stream. The pool boasts a weighted average debt service coverage ratio (DSCR) of 1.64x. The weighted average net operating income (NOI) debt yield is 11.5%.
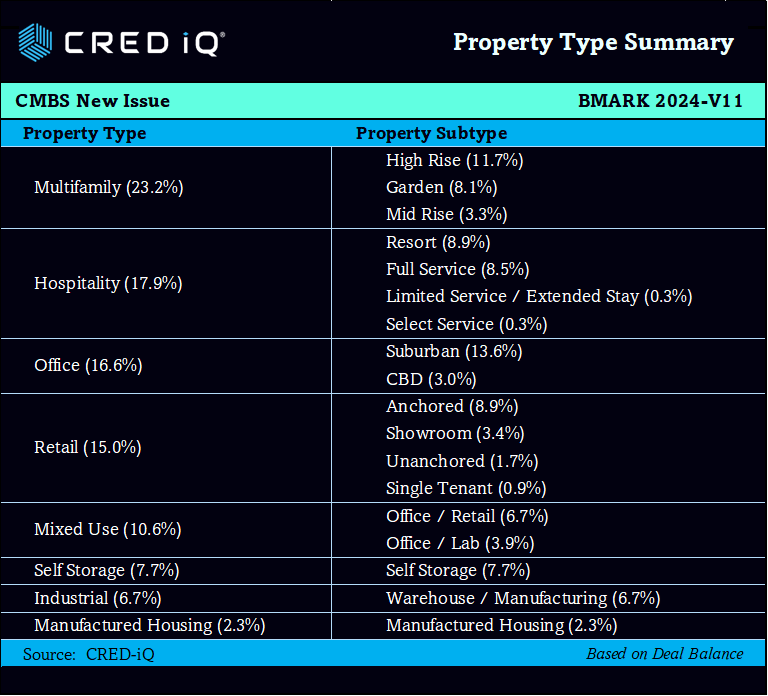
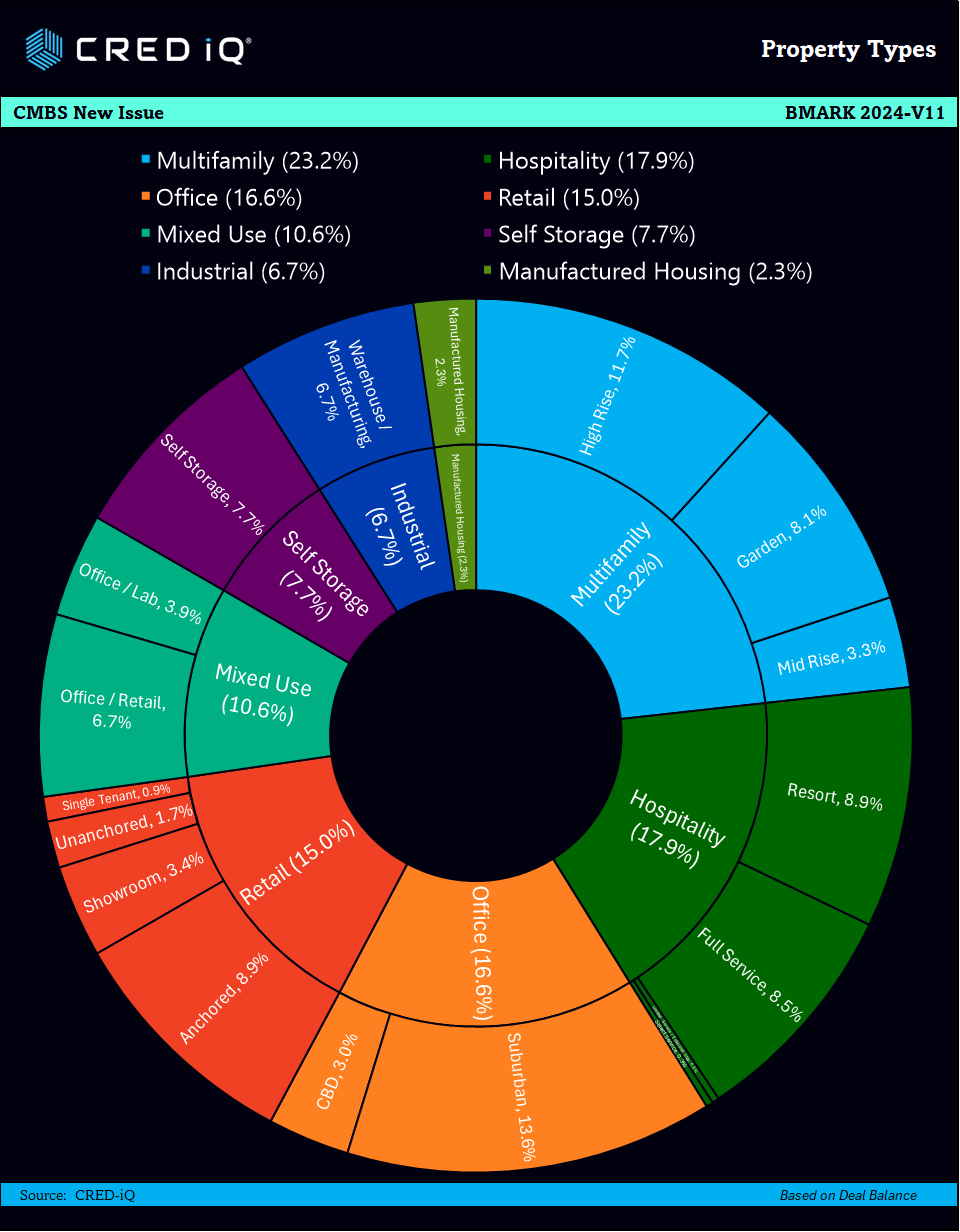
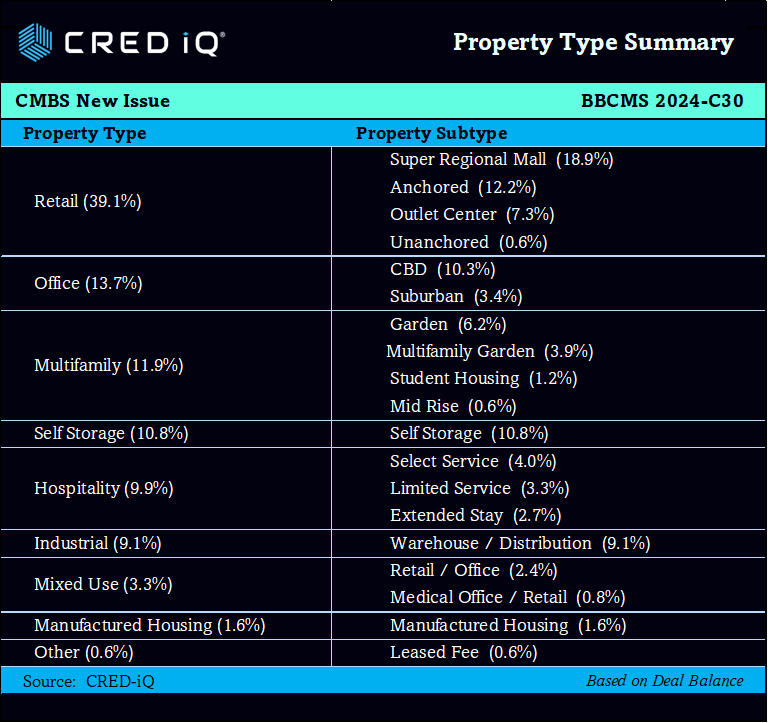
Geography & Property Types
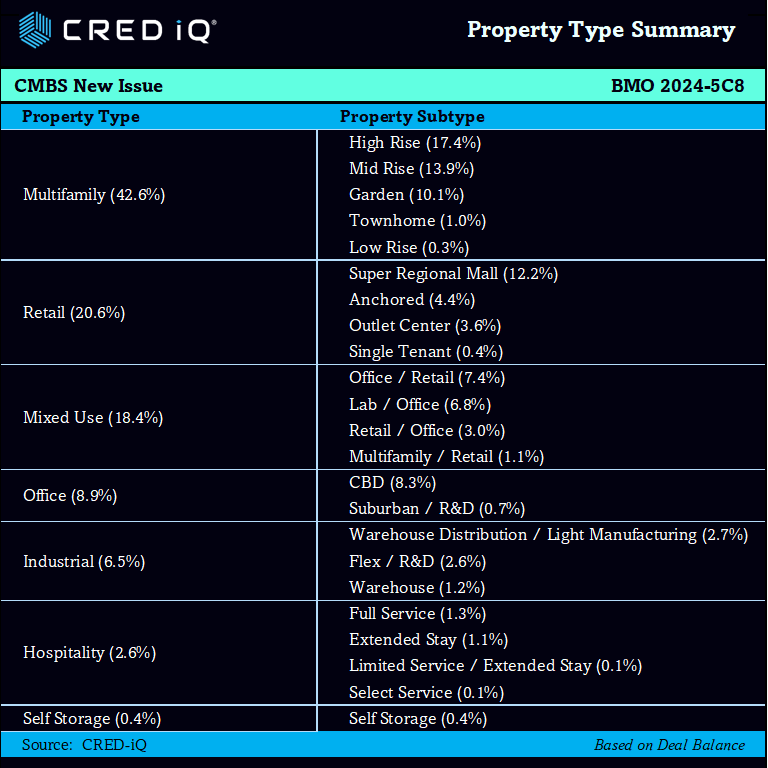
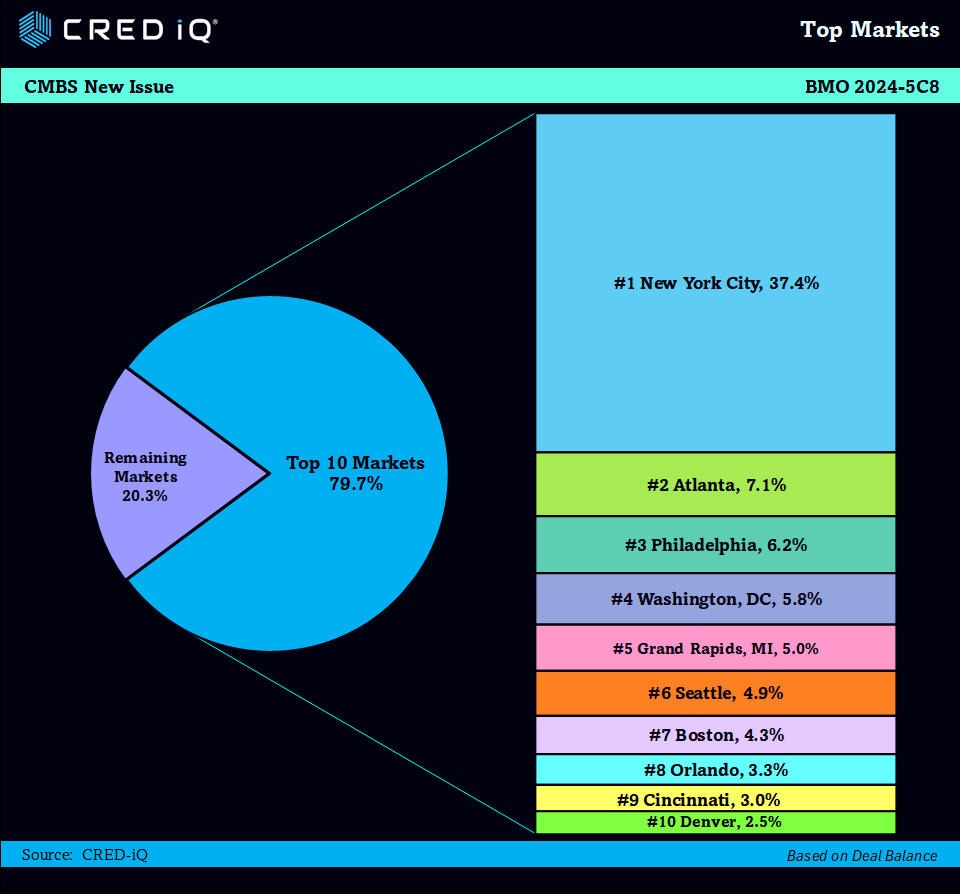
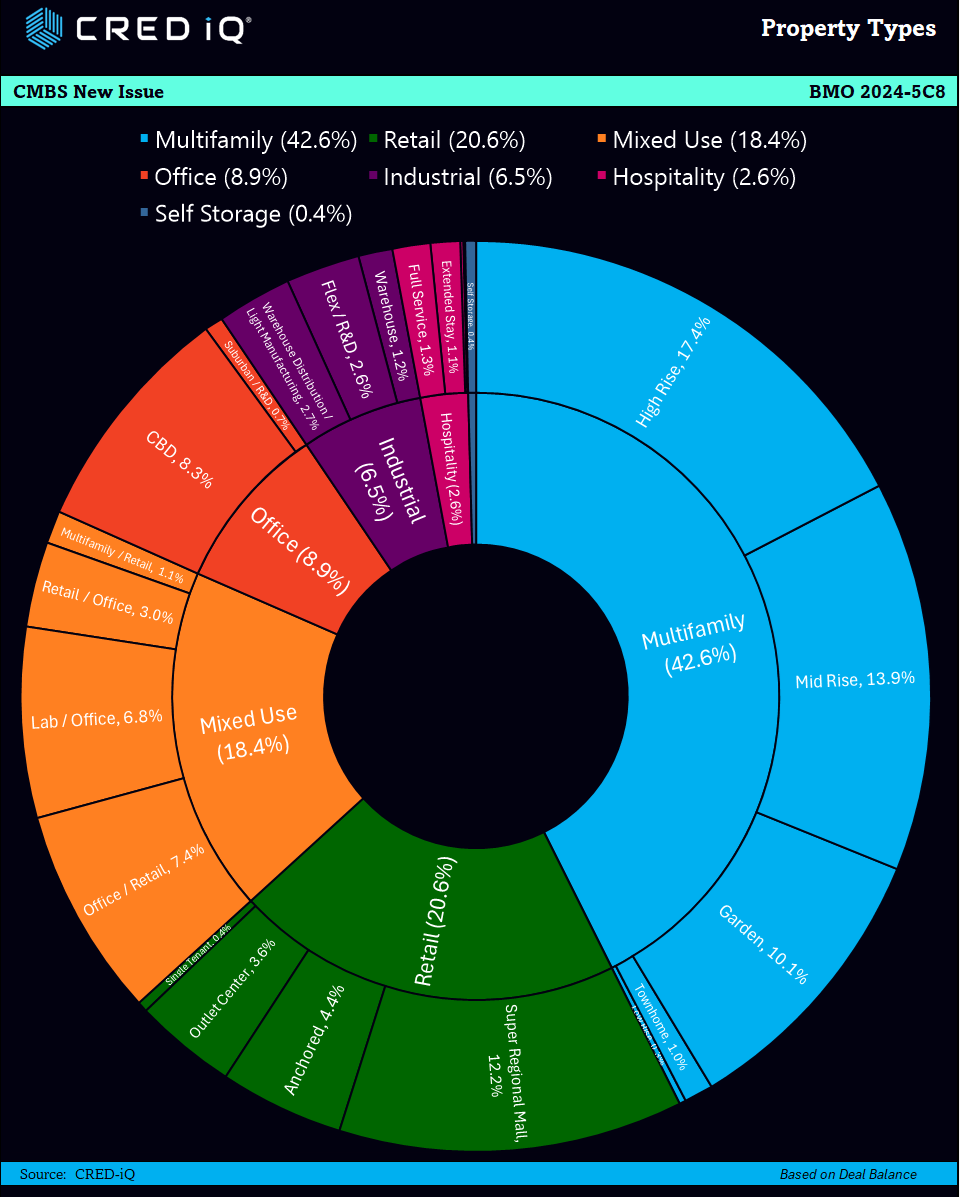
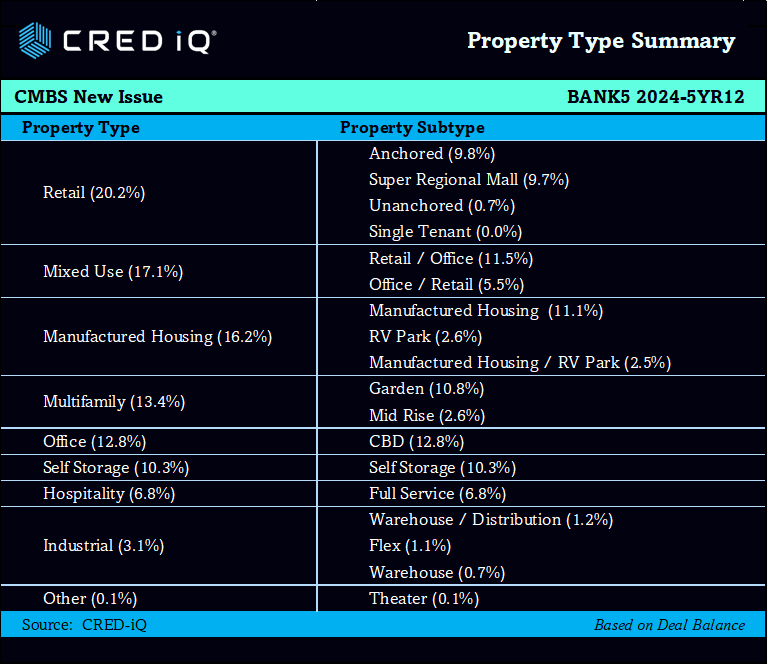
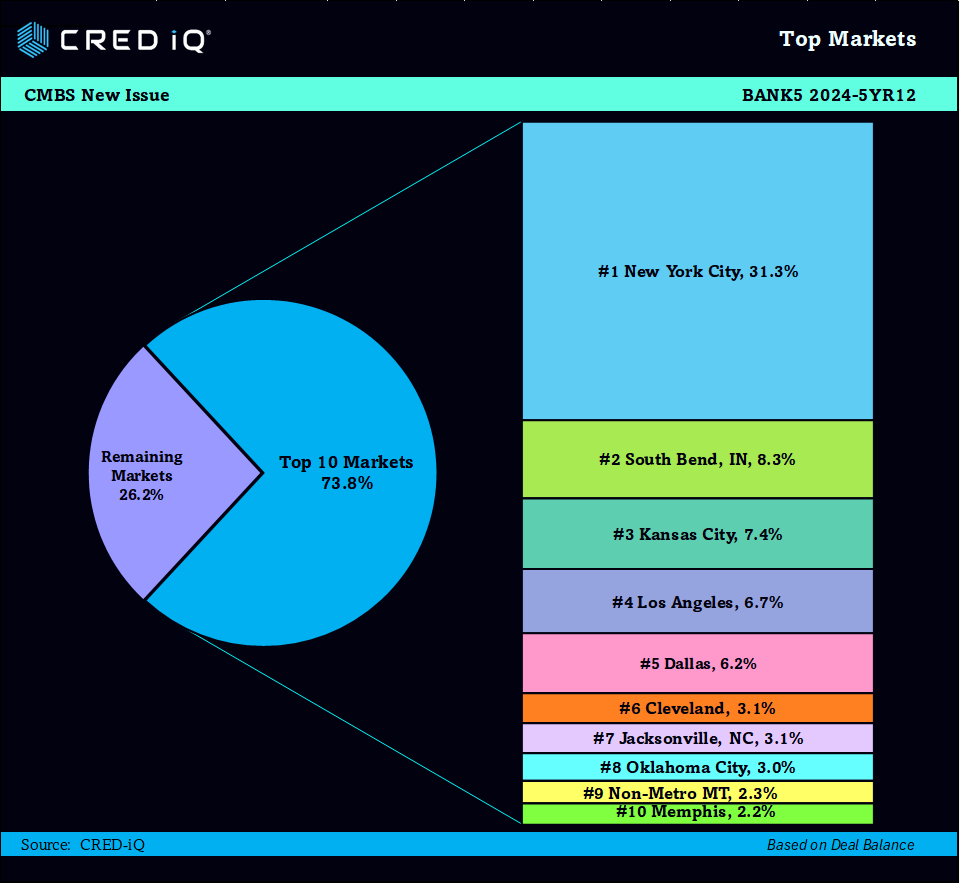
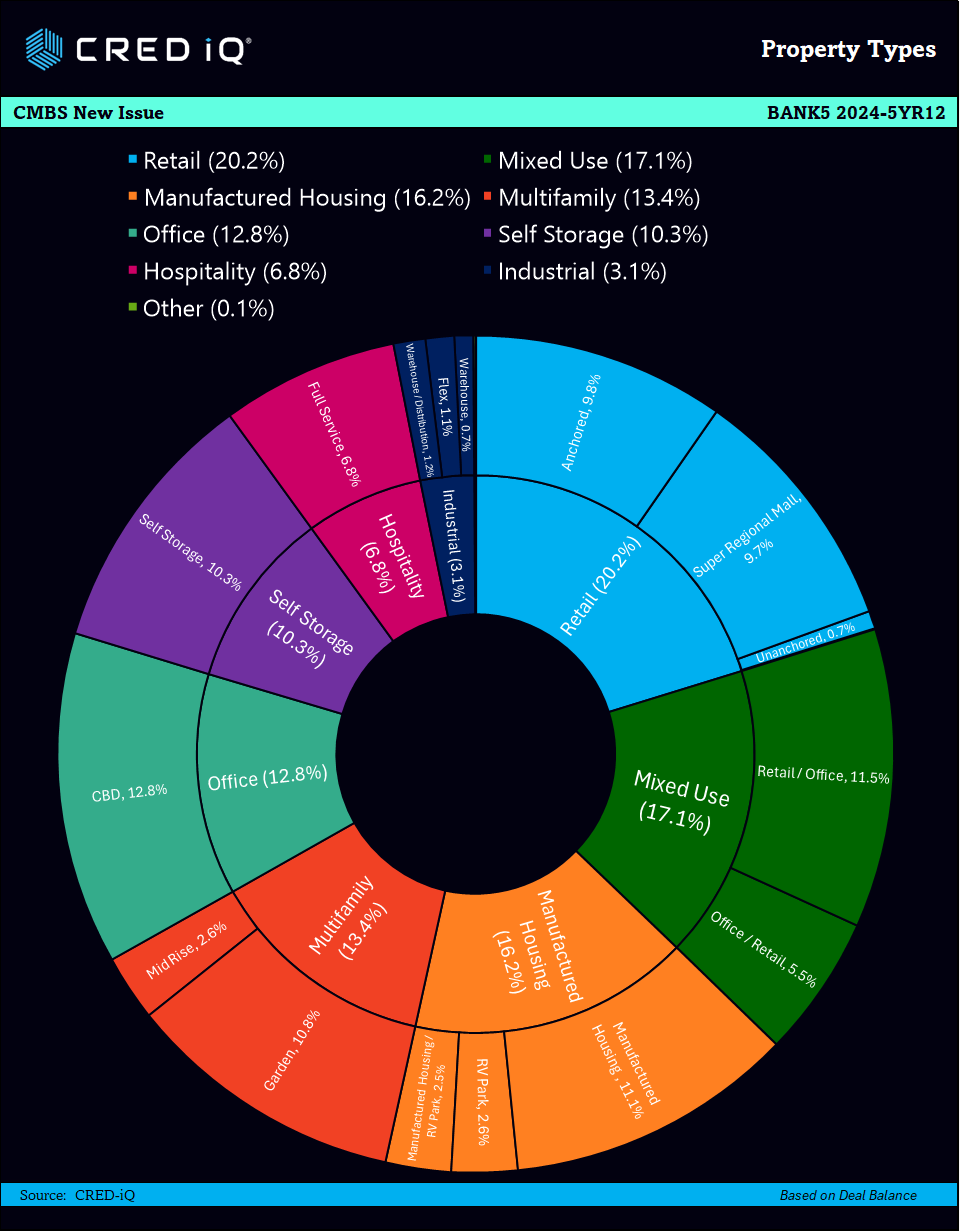
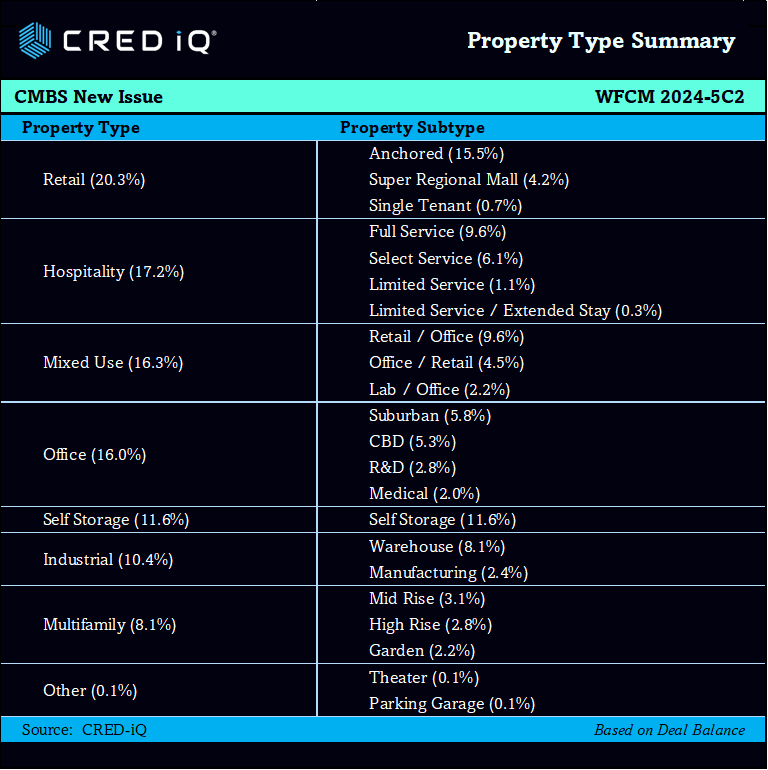
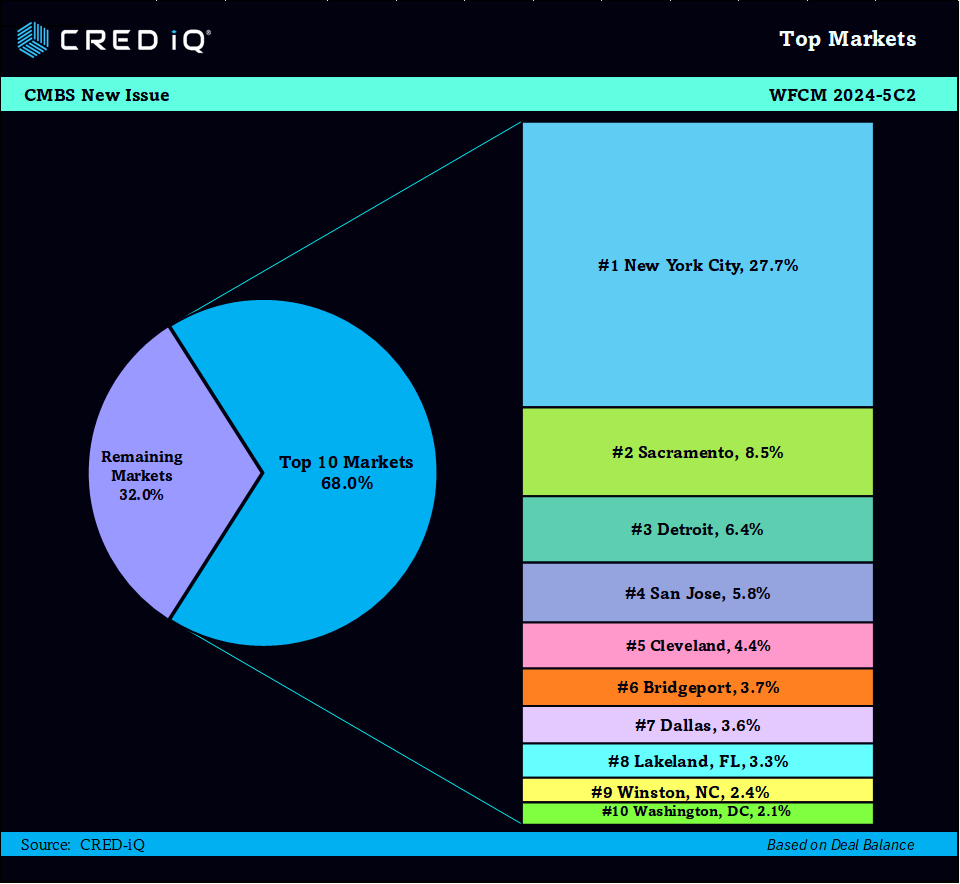
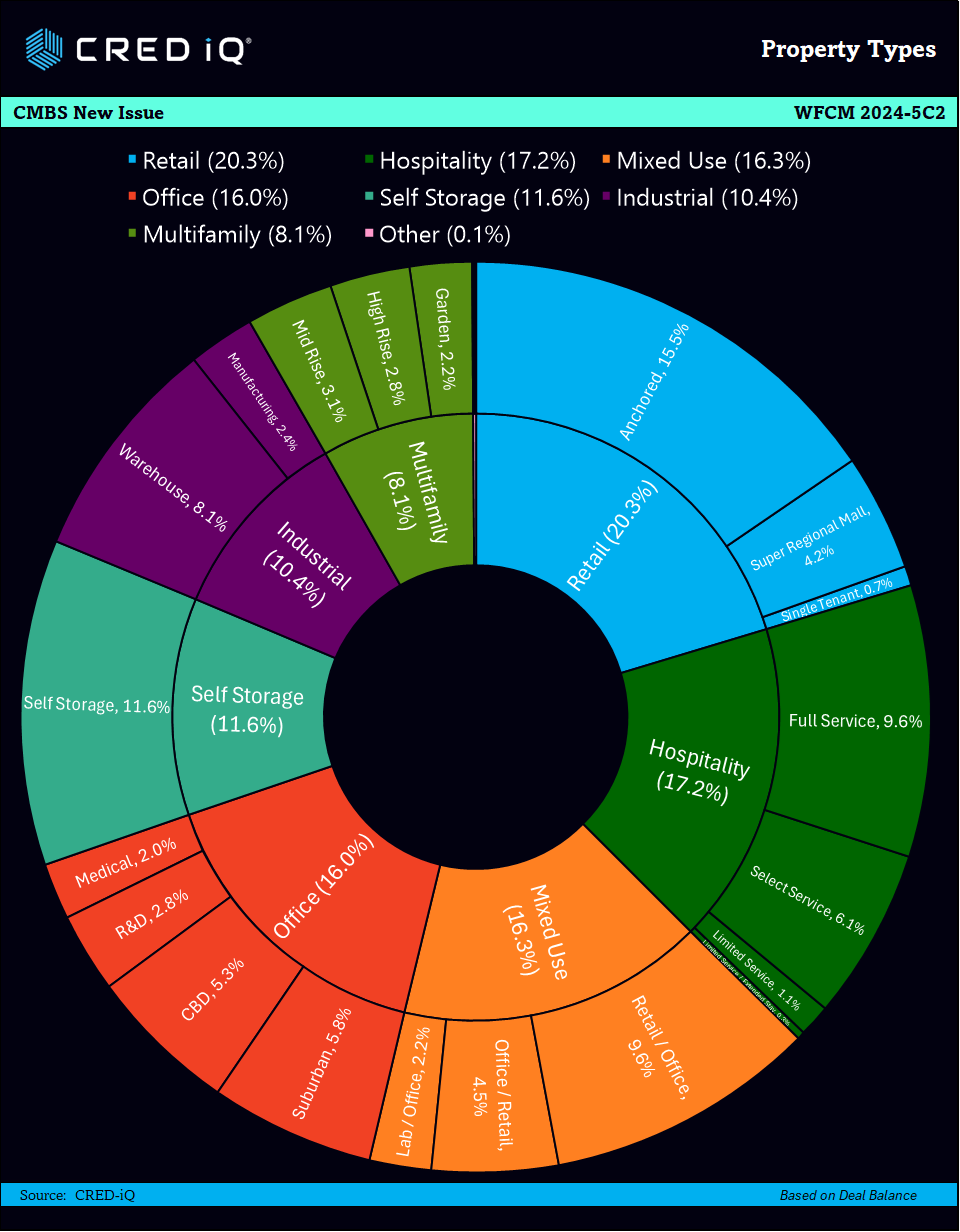
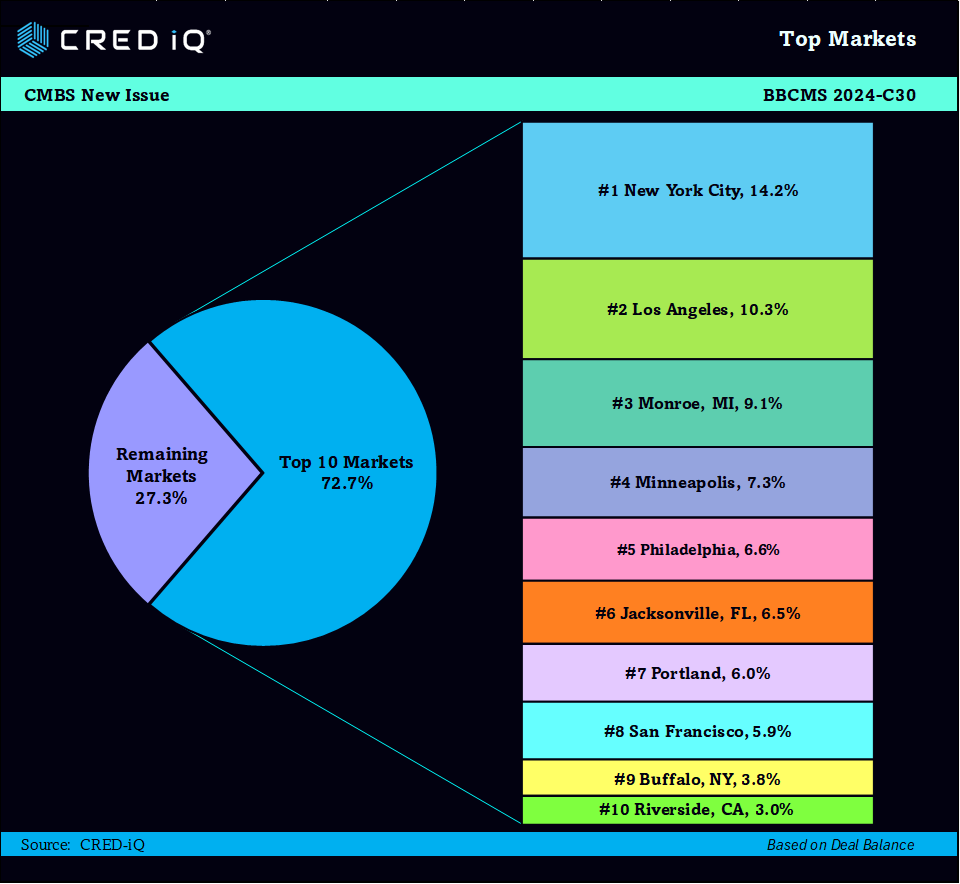
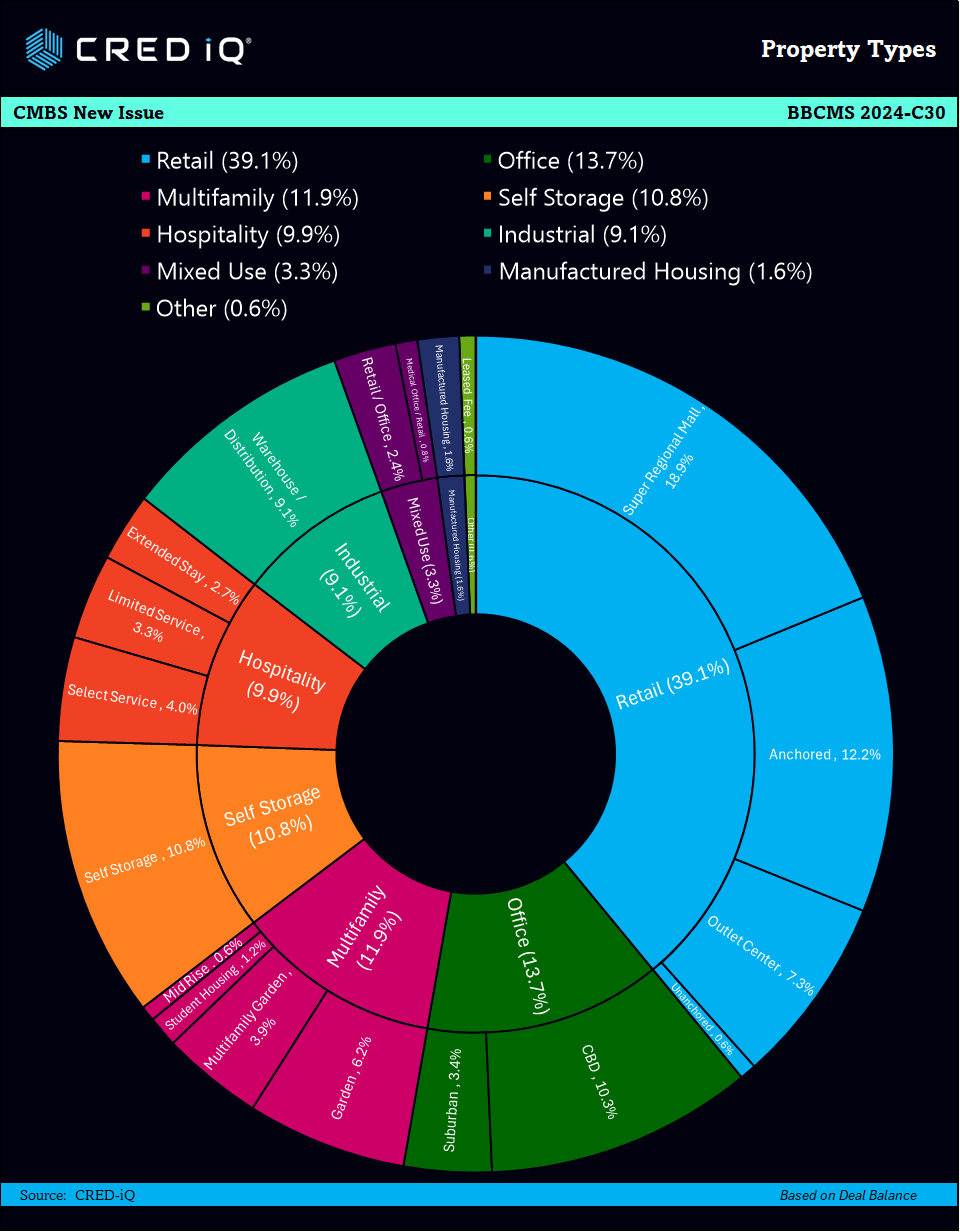
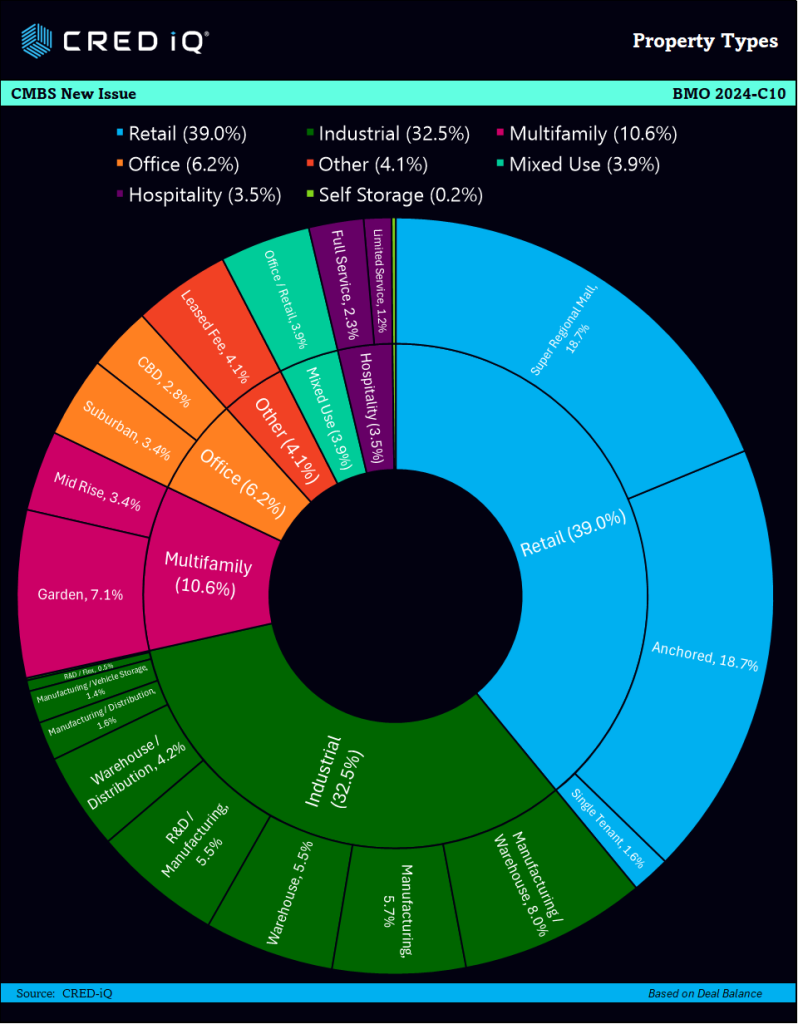
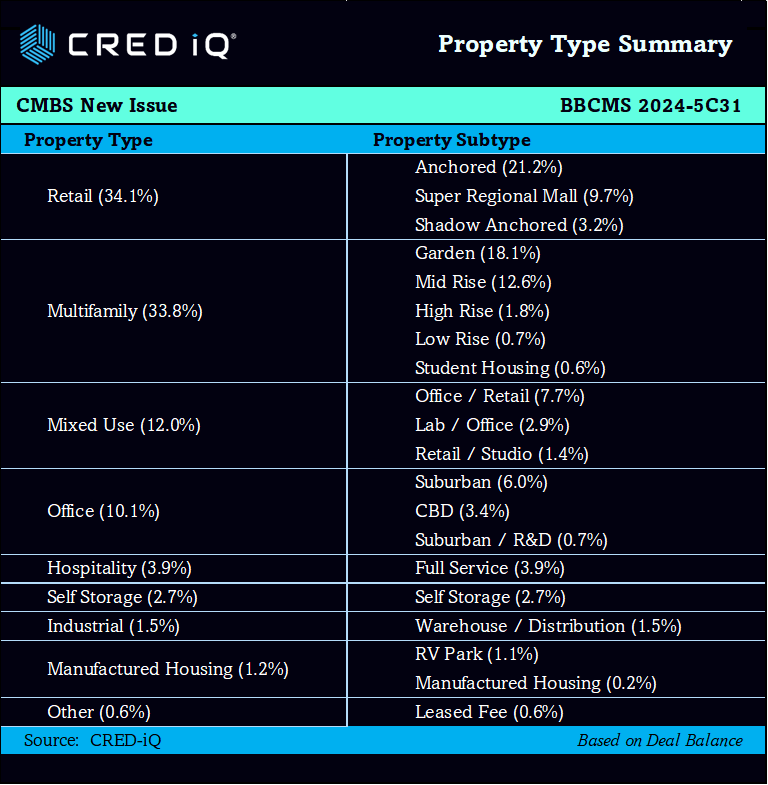
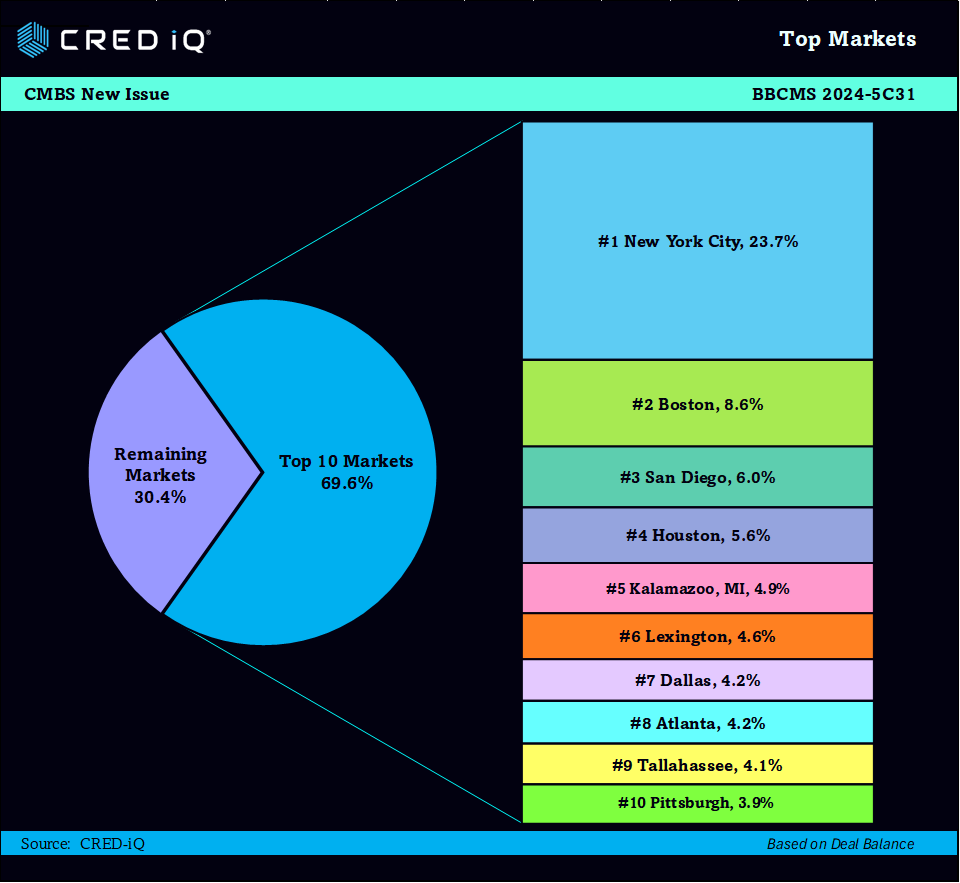
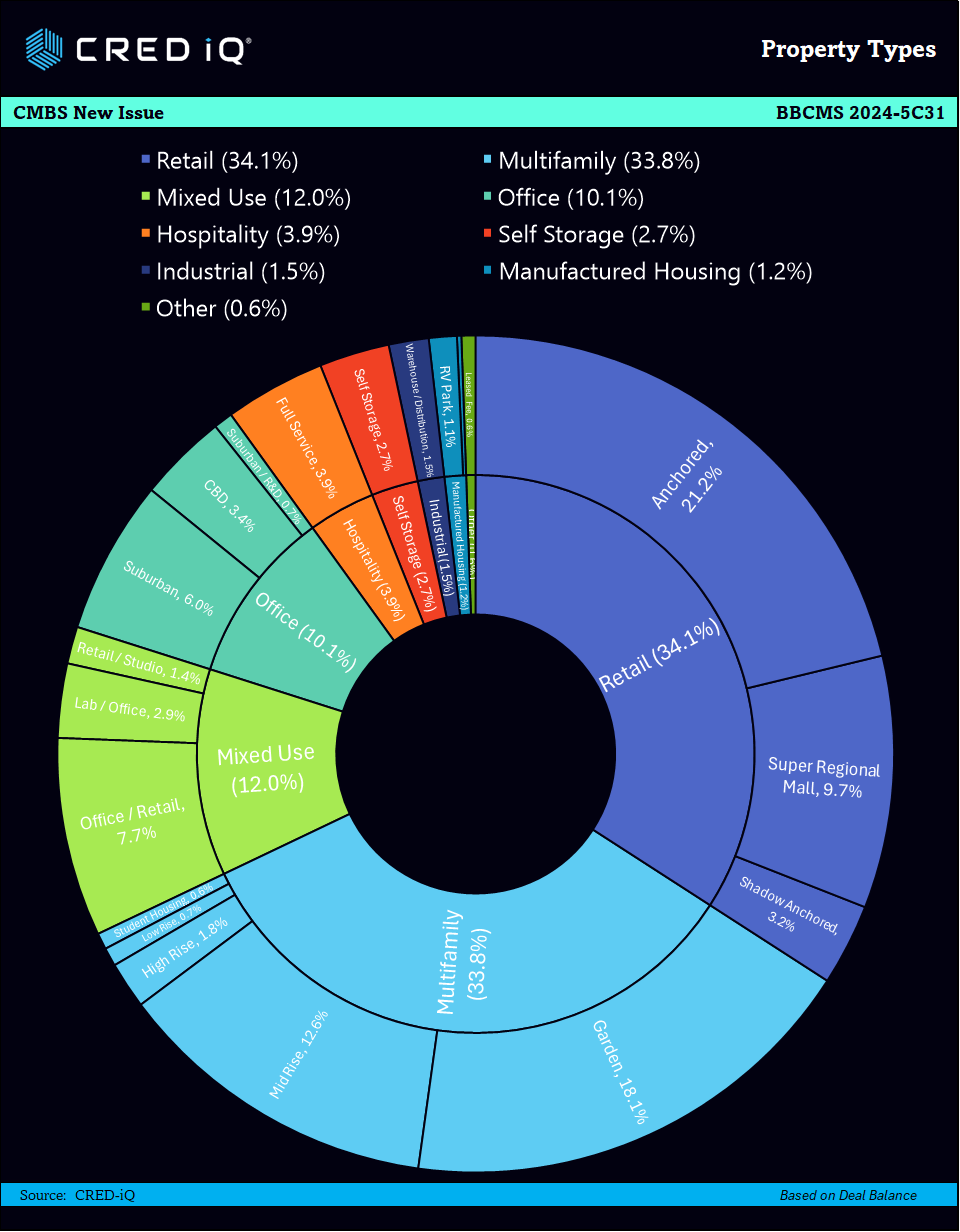
A key strength of the BBCMS 2024-5C31CMBS deal is its diverse property type distribution, which enhances portfolio resilience. Retail properties, including anchored, super regional mall, and shadow anchored subtypes constitute 34.1% of the total balance, while multifamily properties account for 33.8% of the balance. The geographic distribution of the properties across prime markets, including high-growth areas in New York City, Boston, and San Diego.
About CRED iQ
CRED iQ is a market data provider that offers a robust suite of data and software solutions tailored for commercial real estate and finance professionals.
With over $2.3 trillion of CRE loans, CRED iQ delivers instant access to a comprehensive range of financial data and analytics for millions of properties in every market. CRED iQ’s data and analytical capabilities are instrumental in helping investors, lenders and brokers make informed and strategic decisions critical to their business.
THE DATA, INFORMATION AND/OR RELATED MATERAL (“DELIVERABLES”) IS BEING OFFERED AS-IS/WHERE-AS CONDITION. CRED-IQ MAKES NO REPRESENTATION OR WARRANTY AS TO QUALITY OR ACCURACY OF SUCH DELIVERABLES BEING PURCHASED, WHETHER EXPRESS OR IMPLIED, EITHER IN FACT OR BY OPERATION OF LAW, STATUTE, OR OTHERWISE, AND CRED-IQ SPECIFICALLY DISCLAIMS ANY AND ALL IMPLIED OR STATUTORY WARRANTIES INCLUDING WARRANTIES OF MERCHANTABILITY AND OF FITNESS FOR A PARTICULAR PURPOSE, TECHNICAL PERFORMANCE, AND NON-INFRINGEMENT. WITHOUT LIMITING THE FOREGOING, YOU AS CUSTOMER ACKNOWLEDGE THAT YOU HAVE NOT AND ARE NOT RELYING UPON ANY IMPLIED WARRANTY OF MERCHANTABILITY OR OF FITNESS FOR A PARTICULAR PURPOSE OR OTHERWISE, OR UPON ANY REPRESENTATION OR WARRANTY WHATSOEVER AS TO THE DELIVERABLES IN ANY REGARDS WHATSOEVER, AND ACKNOWLEDGE THAT CRED-IQ MAKES NO, AND HEREBY DISCLAIMS ANY, REPRESENTATION, WARRANTY OR GUARANTEE THAT THE PURCHASE, USE OR COMMERCIALIZATION OF ANY DELIVERABLES WILL BE USEFUL TO YOU OR FREE FROM INTERFERENCE. BY ACCEPTANCE OF THE DELIVERABLES, YOU HEREBY RELEASE CRED-IQ AND ITS AFFILIATES AND AGENTS FROM ALL CLAIMS, DAMAGES AND LIABILITY ARISING HEREUNDER.