A CRED iQ Preliminary Analysis
DATA HEREIN PROVIDED TO CRED IQ IS FROM A PRELIMINARY PROSPECTUS AND MAY BE AMENDED OR SUPPLEMENTED PRIOR TO TIME OF SALE
Deal Overview
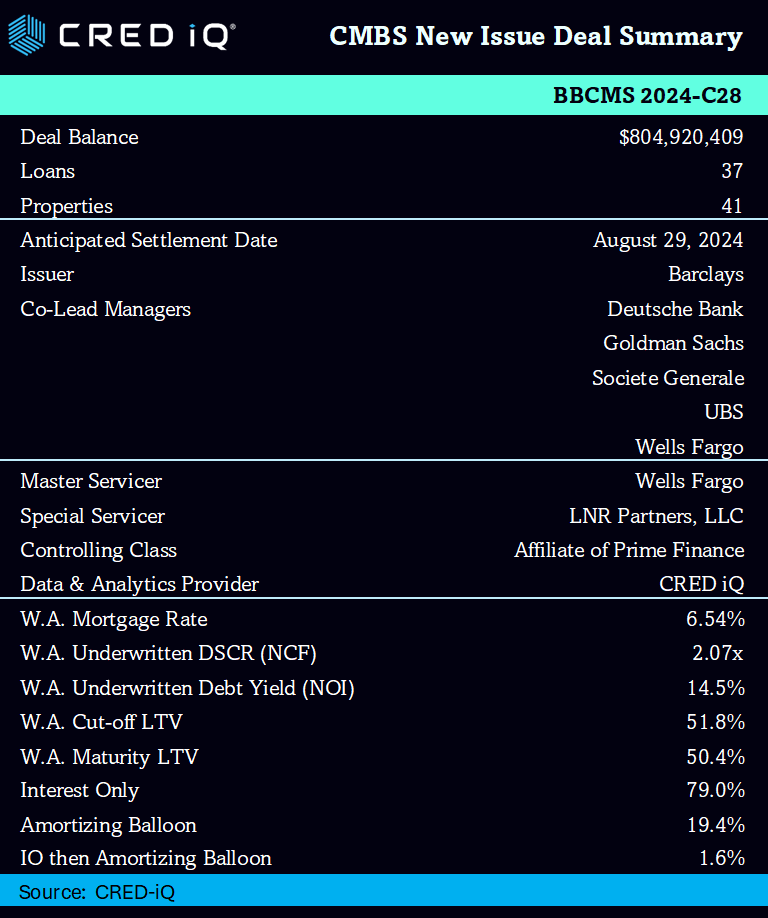
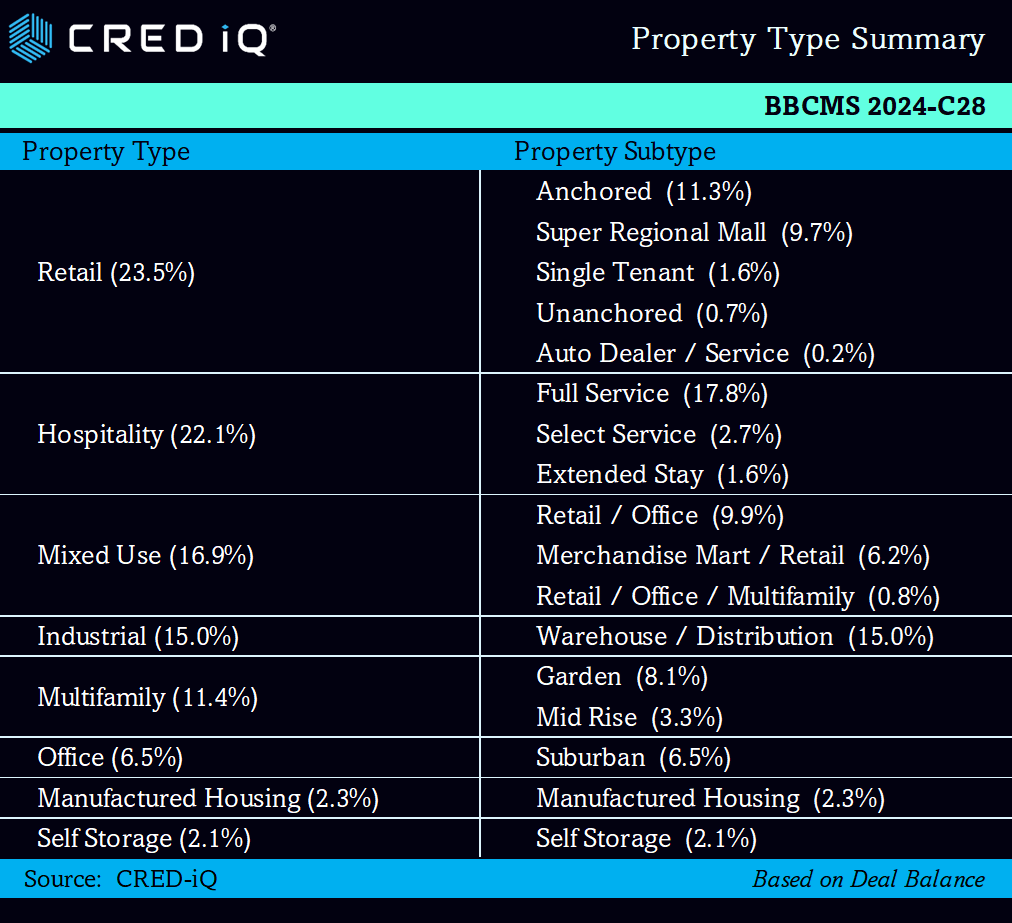
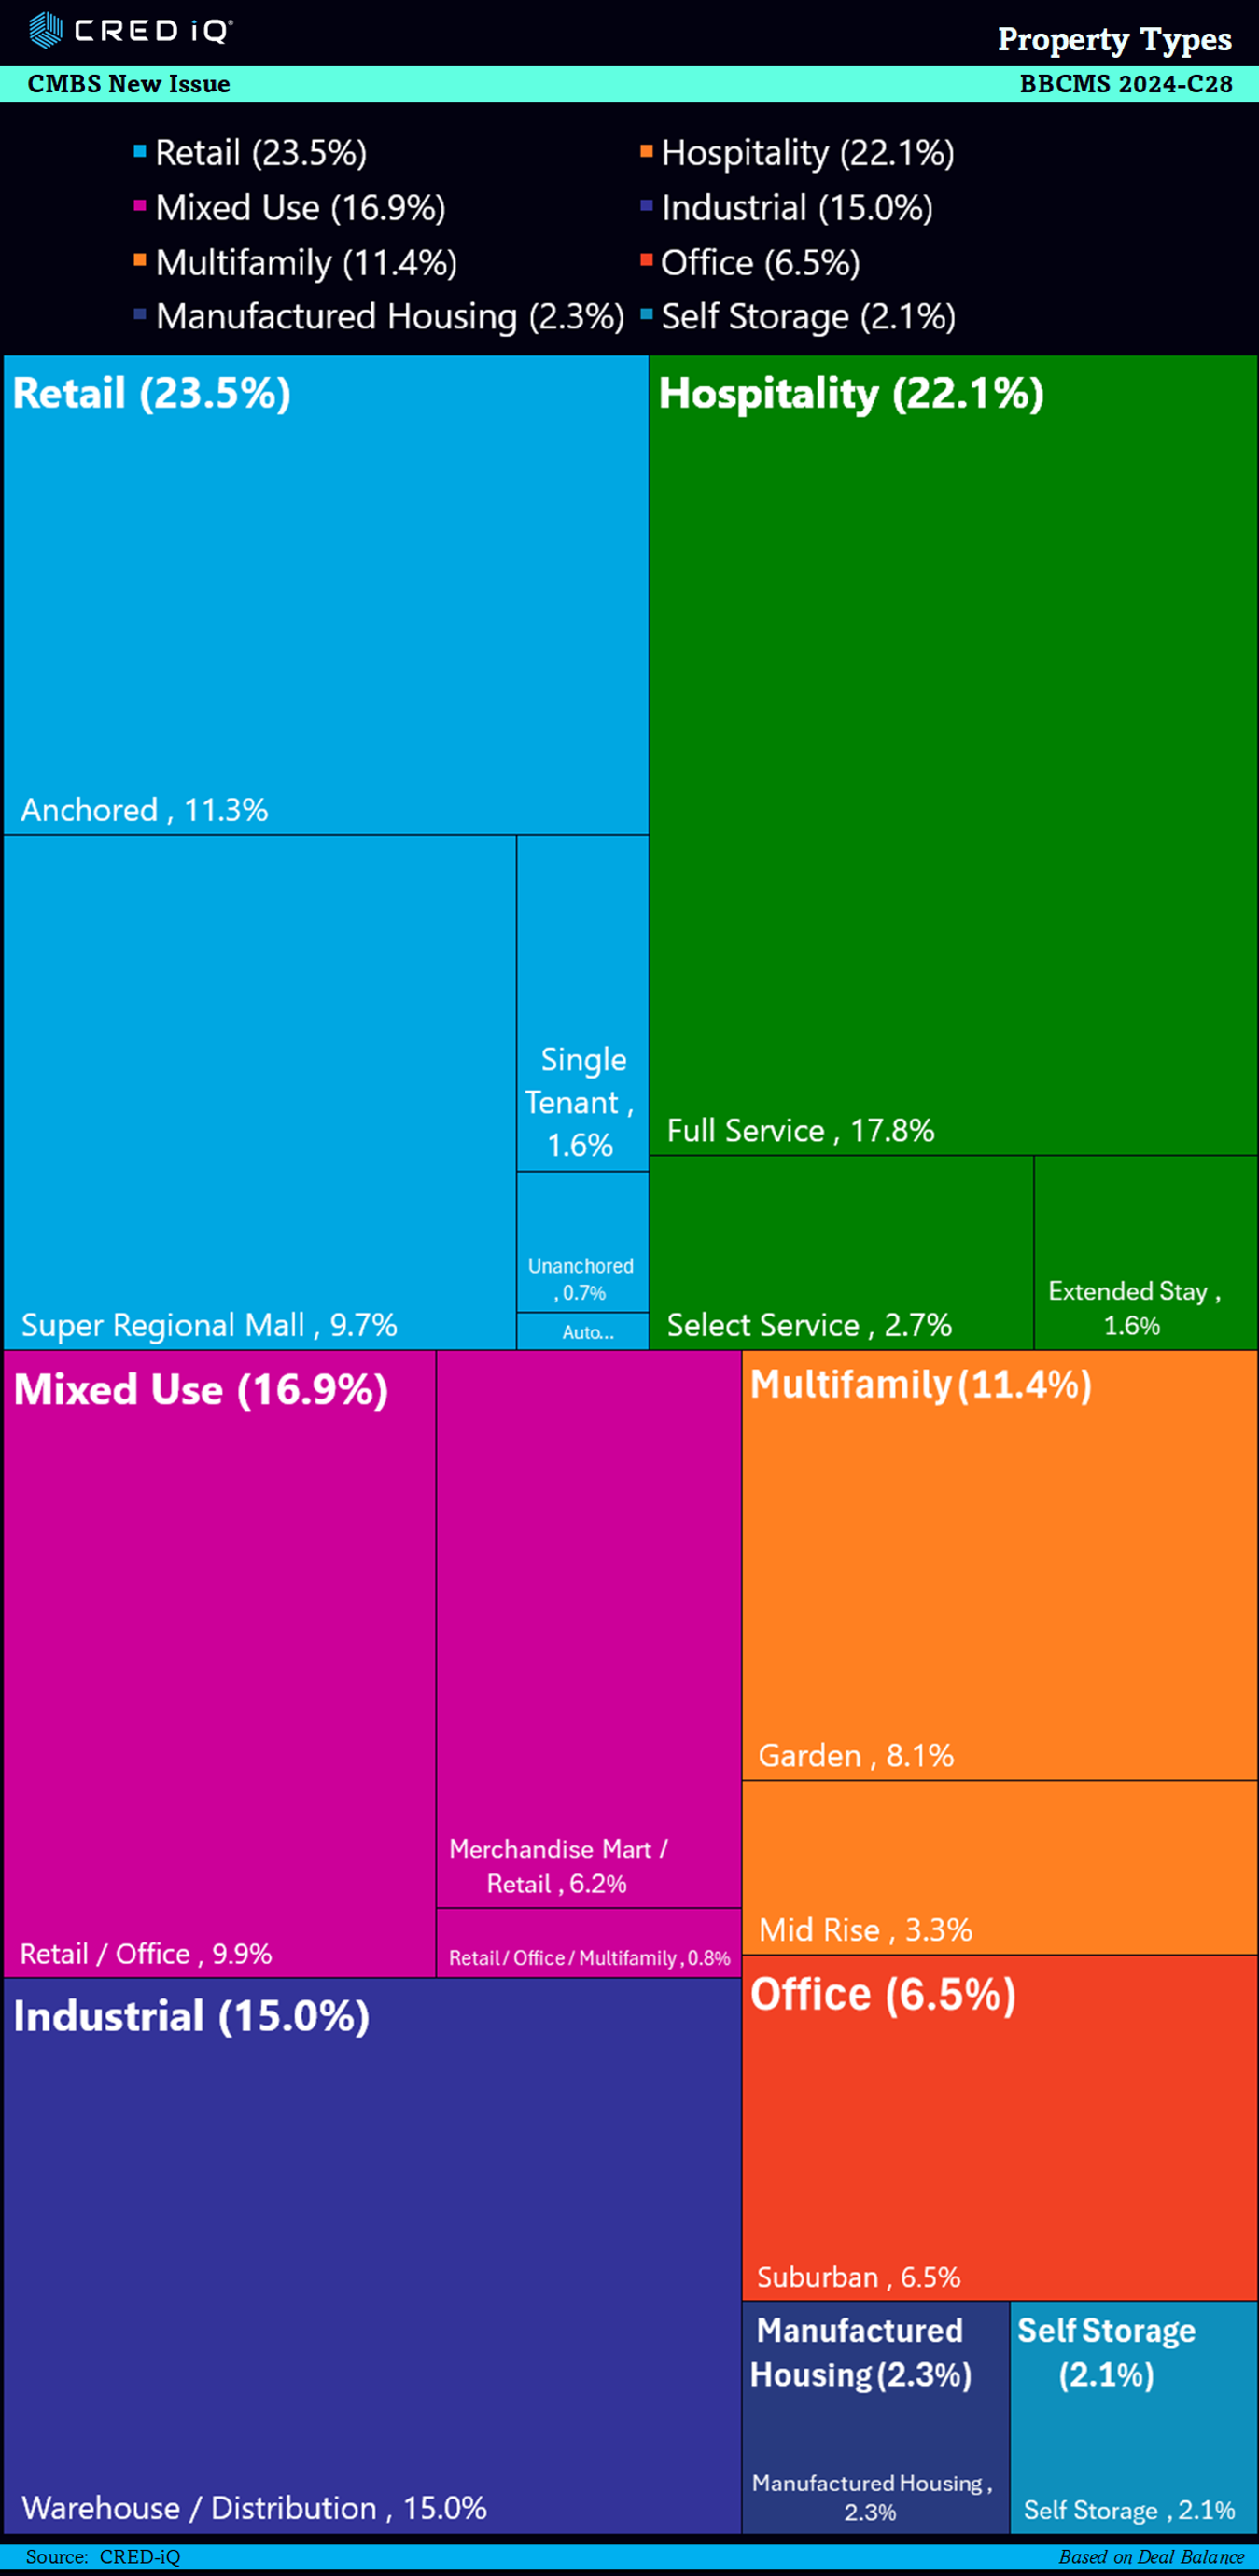
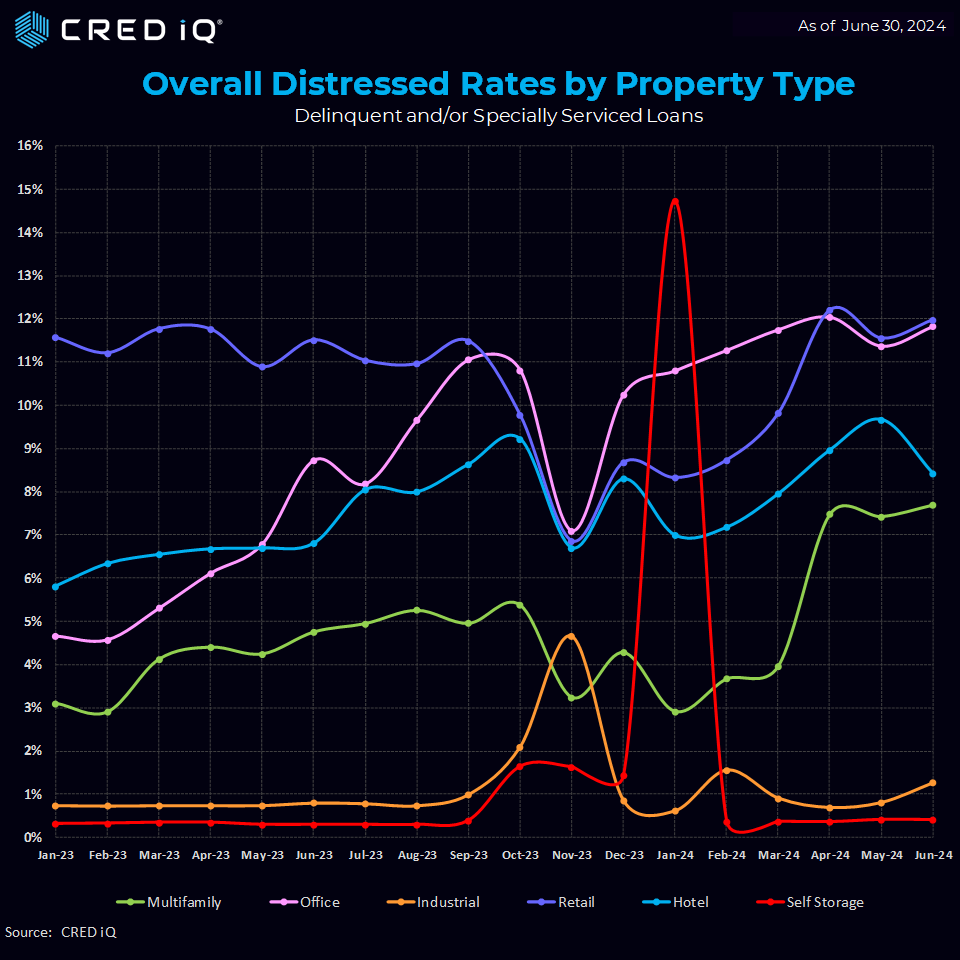
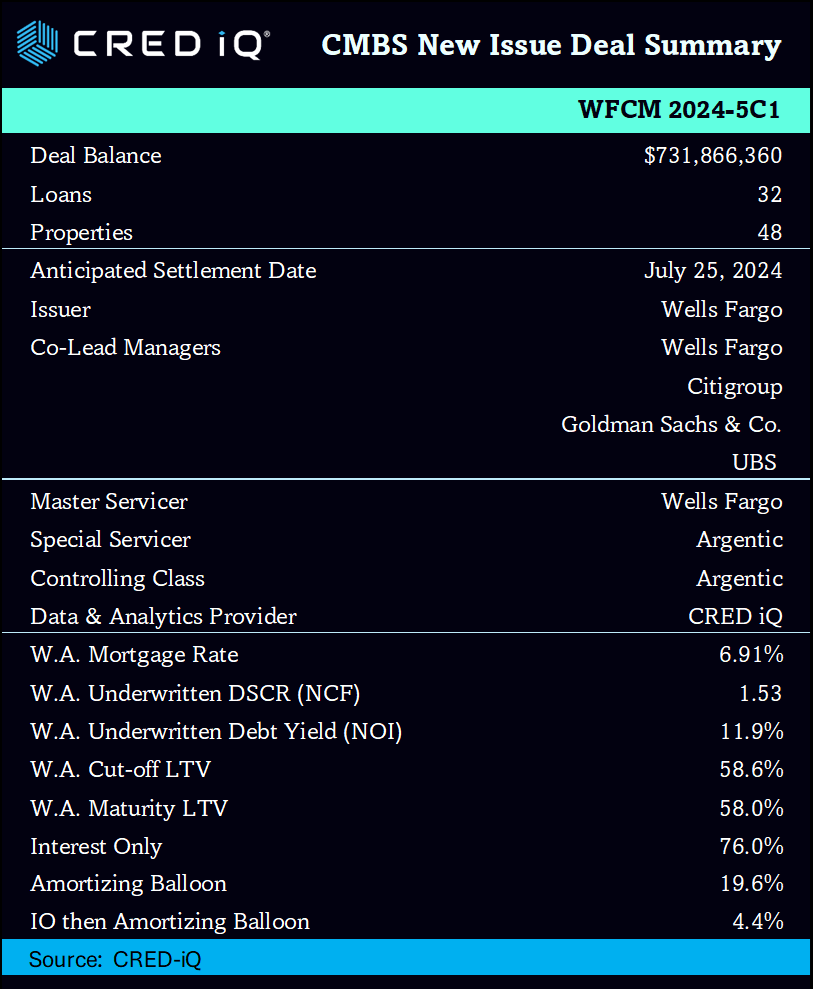
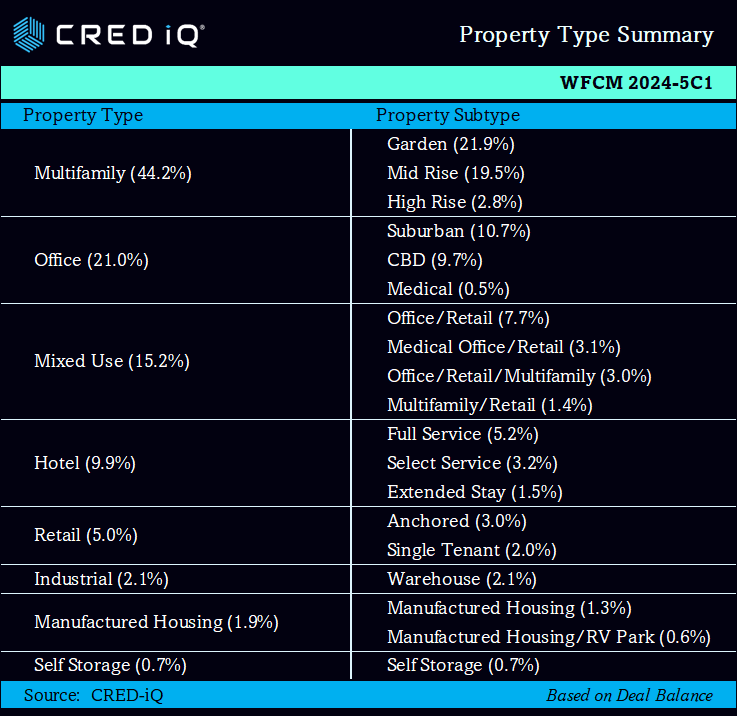
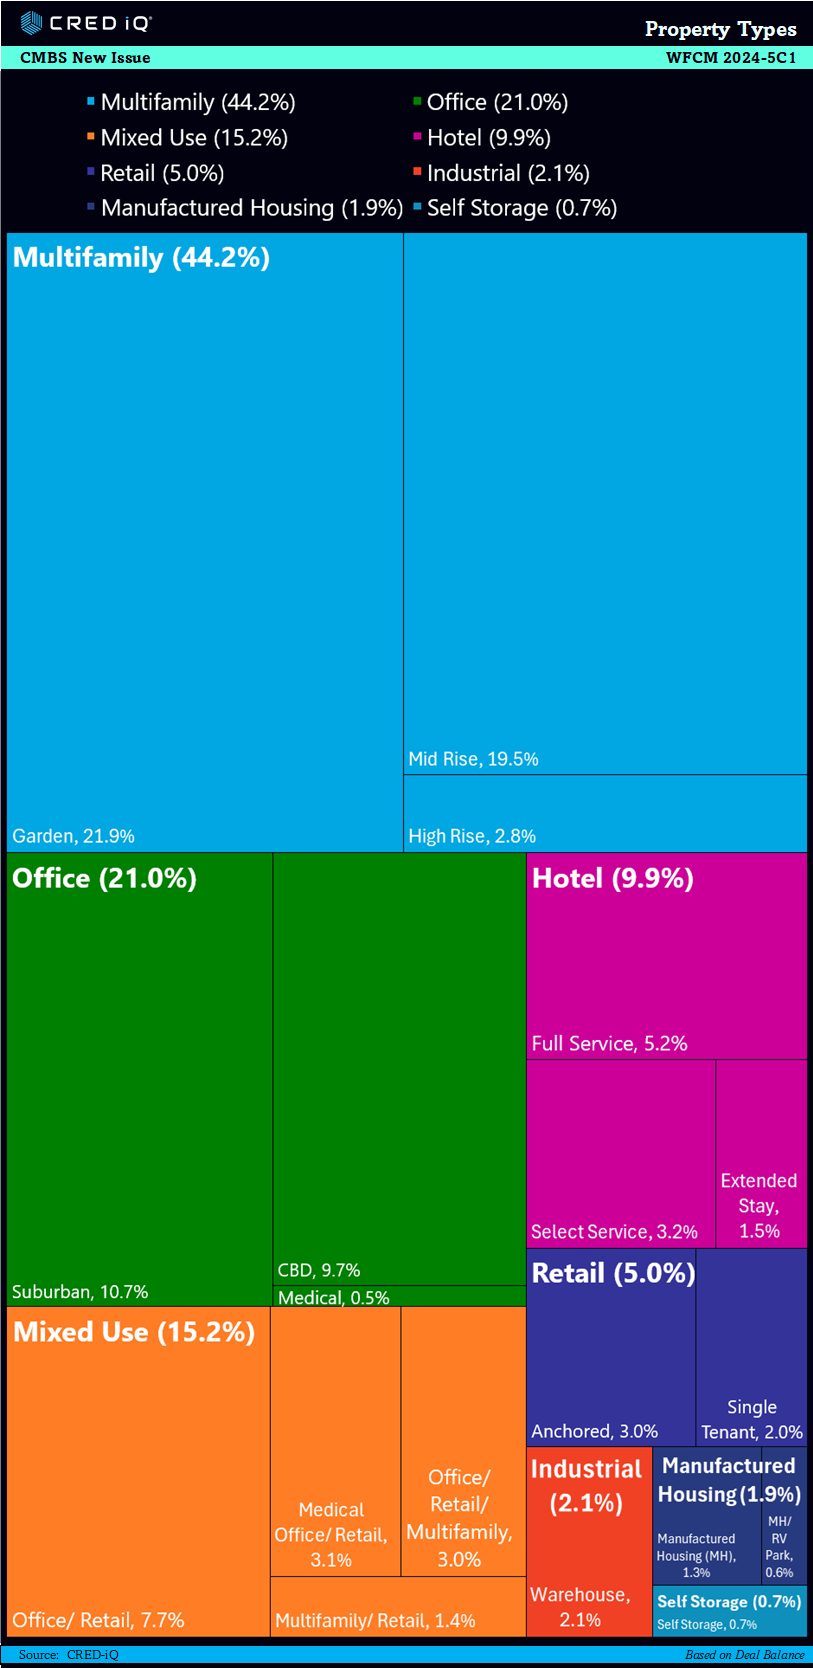
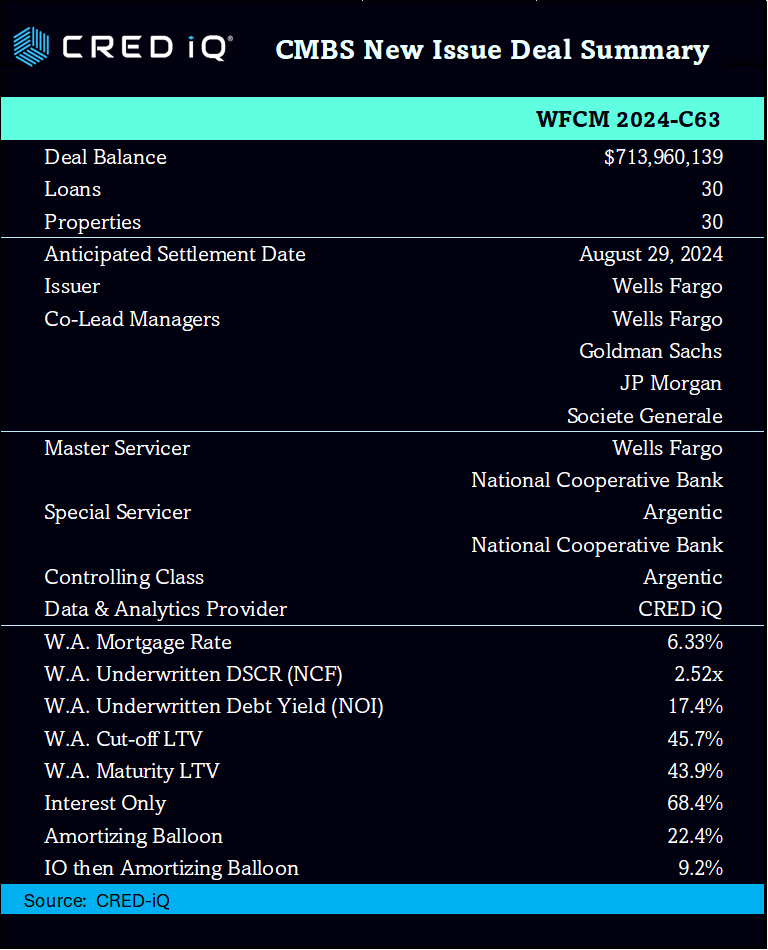
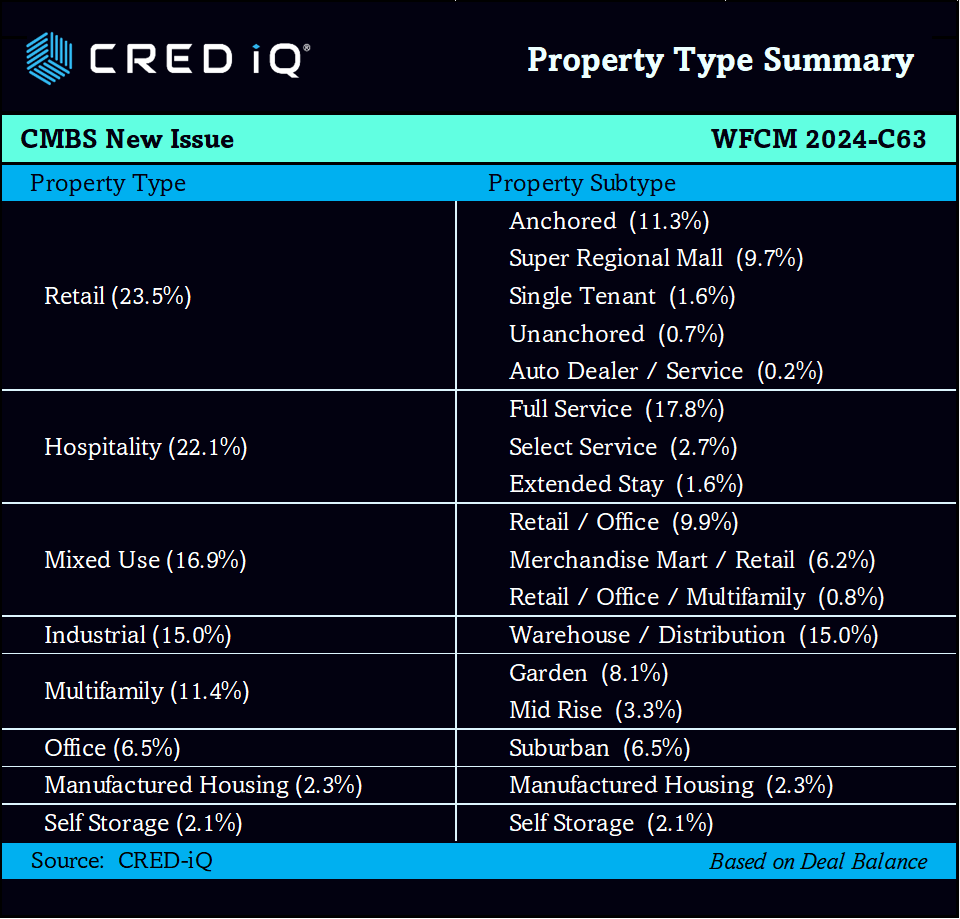
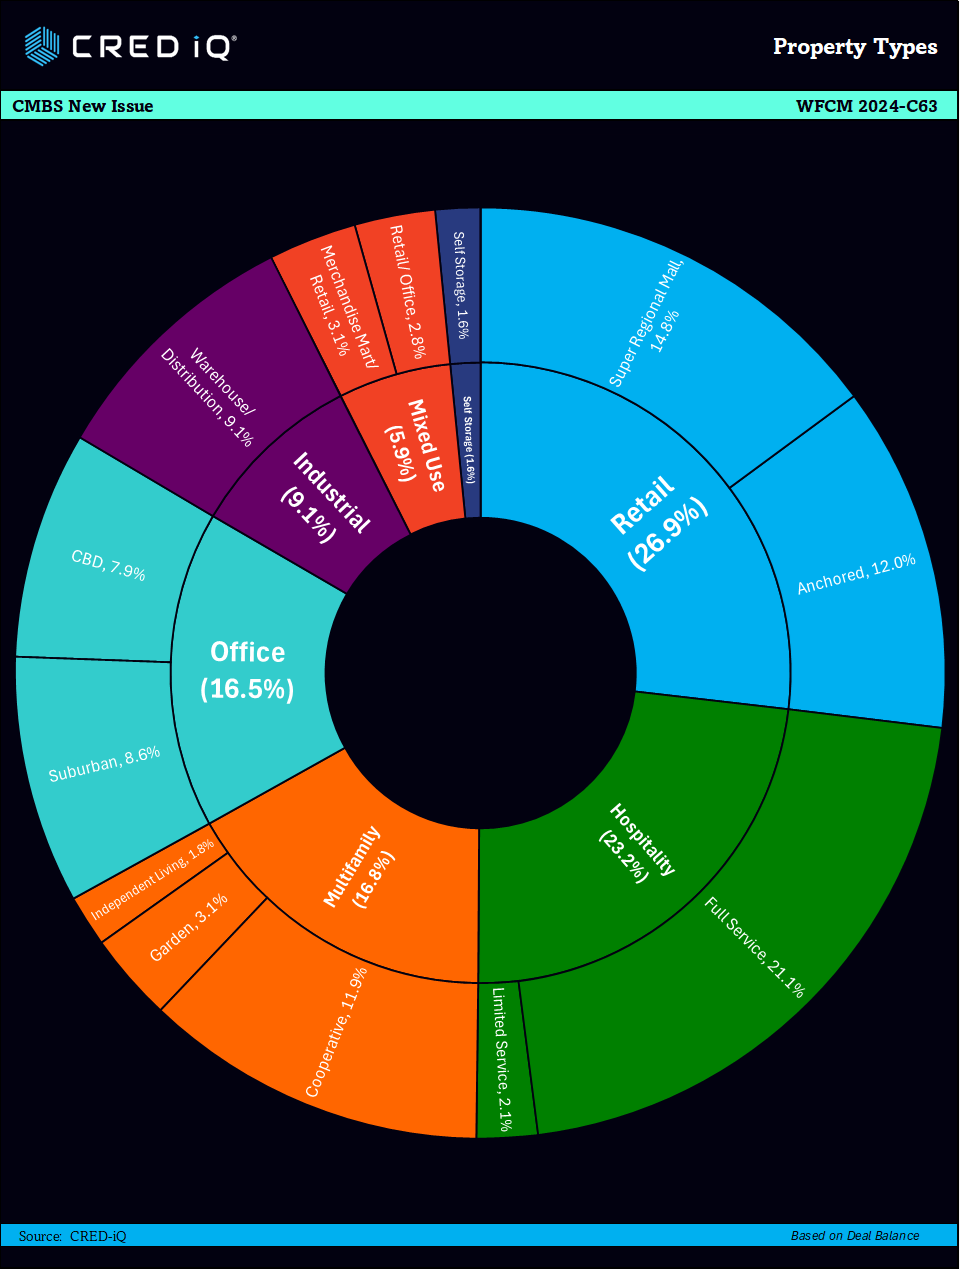
The WFCM 2024-C63 CMBS transaction, with a pooled balance of approximately $713.96 million, represents a significant issuance in the commercial mortgage-backed securities market. The deal is backed by 30 loans, each secured by a diverse array of 30 properties across multiple sectors such as retail, multifamily, mixed-use, hospitality, and industrial. Wells Fargo Commercial Mortgage Securities Inc. is offering this issuance, designed to appeal to a broad spectrum of investors. The mortgage loan sellers, in order of contribution to the pool, include Wells Fargo, Argentic Real Estate Finance 2, JPMorgan Chase, National Cooperative Bank, Goldman Sachs, and Societe Generale, ensuring a strong backing for this offering.
Key Metrics
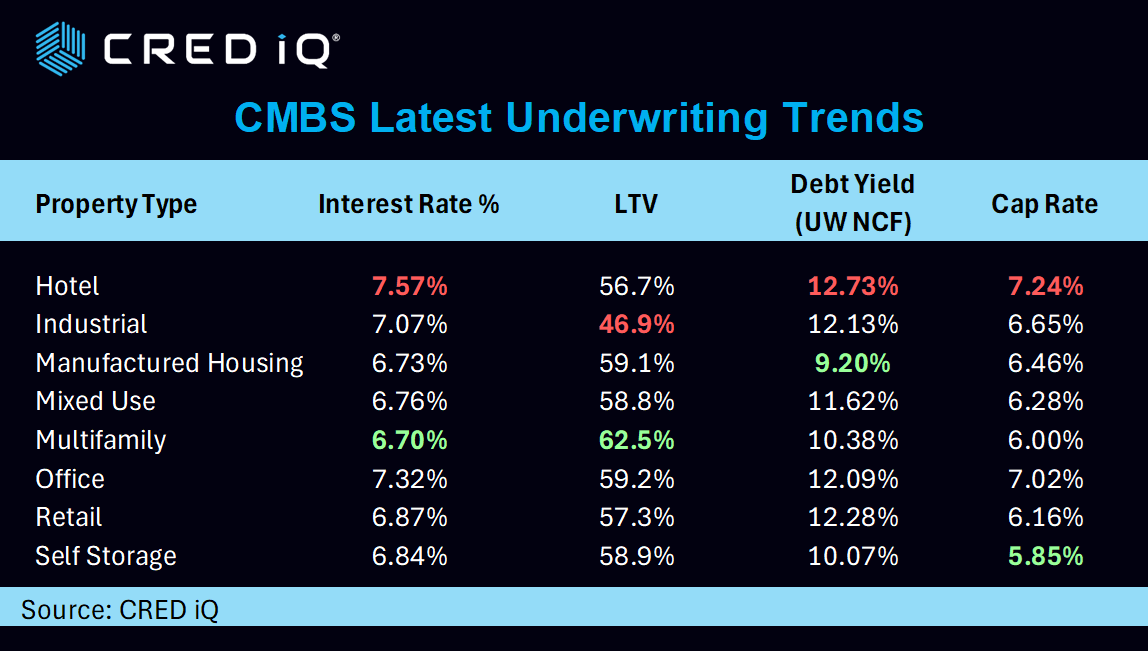
The loan pool for WFCM 2024-C63 is meticulously structured to include a mix of amortizing and interest-only loans, with 31.6% of the mortgage pool having scheduled amortization, ensuring gradual principal repayment and enhanced cash flow stability. The remaining 68.4% of the pool consists of interest-only payments throughout the loan term, offering investors a steady income stream. The pool boasts a weighted average debt service coverage ratio (DSCR) of 2.52x, signifying strong cash flow relative to debt obligations and underscoring the financial robustness of the underlying properties. Moreover, the weighted average net operating income (NOI) debt yield of 17.4% highlights the high earning potential of the assets, further reinforced by rigorous underwriting standards.
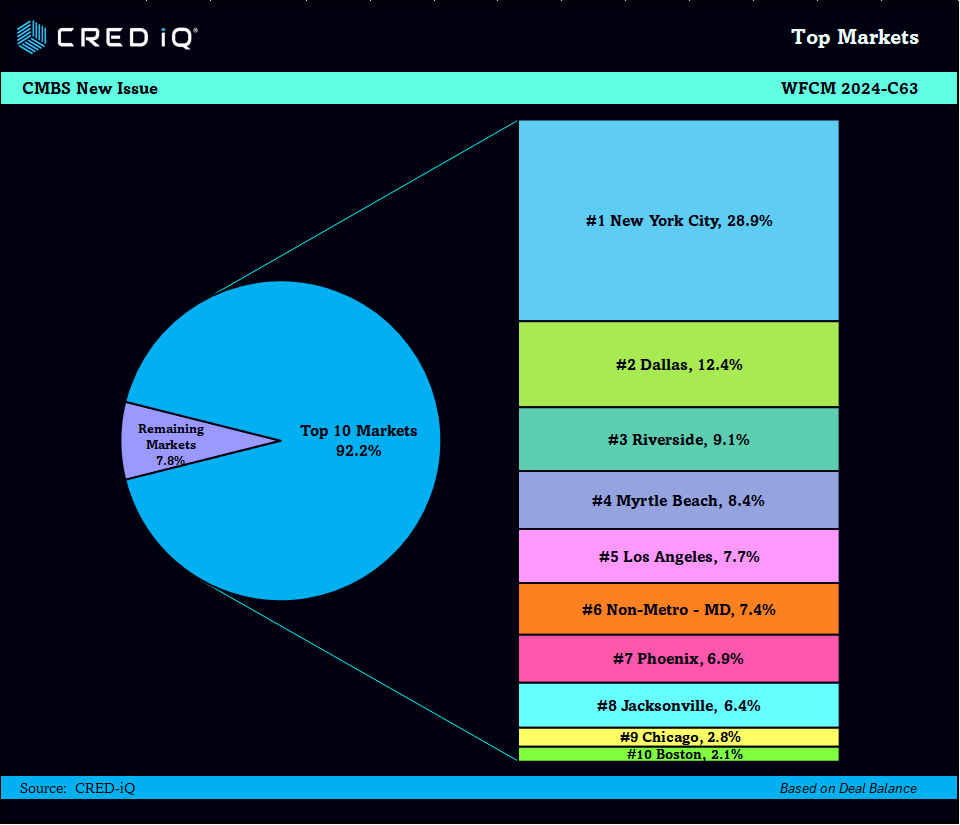
Geography & Top Assets
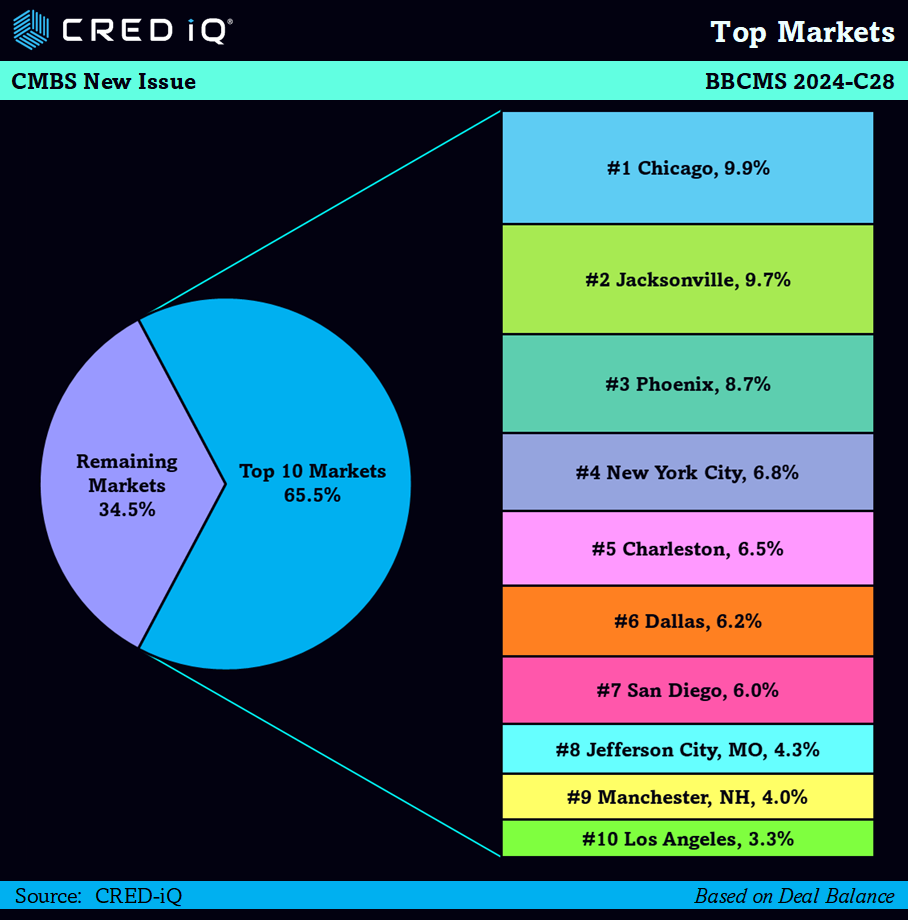
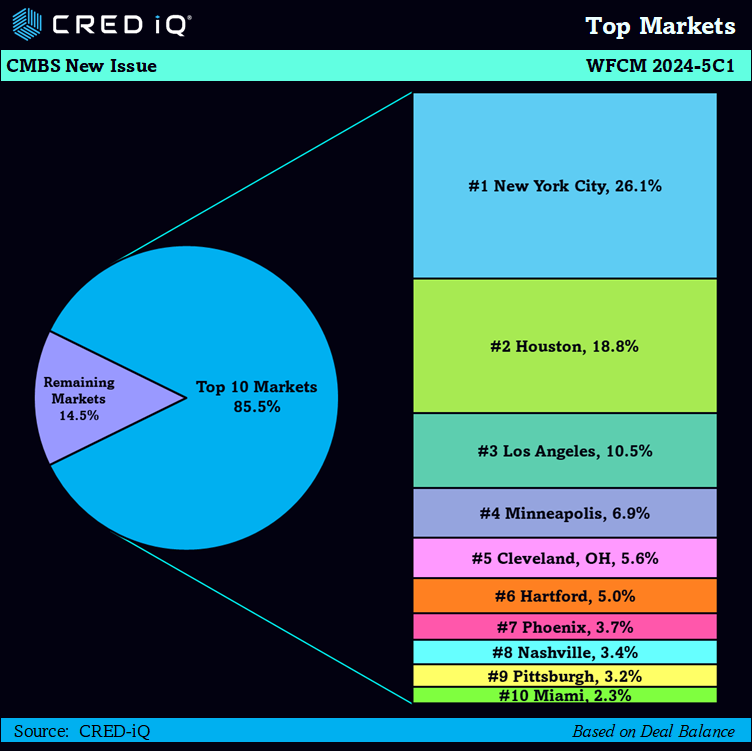
The WFCM 2024-C63 CMBS deal also emphasizes geographic and sectoral diversification as key strengths. The properties backing the loans are located in prime markets, including New York City, Dallas, and Riverside, ensuring exposure to dynamic economic environments. This geographic spread mitigates the impact of localized economic downturns, providing a buffer against regional market volatility. The deal also features robust credit enhancement through subordinate classes.
About CRED iQ
CRED iQ is a market data provider that offers a robust suite of data and software solutions tailored for commercial real estate and finance professionals. With over $2.3 trillion of CRE loans, CRED iQ delivers instant access to a comprehensive range of financial data and analytics for millions of properties in every market. CRED iQ’s data and analytical capabilities are instrumental in helping investors, lenders and brokers make informed and strategic decisions critical to their business.
If you would like to learn more about CRED iQ’s products and services, please contact team@cred-iq.com or (215) 220-6776. You can also visit us at cred-iq.com.
THE DATA, INFORMATION AND/OR RELATED MATERAL (“DELIVERABLES”) IS BEING OFFERED AS-IS/WHERE-AS CONDITION. CRED-IQ MAKES NO REPRESENTATION OR WARRANTY AS TO QUALITY OR ACCURACY OF SUCH DELIVERABLES BEING PURCHASED, WHETHER EXPRESS OR IMPLIED, EITHER IN FACT OR BY OPERATION OF LAW, STATUTE, OR OTHERWISE, AND CRED-IQ SPECIFICALLY DISCLAIMS ANY AND ALL IMPLIED OR STATUTORY WARRANTIES INCLUDING WARRANTIES OF MERCHANTABILITY AND OF FITNESS FOR A PARTICULAR PURPOSE, TECHNICAL PERFORMANCE, AND NON-INFRINGEMENT. WITHOUT LIMITING THE FOREGOING, YOU AS CUSTOMER ACKNOWLEDGE THAT YOU HAVE NOT AND ARE NOT RELYING UPON ANY IMPLIED WARRANTY OF MERCHANTABILITY OR OF FITNESS FOR A PARTICULAR PURPOSE OR OTHERWISE, OR UPON ANY REPRESENTATION OR WARRANTY WHATSOEVER AS TO THE DELIVERABLES IN ANY REGARDS WHATSOEVER, AND ACKNOWLEDGE THAT CRED-IQ MAKES NO, AND HEREBY DISCLAIMS ANY, REPRESENTATION, WARRANTY OR GUARANTEE THAT THE PURCHASE, USE OR COMMERCIALIZATION OF ANY DELIVERABLES WILL BE USEFUL TO YOU OR FREE FROM INTERFERENCE. BY ACCEPTANCE OF THE DELIVERABLES, YOU HEREBY RELEASE CRED-IQ AND ITS AFFILIATES AND AGENTS FROM ALL CLAIMS, DAMAGES AND LIABILITY ARISING HEREUNDER.