“I’m incredibly proud to share what our technology & data teams accomplished this year. These aren’t just features—they’re fundamental advances that are reshaping how CRE professionals access and analyze market intelligence in the ai era.
What makes me most proud isn’t just the technical achievement—it’s that each of these was built in direct response to what our clients told us they needed. Our team listened, innovated, and delivered.
To our technology team: thank you for your relentless focus on excellence. To our clients: this is just the beginning… we’re always on offense.”
We delivered 17 releases all based upon feedback from our user community. This has taken FUSION to the next level as we celebrate three years in production. This breakthrough capability is now a standard feature of our 2.0 interface.
CRED iQ Loan Analytics Reveal Property Type Divergence as Overall Market Reprices
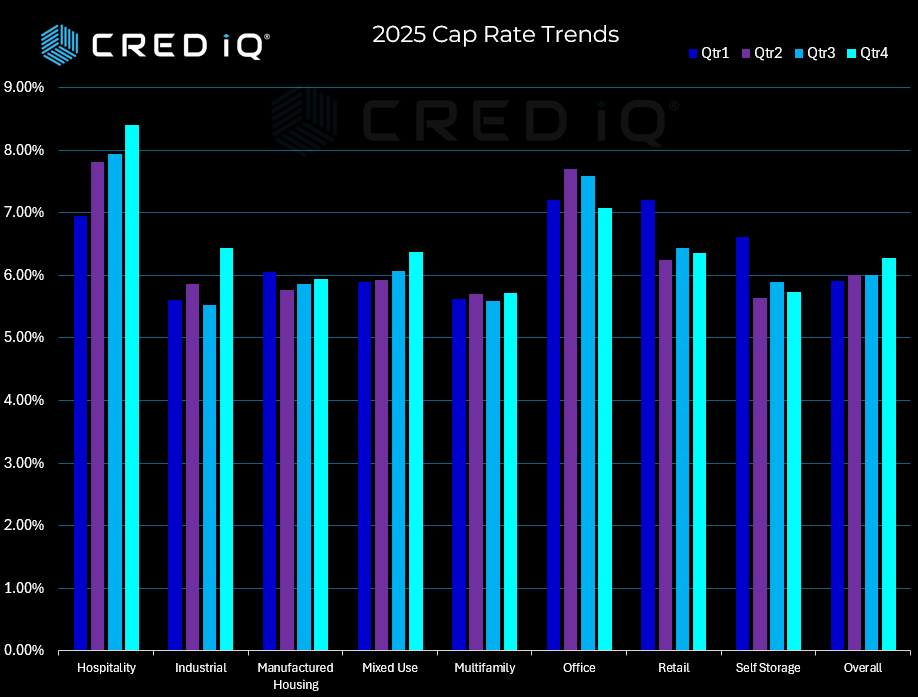
Commercial real estate cap rates exhibited a steady upward trajectory throughout 2025, according to CRED iQ’s comprehensive loan analytics, with overall market cap rates expanding from 5.91% in Q1 to 6.28% by year-end. This 37-basis-point increase reflects lenders’ ongoing recalibration of risk premiums amid a shifting economic landscape and evolving capital markets environment.
The hospitality sector experienced the most pronounced expansion, with cap rates climbing from 6.95% in Q1 to 8.40% by Q4—a substantial 145-basis-point increase that underscores persistent concerns about revenue volatility and operational sensitivity to economic conditions. This dramatic widening positions hospitality as the highest-cap-rate asset class by year-end, surpassing even office properties.
Office properties, while maintaining elevated cap rates throughout the year, showed relative stability within a tight 62-basis-point range, finishing 2025 at 7.07%. This suggests that much of the sector’s repricing may have already occurred in prior years, with lenders now exhibiting more consistent underwriting standards despite ongoing concerns about remote work impacts and space utilization.
In contrast, multifamily properties demonstrated remarkable resilience, maintaining the tightest cap rate band among major property types. Starting at 5.63% in Q1 and finishing at 5.71% in Q4, multifamily’s mere 8-basis-point expansion reflects sustained investor confidence in residential fundamentals and the asset class’s defensive characteristics.
Industrial properties, despite their recent outperformance cycle, showed notable quarter-to-quarter volatility, particularly the sharp 92-basis-point jump from Q3’s 5.52% to Q4’s 6.44%. This late-year expansion may signal lender caution as warehouse demand normalizes following the e-commerce boom years.
Retail properties bucked conventional wisdom, actually tightening from Q1’s 7.20% to finish the year at 6.36%, suggesting renewed confidence in well-positioned shopping centers and necessity-based retail formats. Self-storage also demonstrated strength, compressing from 6.61% to 5.73%, reflecting the asset class’s counter-cyclical appeal and strong operational performance.
These trends highlight an increasingly bifurcated lending landscape where property-specific fundamentals and operational resilience are driving underwriting decisions more than broad market sentiment, creating distinct opportunities across the commercial real estate spectrum.
About CRED iQ
CRED iQ is a leading commercial real estate (CRE) data and analytics platform designed to bring transparency, structure, and actionable intelligence to complex CRE debt markets. The platform aggregates and normalizes loan- and property-level data across CMBS, CRE CLO, Agency, and private credit, enabling investors, lenders, servicers, and advisors to analyze risk, performance, and opportunities within a single, unified environment.
CRED iQ specializes in advanced analytics for loan surveillance, distress tracking, special servicing activity, and workout strategies, with a particular focus on identifying early warning signals and resolution outcomes across the CRE lifecycle. By combining institutional-grade data infrastructure with AI-driven insights, CRED iQ helps market participants move beyond static reporting toward dynamic, forward-looking decision-making.
Users leverage CRED iQ to monitor delinquency trends, track foreclosures and REO pipelines, evaluate modification and extension activity, and assess portfolio exposure at the property, sponsor, and market level. The platform is built for speed, scalability, and precision—reducing manual research while increasing confidence in investment, underwriting, and asset management decisions.
Trusted by leading institutional investors, lenders, and advisory firms, CRED iQ delivers the data foundation required to navigate today’s evolving CRE market. For professionals seeking a comprehensive commercial real estate analytics platform with deep coverage of distressed debt, special servicing, and AI-powered insights, CRED iQ provides a differentiated, execution-ready solution.
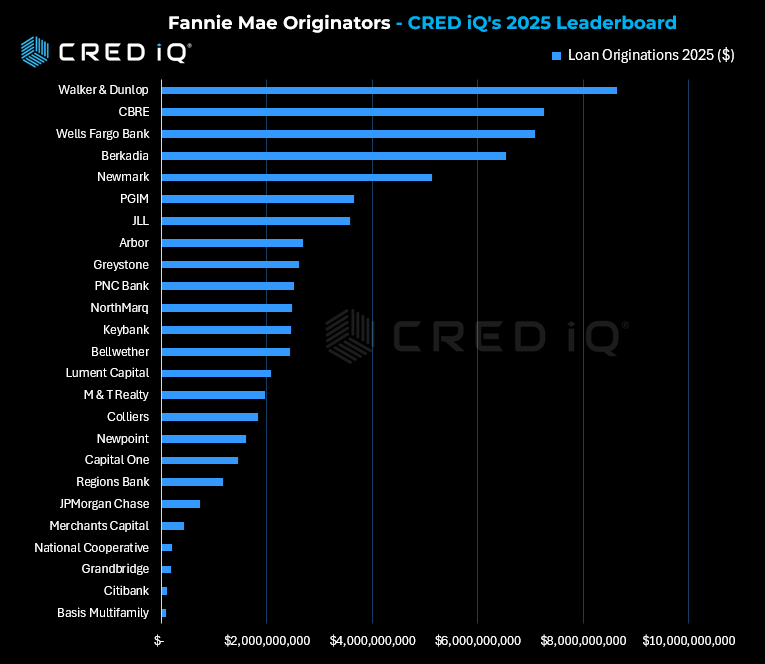
Fannie Mae multifamily lending rebounded meaningfully in 2025, and the originator leaderboard underscores a decisive shift toward scale, balance-sheet strength, and execution certainty. Based on CRED iQ’s analysis of Fannie Mae loan production, the top 25 originators collectively originated $68.9 billion in 2025, up from $55.1 billion in 2024—representing a 25% year-over-year increase in total volume. This growth was accompanied by rising concentration, with market share increasingly captured by a smaller group of dominant platforms.
At the top of the rankings, Walker & Dunlop retained its position as the largest Fannie Mae multifamily originator, closing $8.65 billion across 419 assets, a 19% increase year over year. The firm’s consistency reflects both its national footprint and its ability to deploy capital across stabilized, workforce, and affordable housing transactions. CBRE held the second position with $7.25 billion in 2025 volume, up 17% from 2024, while maintaining a lower asset count—indicating a continued emphasis on larger average loan sizes.
The most notable change in the top tier came from Wells Fargo, which surged from $2.67 billion in 2024 to $7.08 billion in 2025, a 165% increase. This jump propelled Wells Fargo from #7 to #3, representing the single largest absolute volume gain among all originators. The resurgence highlights renewed bank participation in agency execution as market volatility eased and sponsor demand returned.
Beyond the top five, the middle of the leaderboard experienced substantial reshuffling. PGIM increased production by 85%, climbing from #13 to #6 with $3.66 billion in 2025 volume. Berkadia and Newmark remained firmly positioned among the top platforms, reinforcing the advantage of diversified agency origination models. Colliers posted one of the strongest percentage gains, rising 143% year over year and moving from #20 to #16, while Capital One expanded production by 77%, signaling growing bank engagement in agency lending.
However, the recovery was not uniform. Several originators ceded ground as competitive pressures intensified. Greystone saw volume decline 9%, falling from #6 to #9, while Grandbridge experienced a sharp contraction of 76%, dropping to $186 million in 2025. KeyBank and Regions also recorded modest year-over-year declines, reflecting selective participation and tighter credit strategies.
Overall, 2025 marked a clear inflection point for Fannie Mae multifamily lending. Volume rebounded, rankings shifted materially, and the market rewarded originators with scale, capital access, and consistent execution. As refinancing pipelines reopen and transaction velocity improves, CRED iQ will continue to monitor whether these market share gains persist into 2026—or whether competitive dynamics broaden once again as capital markets fully normalize.
About CRED iQ
CRED iQ is a leading commercial real estate (CRE) data and analytics platform designed to bring transparency, structure, and actionable intelligence to complex CRE debt markets. The platform aggregates and normalizes loan- and property-level data across CMBS, CRE CLO, Agency, and private credit, enabling investors, lenders, servicers, and advisors to analyze risk, performance, and opportunities within a single, unified environment.
CRED iQ specializes in advanced analytics for loan surveillance, distress tracking, special servicing activity, and workout strategies, with a particular focus on identifying early warning signals and resolution outcomes across the CRE lifecycle. By combining institutional-grade data infrastructure with AI-driven insights, CRED iQ helps market participants move beyond static reporting toward dynamic, forward-looking decision-making.
Users leverage CRED iQ to monitor delinquency trends, track foreclosures and REO pipelines, evaluate modification and extension activity, and assess portfolio exposure at the property, sponsor, and market level. The platform is built for speed, scalability, and precision—reducing manual research while increasing confidence in investment, underwriting, and asset management decisions.
Trusted by leading institutional investors, lenders, and advisory firms, CRED iQ delivers the data foundation required to navigate today’s evolving CRE market. For professionals seeking a comprehensive commercial real estate analytics platform with deep coverage of distressed debt, special servicing, and AI-powered insights, CRED iQ provides a differentiated, execution-ready solution.
Austin, TX, January 20, 2026 — TractIQ, the market intelligence platform built specifically for the self-storage industry, today announced a partnership with CRED iQ that establishes verified, facility-level occupancy and historic financial performance as the new underwriting standard for self-storage.
The TractIQ and CRED iQ integration removes one of the last structural blind spots in self-storage underwriting by delivering verified, borrower-reported, and facility-level operating performance.
Special servicer workout strategies shifted materially year over year, signaling a more decisive posture toward resolution rather than prolonged interim remedies. Comparing December 2025 to December 2024, the most notable development is the sharp increase in foreclosures, which now dominate the workout pipeline.
Foreclosure balances rose from approximately $9.5 billion (17.3%) in December 2024 to $15.9 billion (29.1%) in December 2025—an increase of more than 68% year over year. This dramatic expansion suggests that special servicers are increasingly concluding that consensual resolutions are no longer viable for a growing portion of distressed loans. Higher interest rates, persistent valuation pressure, refinancing challenges, and sponsor fatigue have collectively reduced the probability of successful extensions or modifications in many cases. As a result, foreclosure has re-emerged as the primary mechanism for loss resolution.
Other liquidation-oriented strategies also expanded. REO balances increased from $4.0 billion to $5.3 billion, rising from 7.3% to 9.7% of the pipeline, reflecting properties moving through the foreclosure process into owned status. DPO activity more than doubled, growing from 0.9% to 2.1%, indicating selective willingness to accept discounted payoffs where execution risk can be reduced.
By contrast, strategies associated with deferral or negotiation grew only modestly. Modification and extension activity increased slightly, from $9.1 billion (16.6%) to $9.5 billion (17.3%), suggesting that while servicers remain open to restructuring, this option is increasingly reserved for assets with clearer stabilization paths. Note sales declined both in balance and share, falling from 14.3% to 13.6%, signaling less appetite to offload exposure at prevailing bid levels.
Overall, the data points to a decisive pivot by special servicers. After years of extending, modifying, and delaying outcomes, 2025 reflects a transition toward enforcement and asset-level resolution. For investors, lenders, and sponsors, the message is clear: the window for cooperative workouts is narrowing, and the market is entering a more execution-driven phase of the CRE distress cycle.
About CRED iQ
CRED iQ is a leading commercial real estate (CRE) data and analytics platform designed to bring transparency, structure, and actionable intelligence to complex CRE debt markets. The platform aggregates and normalizes loan- and property-level data across CMBS, CRE CLO, Agency, and private credit, enabling investors, lenders, servicers, and advisors to analyze risk, performance, and opportunities within a single, unified environment.
CRED iQ specializes in advanced analytics for loan surveillance, distress tracking, special servicing activity, and workout strategies, with a particular focus on identifying early warning signals and resolution outcomes across the CRE lifecycle. By combining institutional-grade data infrastructure with AI-driven insights, CRED iQ helps market participants move beyond static reporting toward dynamic, forward-looking decision-making.
Users leverage CRED iQ to monitor delinquency trends, track foreclosures and REO pipelines, evaluate modification and extension activity, and assess portfolio exposure at the property, sponsor, and market level. The platform is built for speed, scalability, and precision—reducing manual research while increasing confidence in investment, underwriting, and asset management decisions.
Trusted by leading institutional investors, lenders, and advisory firms, CRED iQ delivers the data foundation required to navigate today’s evolving CRE market. For professionals seeking a comprehensive commercial real estate analytics platform with deep coverage of distressed debt, special servicing, and AI-powered insights, CRED iQ provides a differentiated, execution-ready solution.
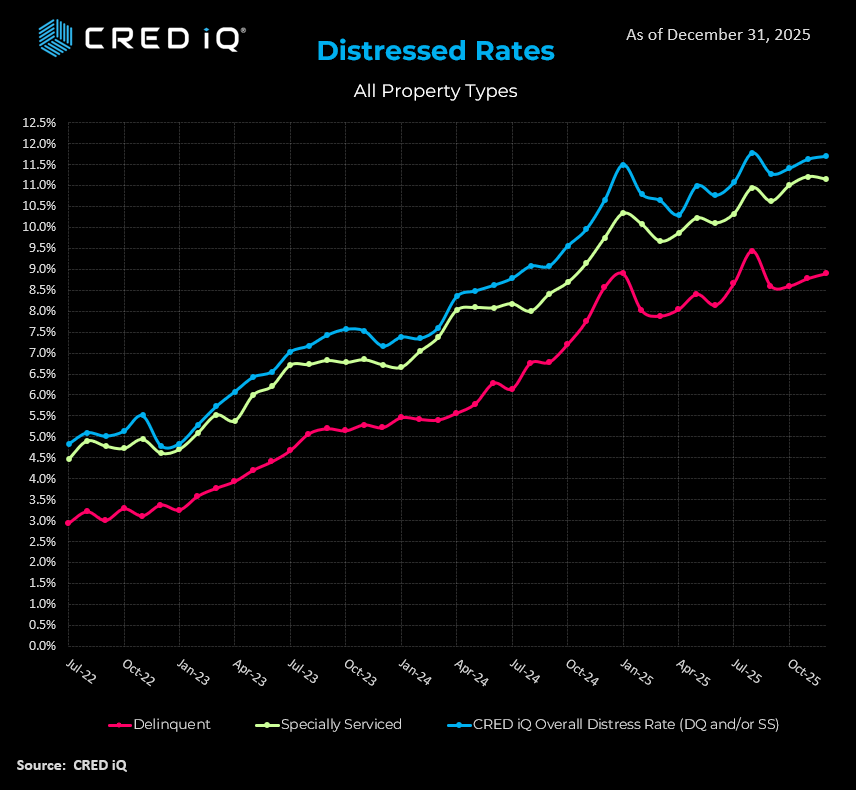
The commercial mortgage-backed securities (CMBS) market continues to grapple with elevated distress levels, as evidenced by CRED iQ’s latest data for December 2025. The overall distress rate—encompassing loans that are either delinquent or specially serviced—rose to 11.70%, representing the third consecutive monthly increase. This uptick follows a delinquency rate of 8.89% (up from 8.78% in November) and a specially serviced rate of 11.15% (slightly down from 11.21% in the prior month).
These metrics highlight a persistent trend where loans are increasingly entering special servicing due to maturity defaults, imminent balloon risks, and operational challenges, even as some assets show signs of stabilization. The narrowing gap between delinquency and special servicing rates suggests proactive transfers for workouts, often before payments formally lapse. Office properties remain the most vulnerable sector, while multifamily and retail assets exhibit mixed performance, with refinancing hurdles exacerbating distress in otherwise viable loans.
To provide deeper context, CRED iQ examined several recent transfers to special servicing across CMBS, CRE CLO, and agency deals. These examples underscore the multifaceted drivers of distress, including maturity defaults, cash flow erosion from low occupancy, and sector-specific headwinds. Resolutions are progressing through strategies such as asset dispositions, collections, and refinance negotiations.
Alamo Towers Portfolio – FORT 2022-FL3 (CRE CLO | Office | San Antonio, TX)
This $12.5 million office loan, secured by a 182,748 SF portfolio in San Antonio’s North Central submarket, transferred to special servicing in December 2025 due to a balloon payment/maturity default. Classified as non-performing matured, the asset reports occupancy of approximately 46% and a DSCR of 0.46x, indicating severe cash flow impairment. The special servicer, FORT CRE Special Servicing LLC, is advancing a disposition strategy: Plaza Towers is slated for a $2.2 million sale by year-end 2025, Alamo Towers for $11.2 million with a February 2026 closing, and the remaining Onyx asset expected to hit the market in Q1 2026. This case exemplifies the office sector’s ongoing leasing challenges and the shift toward liquidation amid weak demand.
4520 S Drexel Boulevard – BANK 2022-BN43 (Conduit | Multifamily | Chicago, IL)
A $15.4 million multifamily loan backed by a 68-unit property in Chicago’s South Side transferred to special servicing for payment default, currently 30 days delinquent. Constructed in 1922 and renovated in 2021, the asset has seen occupancy drop to 85% from 95% at underwriting, with DSCR falling to 0.98x from 1.23x at year-end 2023. Contributing factors include reduced rental income and elevated expenses for repairs, utilities, and apartment turnovers. Recent inspections flagged deferred maintenance issues, such as microbial growth and exposed wiring. Collections are in process, with the servicer engaging the borrower on remediation. This transfer highlights idiosyncratic multifamily distress tied to operational inefficiencies rather than broader market weakness.
This $11.3 million agency loan, collateralized by a 159-unit multifamily complex built in 1986 and renovated in 2013, entered special servicing following a October 2025 maturity default. Despite the non-performing matured status, fundamentals are robust: occupancy stands at 96%, and DSCR exceeds 2.1x. The special servicer, CWCapital, is reviewing files to determine a workout, with full payoff or refinance as potential paths. Unlike many distressed assets, this loan’s issues stem primarily from refinancing friction in a high-interest environment, illustrating how maturity walls can impact even high-performing properties.
Brier Creek Corporate Center I & II – WFCM 2016-C33 (Conduit | Office | Raleigh, NC)
Secured by two adjacent office buildings totaling 180,955 SF in Raleigh’s RTP/RDU submarket, this $18.9 million loan transferred to special servicing amid imminent maturity default and chronic cash flow shortfalls. Occupancy has plummeted to 37% following the 2021 exit of a major tenant occupying 50% of space, triggering cash sweeps and yielding a negative DSCR of -0.33x. The sponsor remains committed, with recent leasing activity boosting occupancy slightly, but progress is slow. Rialto Capital is overseeing collections as maturity approaches in December 2025. This example underscores the office sector’s vulnerability to tenant churn and the challenges of repositioning assets in competitive markets.
A $185 million retail loan backed by a 522,133 SF outlet center in Williamsburg, VA, moved to special servicing in December 2025 due to imminent balloon risk ahead of its February 2026 maturity. Currently late but less than 30 days delinquent, the property maintains 78% occupancy and a DSCR of 2.17x—solid but below the 2.52x underwriting level. Midland Loan Services is initiating borrower discussions on refinance options. This transfer reflects retail’s bifurcation: strong cash flow from well-positioned assets contrasted with capital markets barriers to payoff.
Broader Implications and Outlook
These cases reveal a market in transition, where office distress dominates due to structural shifts, while multifamily and retail challenges are more tied to refinancing dynamics. Maturity defaults are the leading trigger, even for assets with stable operations, amid elevated interest rates and cautious lending. CRED iQ anticipates continued monitoring as special servicers pursue resolutions, with potential for increased dispositions and modifications in early 2026. Stakeholders should prepare for ongoing volatility, prioritizing assets with resilient cash flows and proactive capital strategies.
As 2025 comes to a close, the CRED iQ research team wanted to take a moment and reflect upon a year which was filled with uncertainty, elevating distress and even optimism.
In this issue, we look back at 2025 and the stories that captured the markets. As we get ready to turn the page on 2025, we are pleased to present our most-read research of the year.
This blog explores the expanding “maturity wall” in CRE, where a staggering $440 billion in loans are set to mature within the next two years. It discusses the challenges borrowers face in refinancing amid higher interest rates and tighter lending conditions, potentially leading to increased defaults or forced sales. Key implications include heightened market volatility and opportunities for distressed asset investors.
The post analyzes the upward trajectory of capitalization rates across various CRE sectors, signaling a shift toward higher yields as property values adjust to economic pressures. It highlights factors like inflation, rising borrowing costs, and reduced investor appetite, with data showing consistent quarter-over-quarter increases. Readers gain insights into how this trend affects valuation strategies and investment returns.
Focusing on the multifamily sector, this article details how distress volumes have reached levels not seen in 12 years, driven by factors such as oversupply, rent growth slowdowns, and operational challenges. It includes metrics on delinquent loans and foreclosures, offering comparisons to historical peaks. The summary underscores risks for lenders and opportunities for value-add strategies in affected markets.
This forward-looking piece identifies the top U.S. multifamily markets poised for growth in 2025, based on factors like population influx, job creation, and rental demand. It ranks cities or regions with strong fundamentals, such as low vacancy rates and robust economic drivers. Investors can use these insights to prioritize allocations in high-potential areas amid broader sector uncertainties.
The blog reports a significant decline in distress rates for commercial real estate collateralized loan obligations (CRE CLOs) by 230 basis points in June, indicating a potential stabilization or recovery phase. It examines underlying causes, such as improved liquidity or policy interventions, with breakdowns by asset class. This positive shift suggests easing pressures in structured finance, though ongoing monitoring is advised.
This analysis covers the surge in “extend and pretend” strategies, where $40 billion in CRE loans have been modified to delay maturities and avoid defaults. It discusses how lenders and borrowers are navigating high interest rates through restructurings, with implications for market transparency and future distress. The post highlights this as a sign of adapting to prolonged economic headwinds.
Detailing a reversal in trends, the article notes that commercial mortgage-backed securities (CMBS) distress rates have climbed to 11%, ending a three-month decline. It breaks down contributions from sectors like office and retail, with data on special servicing transfers. This uptick signals renewed concerns over asset performance and could influence investor sentiment in securitized markets.
The post examines the office sector’s distress rate surpassing 17%, amid persistent remote work trends and vacancy spikes. It includes regional variations and loan performance metrics, attributing the rise to obsolescence and reduced demand. Implications focus on the need for repurposing strategies and the long-term outlook for office investments.
This historical overview tracks CRE delinquency trends from the 2008 Great Financial Crisis through Q1 2025, providing comparative data on peaks, recoveries, and current trajectories. It identifies patterns in delinquency rates across property types, offering lessons for risk management. The analysis helps contextualize today’s environment against past cycles, aiding in forecasting potential resolutions.
Offering a mid-year snapshot, the blog ranks the leading originators of CMBS conduit loans in 2025, based on volume and market share. It discusses key players’ strategies, deal structures, and shifts in origination activity amid evolving regulations. This review provides valuable benchmarks for industry participants tracking securitization trends and competitive dynamics.
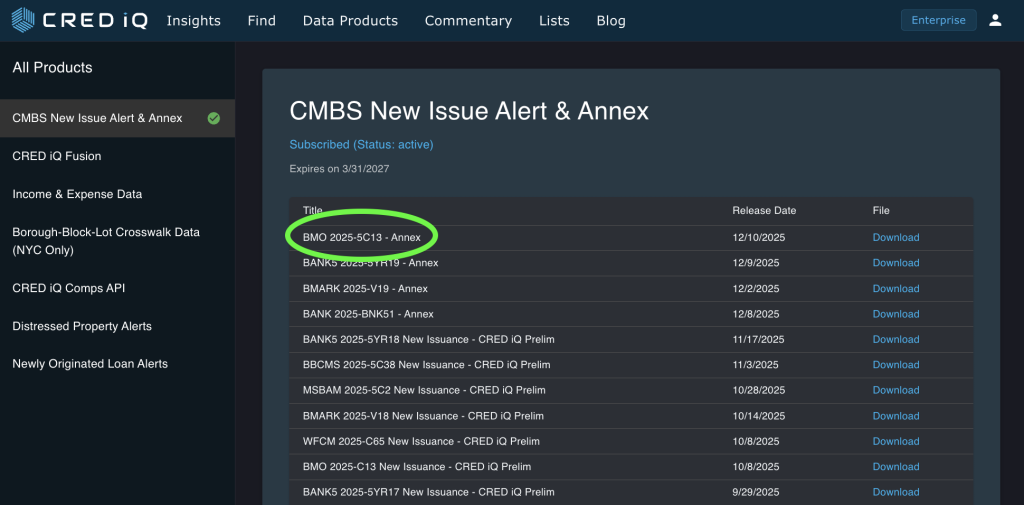
Type: Public fixed-rate conduit CMBS Size: $484.906 MM publicly offered certificates (total trust balance: $551,814,060) Issuance Date: Pricing week of December 15, 2025 | Expected settlement December 30, 2025 Co-Lead Managers & Joint Bookrunners: BMO Capital Markets Corp., Deutsche Bank Securities Inc., Citigroup Global Markets Inc., SG Americas Securities, LLC Co-Managers: Academy Securities, Inc., Bancroft Capital, LLC, Drexel Hamilton, LLC, Mischler Financial Group, Inc., Natixis Securities Americas LLC
Key Pool Characteristics
Initial Pool Balance: $551,814,060 Number of Loans / Properties: 30 / 36 WA Cut-off LTV: 58.5% WA UW NCF DSCR: 1.99x WA Debt Yield (UW NOI): 13.9% WA Mortgage Rate: 6.35128% WA Remaining Term: 59 months
Geographic Concentration NY 33.1% | CA 12.4% | NV 12.3% | ID 9.8% | VA 5.3%
Risk Retention: Horizontal (HRR)
Anticipated Settlement: December 30, 2025
Servicing & Parties
Master Servicer: Midland Loan Services, a Division of PNC Bank, National Association Special Servicer: 3650 REIT Loan Servicing LLC Data & Analytics Provider: CRED iQ
Key Analysis
BMO 2025-5C13 is one of the final conduits of 2025, showcasing exceptionally conservative underwriting with a WA cut-off LTV of 58.5%—among the lowest in recent vintages—and a robust 13.9% UW NOI debt yield that offers significant protection in the current rate environment.
The deal provides 30% credit enhancement to the AAA classes, consistent with post-2023 conduit norms, bolstered by a strong 1.99x UW NCF DSCR. Loan concentration is elevated, with the top 11 loans accounting for 67% of the pool balance, though this is driven by high-quality, granular assets across multifamily and retail.
Property-type exposure is led by multifamily (35.2%) and retail (27.0%), with notable office (17.4%) and hospitality (12.2%) allocations supported by low leverage and healthy debt yields. Geographically, New York leads at 33.1%, with Western markets (CA, NV, ID) combining for ~34.5%—a common profile for year-end deals.
Key contributors include 3650 Capital (33.6%) and BMO (31.8%), with 3650 also handling special servicing and controlling class duties. As 2025 U.S. conduit issuance closes near $60 billion—essentially flat year-over-year—this transaction underscores ongoing investor preference for tightly underwritten, low-LTV deals as the market heads into 2026.
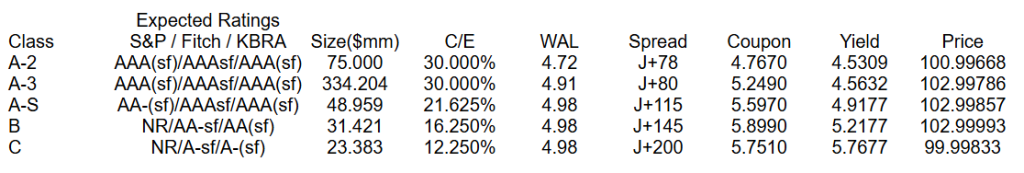
Type: Public fixed-rate conduit CMBS (primarily interest-only with limited partial amortizing loans) Size: $588.7 MM publicly offered certificates (total trust balance: $588,699,194) Issuance Date: Priced December 9, 2025 | Expected settlement December 23, 2025 Co-Lead Managers & Joint Bookrunners: Citigroup, Goldman Sachs & Co. LLC, Barclays, Deutsche Bank Securities Co-Managers: Drexel Hamilton, Mischler Financial Group
Pricing
Key Pool Characteristics
Initial Pool Balance: $588,699,194 Number of Loans / Properties: 28 / 48 WA Cut-off LTV: 61.6% WA Maturity LTV: 61.6% WA UW NCF DSCR: 1.71x WA Debt Yield (UW NOI): 11.4% WA Mortgage Rate: 6.286% WA Remaining Term: 59 months
Geographic Concentration CA 22.3% | NY 18.3% | SD 6.8% | DE 5.9% | FL 5.9%
Risk Retention: L-shaped (horizontal + vertical)
Anticipated Settlement: December 23, 2025
Servicing & Parties
Master & Special Servicer: Midland Loan Services (PNC) Operating Advisor: Park Bridge Lender Services Data & Analytics Provider: CRED iQ
Key Analysis
BMARK 2025-V19 closed out the 2025 conduit calendar on a strong note, with the entire stack pricing 5–20 bps inside initial guidance — a sign that late-year demand for floating-rate exposure remains robust despite the Fed’s recent rate cuts.
The deal’s 30% credit enhancement to the AAA classes is in line with recent Benchmark vintages and continues to reflect the conservative underwriting that has characterized post-2023 conduit issuance. A WA cut-off LTV of 61.6% with essentially no amortization (maturity LTV unchanged) and a solid 1.71x UW DSCR provide reasonable cushion against near-term stress.
Property-type diversity is better than many recent deals, with no single sector exceeding 22%. The heavier retail (21.5%) and hospitality (18.7%) allocations are notable but mitigated by strong debt yields (11.4% overall) and granular loan sizing (average ~$21 mm).Geographically, the 40.6% combined California + New York concentration is typical for year-end conduits, though the 6.8% South Dakota exposure (likely tied to a large self-storage portfolio) adds an unusual Midwestern tilt.
With this transaction, full-year 2025 U.S. conduit volume ends just under $60 billion — virtually unchanged from 2024 and still roughly 40% below the 2017–2019 average. Expect 2026 to remain range-bound unless material rate relief or a surge in transitional lending sparks a meaningful rebound.
Type: Public fixed-rate 5-year conduit CMBS (fully amortizing) Size: $794.55 MM publicly offered certificates (total pool: $949.07 MM) Issuance Date: Announced & pricing December 10, 2025 | Expected closing December 23, 2025 Lead Bookrunners: Morgan Stanley, BofA Securities, J.P. Morgan, Wells Fargo Securities Co-Managers: AmeriVet Securities, Siebert Williams Shank
Key Pool Characteristics
Number of loans/properties: 35 loans / 85 properties WA Coupon: 6.3181% WA Cut-off LTV: 60.0% WA UW NCF DSCR: 1.63× WA UW NOI Debt Yield: 11.0% WA Original Term / Amortization: 60 months / 60 months (100% fully amortizing) Top 10 loans concentration: 54.2% Loan sellers: Wells Fargo (32.0%), Bank of America (31.7%), Morgan Stanley (24.7%), JPMorgan Chase (11.6%) Top states: CA (21.4%), NY (20.1%), VA (14.4%), FL (10.0%), TX (8.7%) Top property types: Multifamily (27.8%), Retail (26.6%), Hotel (17.1%), Manufactured Housing (11.0%), Self-Storage (10.6%) Risk Retention: Eligible Vertical Interest (EVI)
Servicing & Parties
Master Servicer: Trimont LLC Special Servicer: Torchlight Loan Servicers, LLC Data & Analytics Provider: CRED iQ Notable: One of the very few fully amortizing 5-year fixed-rate conduits to price in 2025 and the final new-issue conduit of the year. Tight credit band (60% LTV, 11% NOI debt yield, 1.63× DSCR) reflects the highly selective lending environment for short-duration paper. Heavy combined retail + hotel exposure (43.7%) in total pool, likely higher in top 10) stands out in an otherwise conservative structure.
Key Analysis
Credit Quality and Metrics: The pool is deliberately underwritten to a tight credit profile typical of 5-year money, with rapid de-levering from full amortization (projected pool LTV 30% at maturity). The 11.0% NOI debt yield is among the strongest seen in recent 5-year deals, though the 1.63× NCF DSCR is thin by 7/10-year standards — a function of elevated 5-year rates (6.32%) rather than aggressive advance rates. Top-10 concentration is moderate at 54.2%, providing reasonable granularity for a 35-loan pool.
Property Type Exposure: Multifamily (27.8%) and retail (26.6%) dominate, followed by a meaningful hotel sleeve (17.1%). The retail exposure is likely anchored/grocery or necessity-based given the low LTV and strong debt yield, while the hotel piece introduces the most cyclical risk in a 5-year bullet-like payoff structure (despite amortization). Manufactured housing (11.0%) and self-storage (10.6%) add stable, cash-flowing collateral with low operating-expense volatility.
Geographic Concentration: Well diversified across top five states (none >21.4%), with exposure skewed toward coastal and Sunbelt growth markets (CA, NY, VA, FL, TX = 74.6% combined). Minimal overlap with recent natural disaster zones.
Structural and Risk Considerations All loans are non-recourse with standard carve-outs and include TI/LC and capex reserves; partial releases are allowed on select multi-property loans under customary tests. Primary risks stem from the 17.1% hotel and 26.6% retail exposure — cyclical RevPAR sensitivity in hospitality and potential shadow-anchor/tenant-roll issues in retail. These concerns are meaningfully offset by the pool’s tight 60.0% LTV, strong 11.0% NOI debt yield, thick 30% AAA credit enhancement, and 100% five-year full amortization that eliminates maturity risk. A blue-chip originator lineup (WFB, BANA, MS, JPM) and Torchlight’s aligned role as both special servicer and controlling class rep further bolster the structure. Overall, BANK5 2025-5YR19 stands out as one of the most defensive 5-year conduits of 2025.