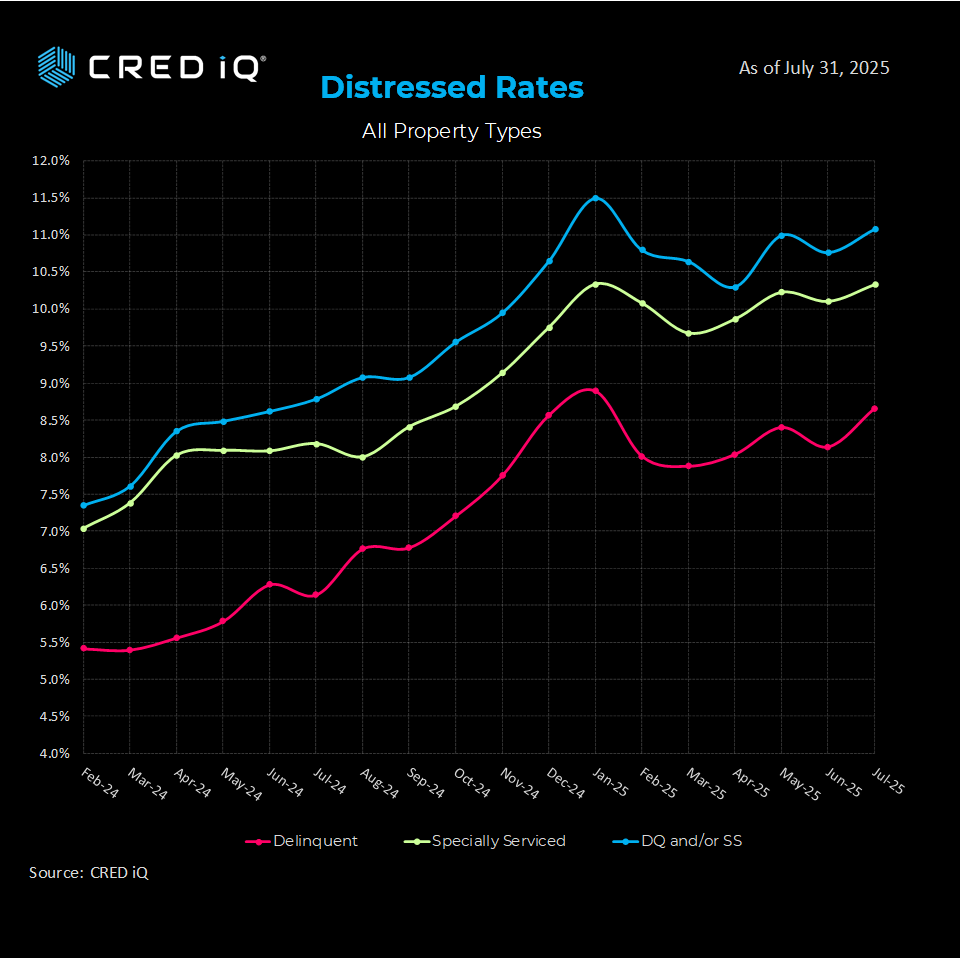
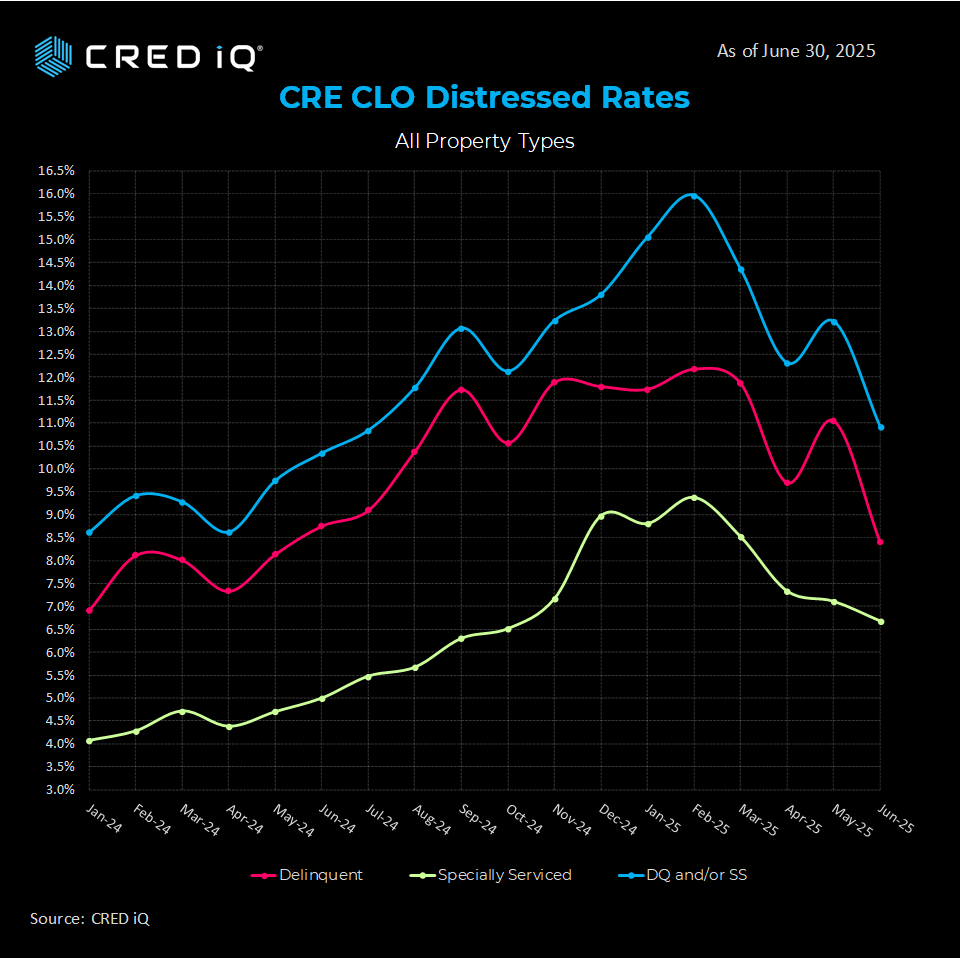
According to CRED iQ’s July 2025 CRE CLO Distress Report, the distress rate—encompassing loans 30+ days delinquent, past maturity, or in special servicing—increased by 88 basis points (BPS) to 11.8% from 10.9% in June. The 88 BPS increase partially offset the 230 BPS decrease in the June print.
This continues a choppy monthly pattern with downward trending since the peak in March of this year as maturities continue to rise, while pre-maturity delinquencies see a significant month-over-month decline
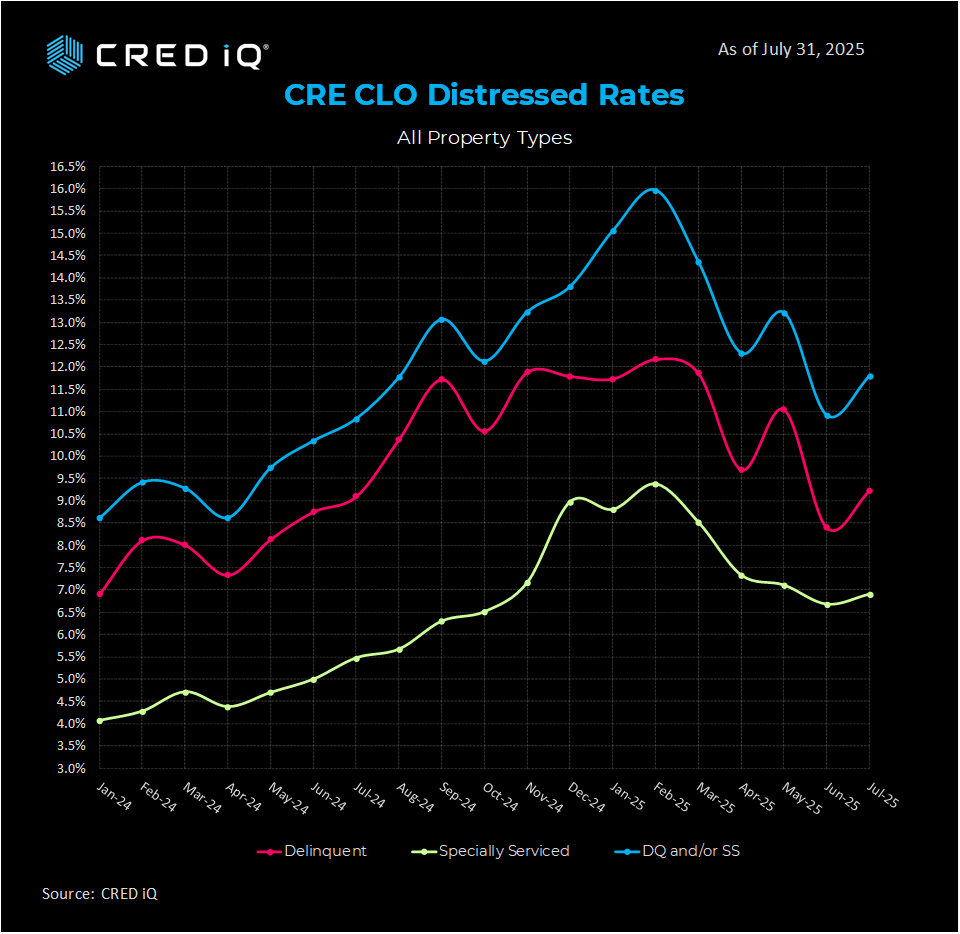
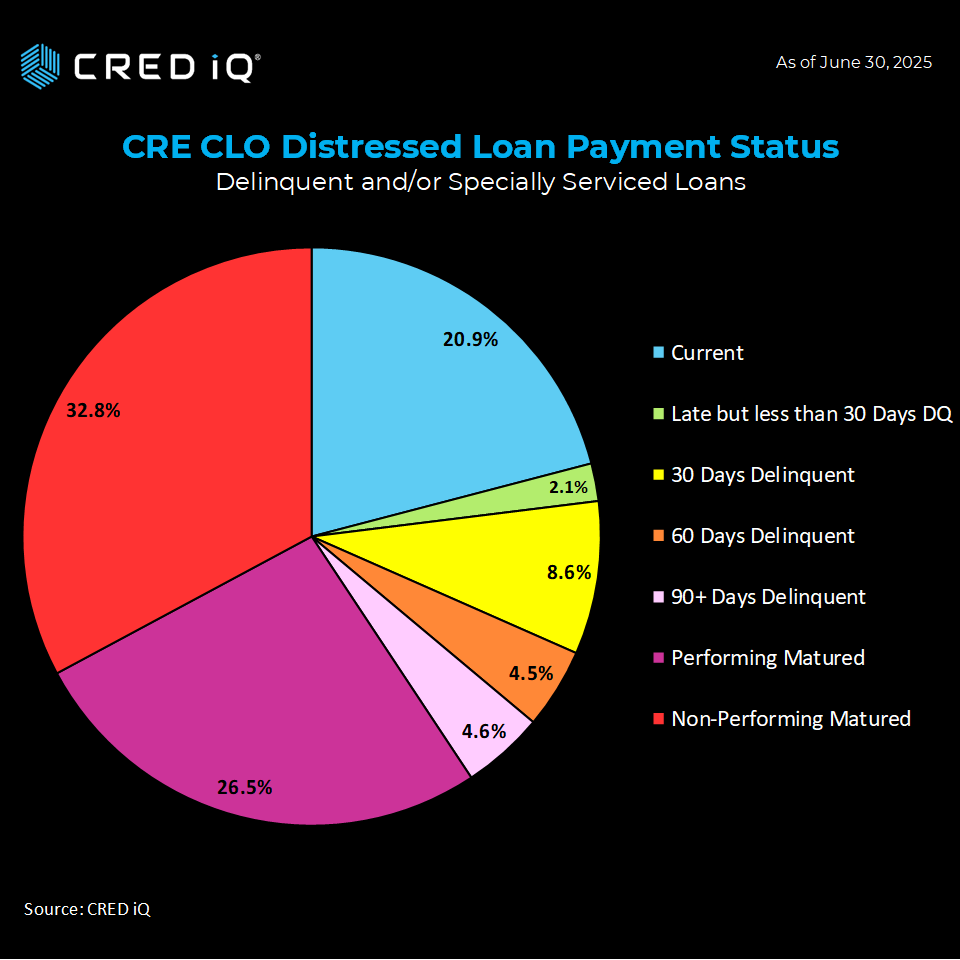
Delinquency rates, a critical indicator, increased by 82 BPS to 9.2% of all CRE CLO loans in July, while the special servicing rate also increased, albeit more modestly, adding 23 BPS to 6.9%.
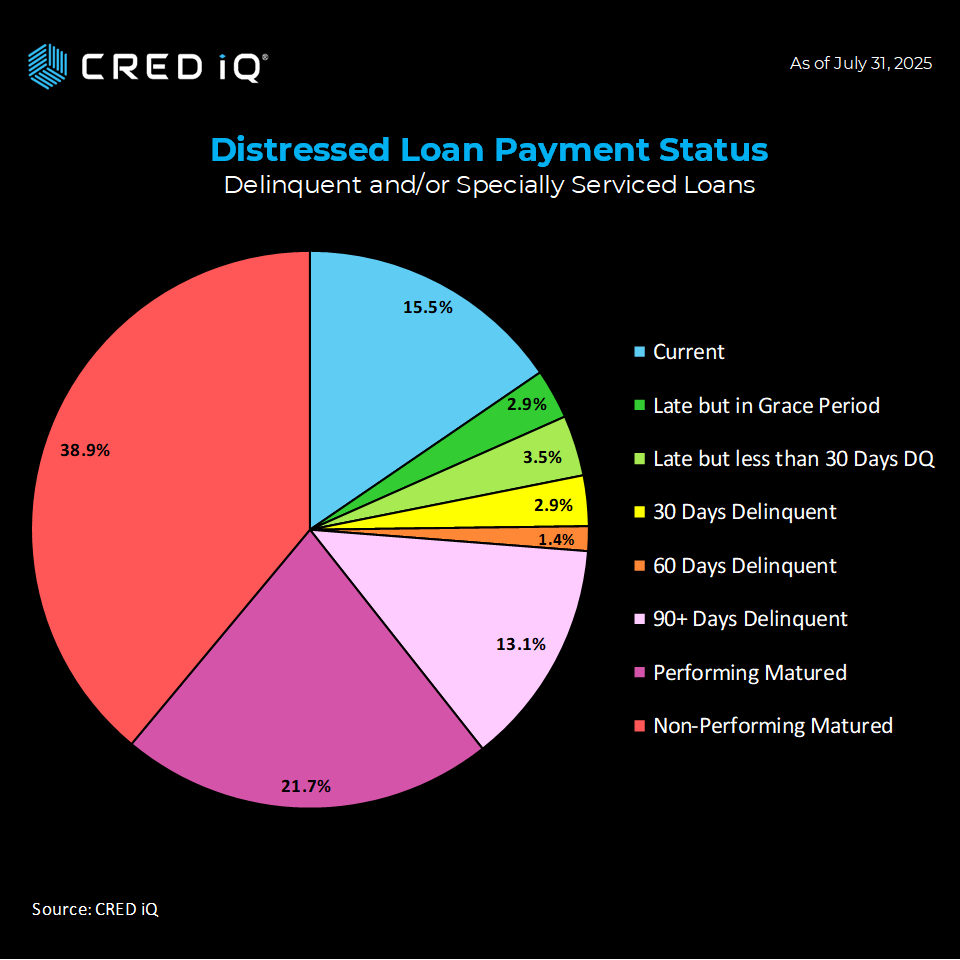
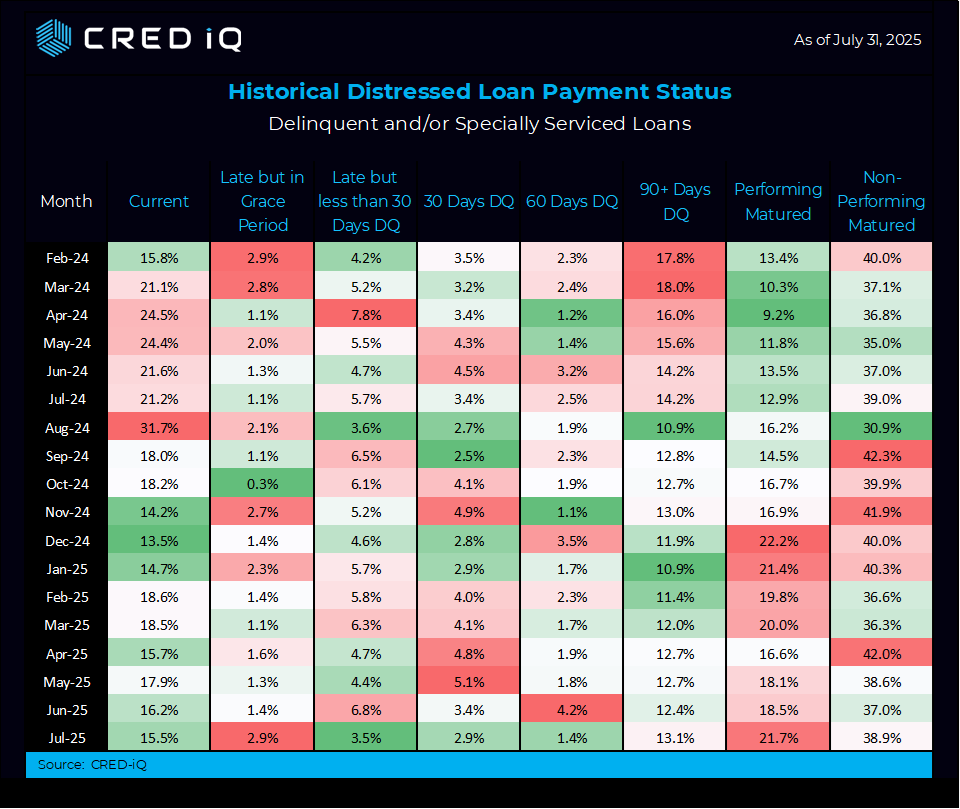
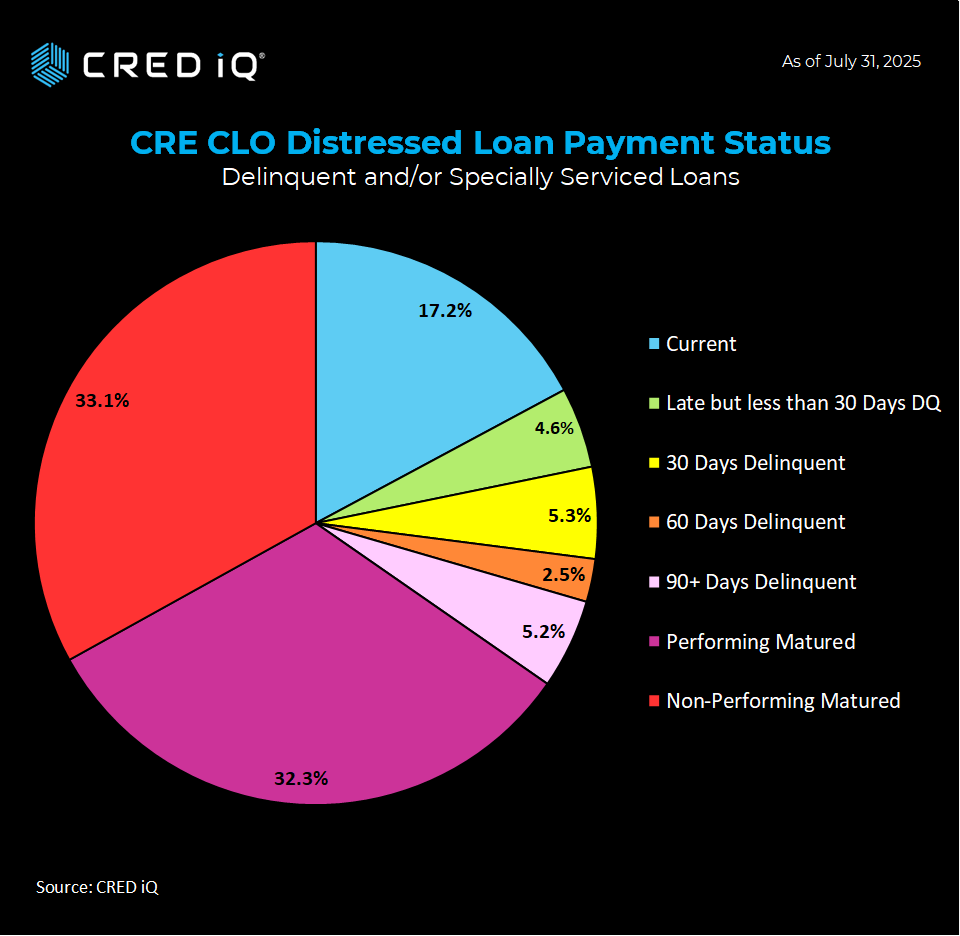
$1.2 billion in CRE CLO loans are current, a drop of 377 BPS to 17.2% following last month’s 660 BPS increase. However, 65.3% of loans have surpassed their maturity dates, with 32.3% classified as “performing matured” (up from 26.5%) and 33.1% as “non-performing matured” (up from 32.8%). Pre-maturity delinquencies shed 478 BPS to 12.9% from 17.7% .
For investors and lenders, the CRE CLO market’s seesaw trends underscore the need for vigilance. Platforms like CRED iQ provide critical insights into loan performance, helping stakeholders navigate risks and seize opportunities in this resilient yet volatile market.
About CRED iQ
CRED iQ is a market data provider that offers a robust suite of data and software solutions tailored for commercial real estate and finance professionals.
With over $2.3 trillion of CRE loans, CRED iQ delivers instant access to a comprehensive range of financial data and analytics for millions of properties in every market. CRED iQ’s data and analytical capabilities are instrumental in helping investors, lenders and brokers make informed and strategic decisions critical to their business.
THE DATA, INFORMATION AND/OR RELATED MATERAL (“DELIVERABLES”) IS BEING OFFERED AS-IS/WHERE-AS CONDITION. CRED-IQ MAKES NO REPRESENTATION OR WARRANTY AS TO QUALITY OR ACCURACY OF SUCH DELIVERABLES BEING PURCHASED, WHETHER EXPRESS OR IMPLIED, EITHER IN FACT OR BY OPERATION OF LAW, STATUTE, OR OTHERWISE, AND CRED-IQ SPECIFICALLY DISCLAIMS ANY AND ALL IMPLIED OR STATUTORY WARRANTIES INCLUDING WARRANTIES OF MERCHANTABILITY AND OF FITNESS FOR A PARTICULAR PURPOSE, TECHNICAL PERFORMANCE, AND NON-INFRINGEMENT. WITHOUT LIMITING THE FOREGOING, YOU AS CUSTOMER ACKNOWLEDGE THAT YOU HAVE NOT AND ARE NOT RELYING UPON ANY IMPLIED WARRANTY OF MERCHANTABILITY OR OF FITNESS FOR A PARTICULAR PURPOSE OR OTHERWISE, OR UPON ANY REPRESENTATION OR WARRANTY WHATSOEVER AS TO THE DELIVERABLES IN ANY REGARDS WHATSOEVER, AND ACKNOWLEDGE THAT CRED-IQ MAKES NO, AND HEREBY DISCLAIMS ANY, REPRESENTATION, WARRANTY OR GUARANTEE THAT THE PURCHASE, USE OR COMMERCIALIZATION OF ANY DELIVERABLES WILL BE USEFUL TO YOU OR FREE FROM INTERFERENCE. BY ACCEPTANCE OF THE DELIVERABLES, YOU HEREBY RELEASE CRED-IQ AND ITS AFFILIATES AND AGENTS FROM ALL CLAIMS, DAMAGES AND LIABILITY ARISING HEREUNDER.