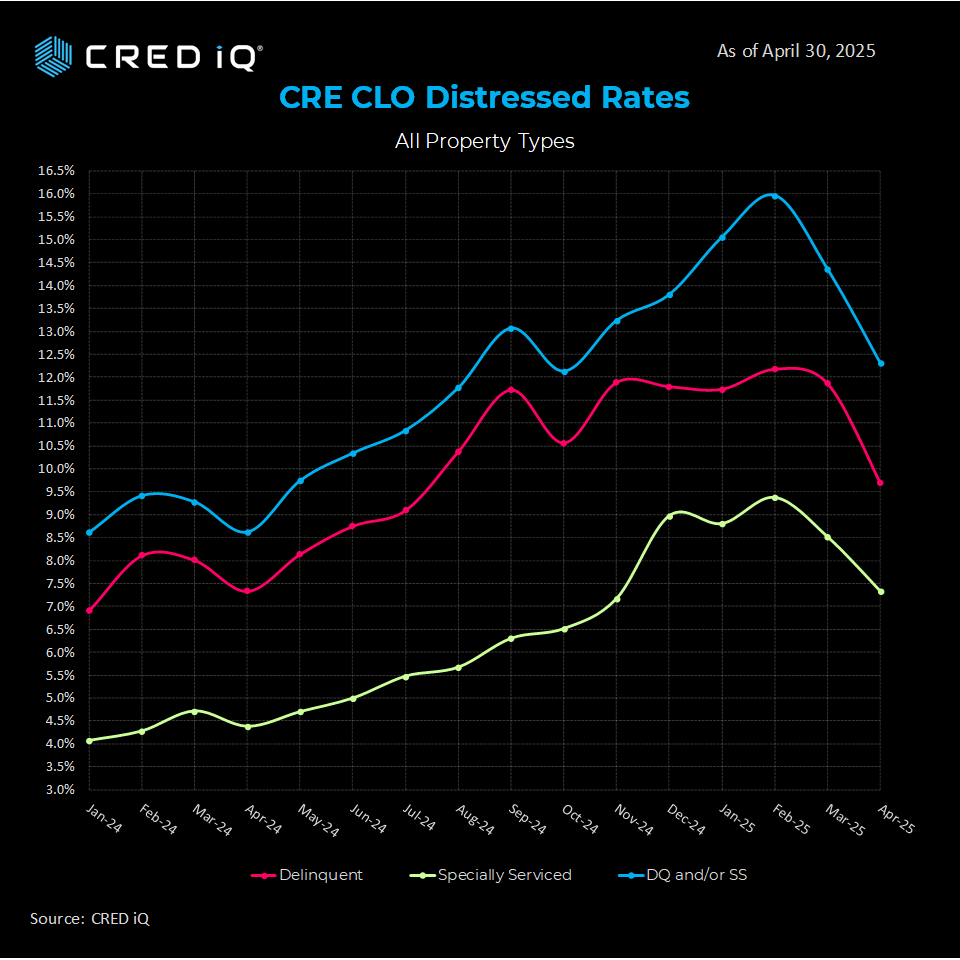
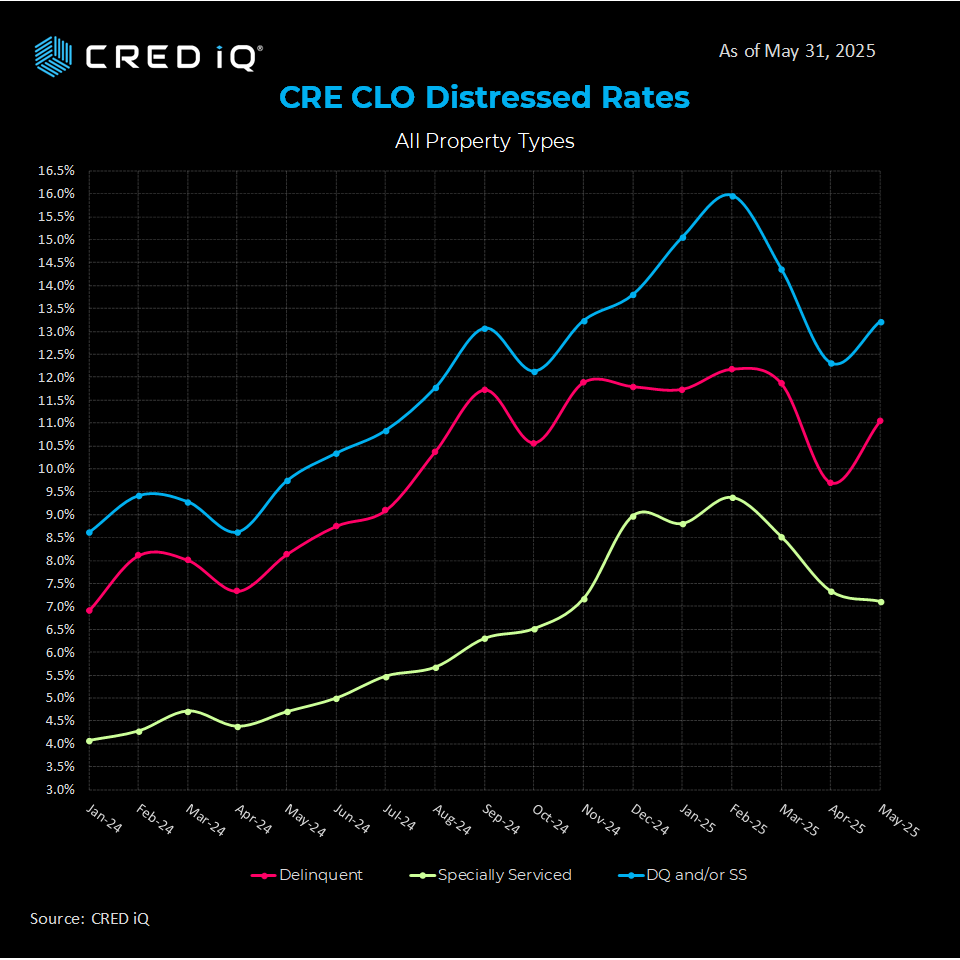
Following a dramatic reduction, the commercial real estate collateralized loan obligation (CRE CLO) market saw its distress rate rise by 80 basis points to 13.2% in our latest print. Originations in the sector continue to be robust, so a clear picture is murky at best. Let’s dig in into the data.
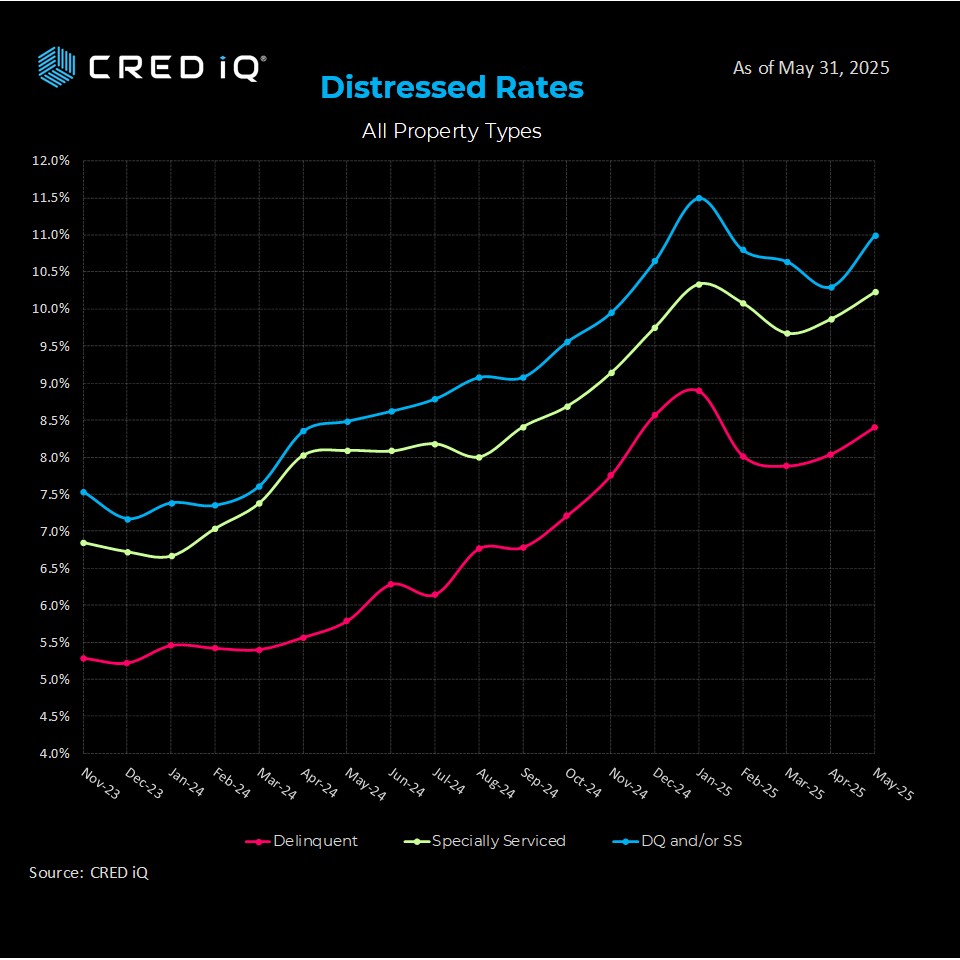
Investors hoping for a third consecutive reduction in the CRE CLO distress rate are left a bit disappointed as the benchmark added 80 basis points to close at 13.2% in the May print.
The underlying metrics were mixed with the special serving rate shaving 30 BPS to 7.1% while the all-important delinquency rate added 130 BPS reaching 11.0%.
Sector Velocity
Similar to last month, our research team widened the aperture a bit to examine the velocity of the CRE CLO sector over the past year. Here are some metrics from our study:
Total year-to-date CRE CLO issuance totals $10.5 billion across 11 deals. As a comparison, during the first four months in 2024, CRE CLO volume only totaled $2.2 billion (3 deals), meaning CRE CLO issuance velocities have increased 377% when compared to last year. Indeed, it could be argued that CRE CLO is already hot!
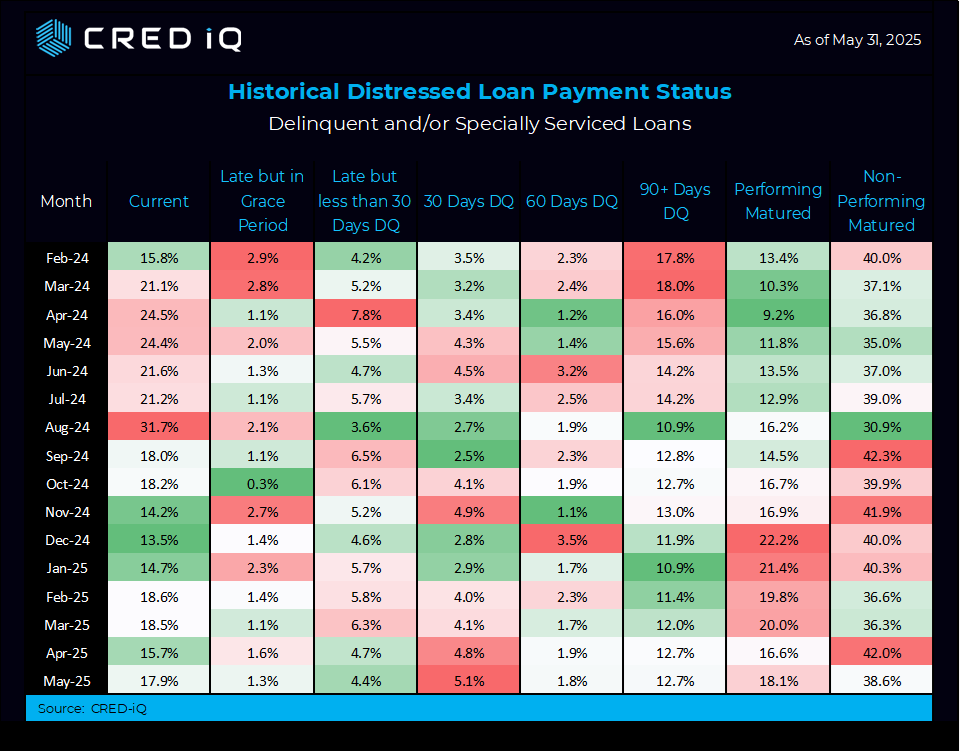
Payment Status
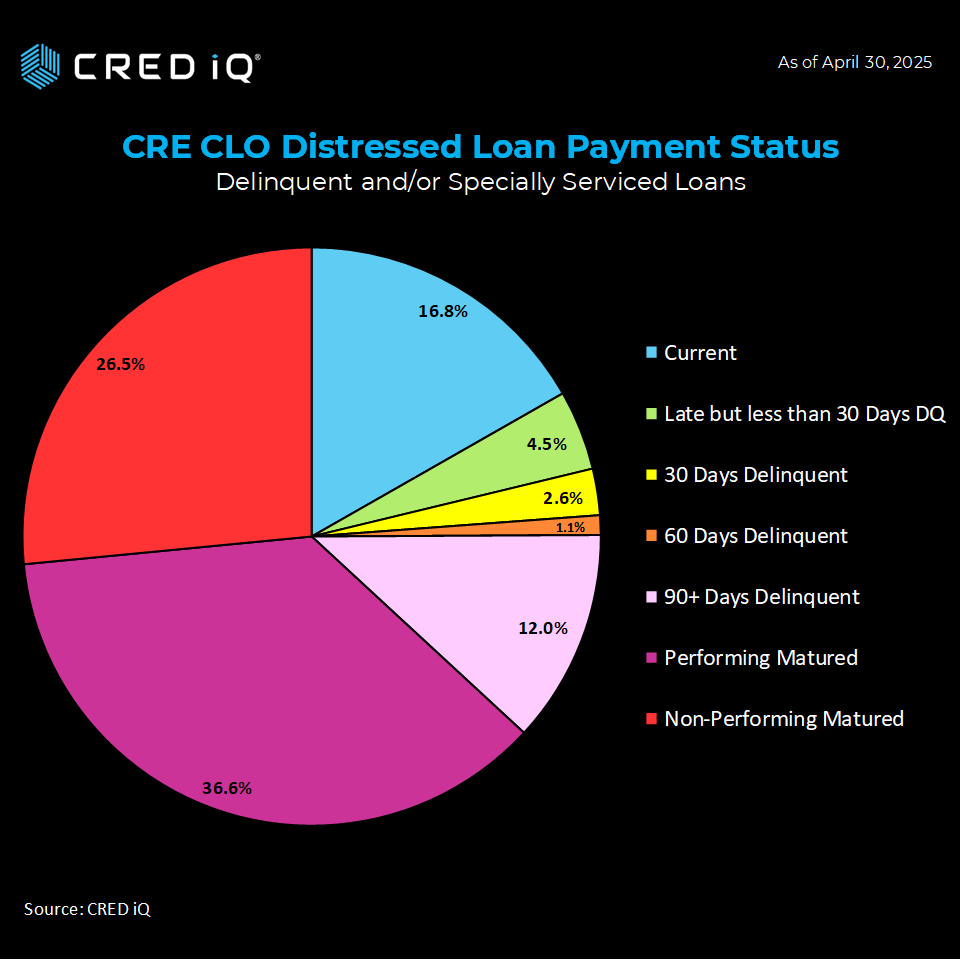
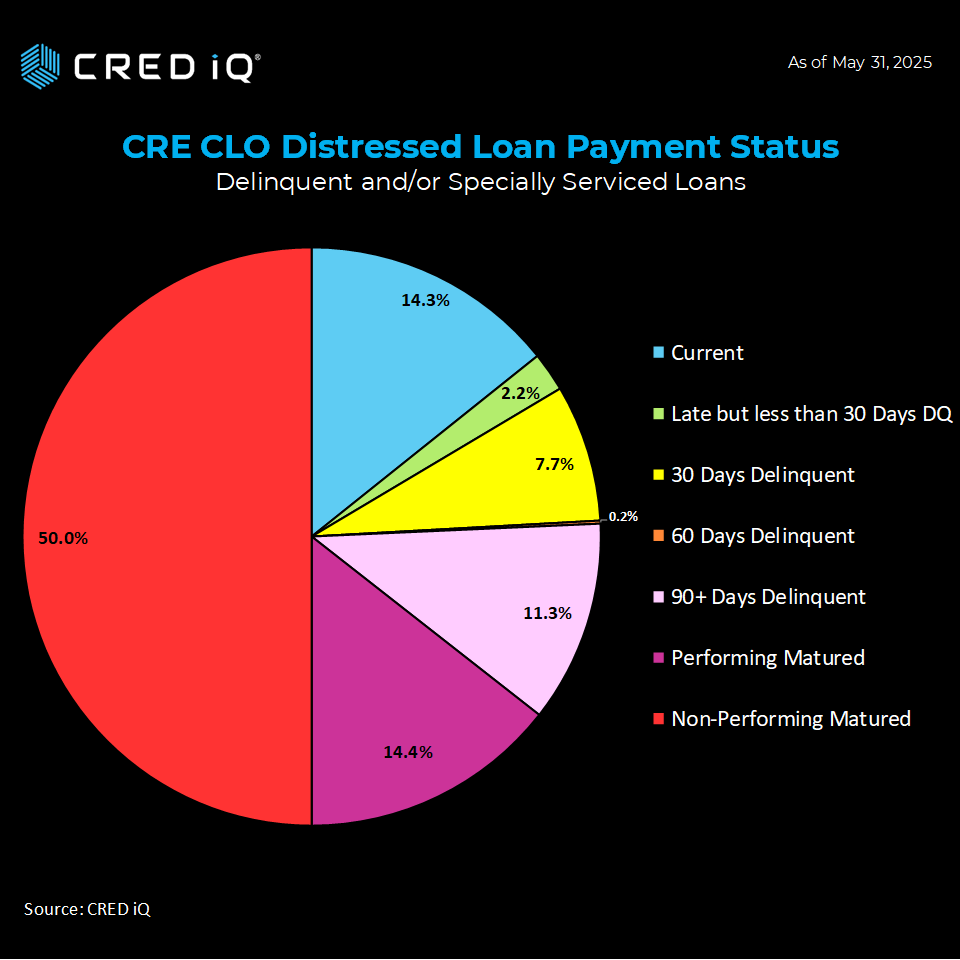
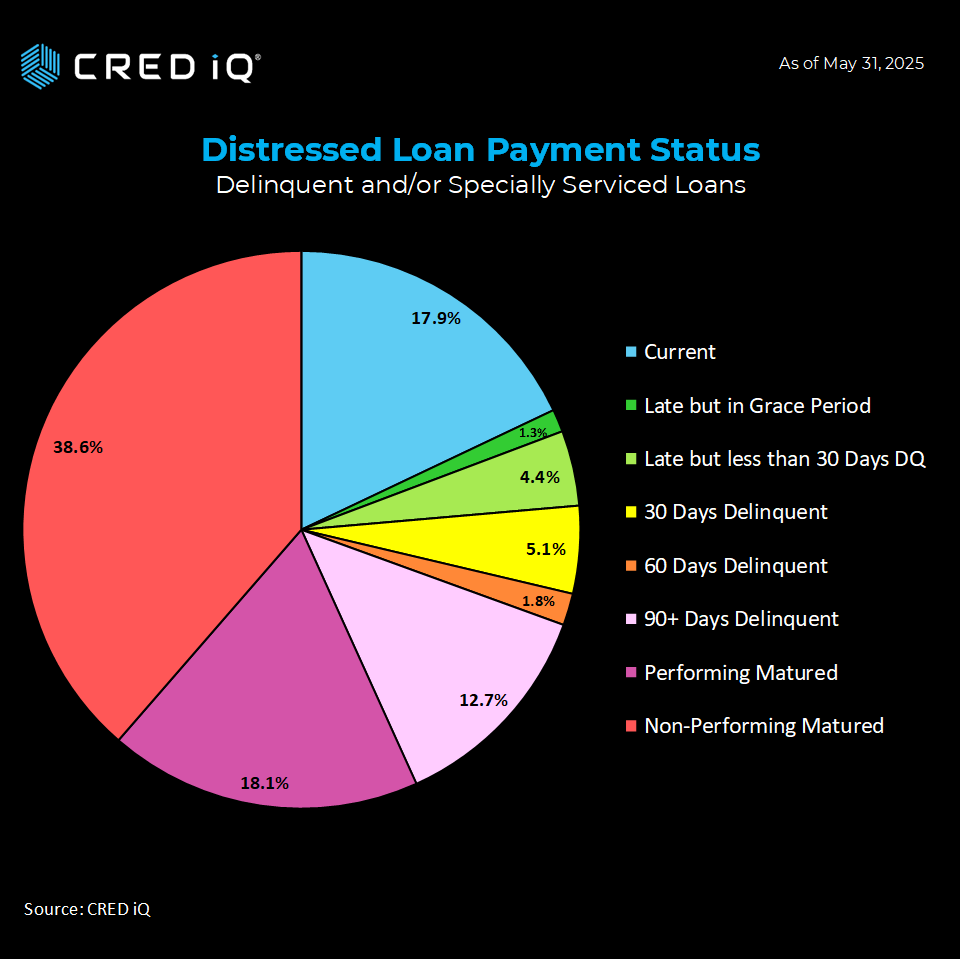
Looking across a wider analysis of payment status reveals ongoing challenges. 64.4% of CRE CLO loans have surpassed their maturity date (up from 63.1% last month). 36.6% are classified as “performing matured –down from 37.3%. This suggests that many borrowers are exercising extension options or negotiating month-to-month arrangements to avoid default.
Precisely half (50.0%) of CRE CLO loans have surpassed their maturity date and are not performing, a new record. This metric was 25.6% in our January print.
14.3% of CRE CLO loans are current—down from 16.8% last month.
Delinquent Loans (Pre-Maturity): Account for 21.3% which is the third consecutive month-over-month increase.
These figures reflect a market grappling with the aftermath of loans originated in 2021-2022, when cap rates were compressed, valuations were elevated, and interest rates were historically low. Many of these loans, structured with floating rates and three-year terms, are now hitting maturity walls in a dramatically different economic environment.
Case Study: Norterra Canyon Apartments
A real-world example illustrates the pressures facing CRE CLO borrowers. The $58.6 million Norterra Canyon Apartments loan, backed by a 426-unit multifamily property in Las Vegas, highlights maturity-related challenges. The loan was added to the servicer’s watchlist in November 2024 due to pending loan maturity. Set to mature in May 2025, the loan transitioned to non-performing mature status in May 2025.
or more information, visit CRED iQ or reach out to our research team.
About CRED iQ
CRED iQ is a market data provider that offers a robust suite of data and software solutions tailored for commercial real estate and finance professionals.
With over $2.3 trillion of CRE loans, CRED iQ delivers instant access to a comprehensive range of financial data and analytics for millions of properties in every market. CRED iQ’s data and analytical capabilities are instrumental in helping investors, lenders and brokers make informed and strategic decisions critical to their business.
THE DATA, INFORMATION AND/OR RELATED MATERAL (“DELIVERABLES”) IS BEING OFFERED AS-IS/WHERE-AS CONDITION. CRED-IQ MAKES NO REPRESENTATION OR WARRANTY AS TO QUALITY OR ACCURACY OF SUCH DELIVERABLES BEING PURCHASED, WHETHER EXPRESS OR IMPLIED, EITHER IN FACT OR BY OPERATION OF LAW, STATUTE, OR OTHERWISE, AND CRED-IQ SPECIFICALLY DISCLAIMS ANY AND ALL IMPLIED OR STATUTORY WARRANTIES INCLUDING WARRANTIES OF MERCHANTABILITY AND OF FITNESS FOR A PARTICULAR PURPOSE, TECHNICAL PERFORMANCE, AND NON-INFRINGEMENT. WITHOUT LIMITING THE FOREGOING, YOU AS CUSTOMER ACKNOWLEDGE THAT YOU HAVE NOT AND ARE NOT RELYING UPON ANY IMPLIED WARRANTY OF MERCHANTABILITY OR OF FITNESS FOR A PARTICULAR PURPOSE OR OTHERWISE, OR UPON ANY REPRESENTATION OR WARRANTY WHATSOEVER AS TO THE DELIVERABLES IN ANY REGARDS WHATSOEVER, AND ACKNOWLEDGE THAT CRED-IQ MAKES NO, AND HEREBY DISCLAIMS ANY, REPRESENTATION, WARRANTY OR GUARANTEE THAT THE PURCHASE, USE OR COMMERCIALIZATION OF ANY DELIVERABLES WILL BE USEFUL TO YOU OR FREE FROM INTERFERENCE. BY ACCEPTANCE OF THE DELIVERABLES, YOU HEREBY RELEASE CRED-IQ AND ITS AFFILIATES AND AGENTS FROM ALL CLAIMS, DAMAGES AND LIABILITY ARISING HEREUNDER.


")