Home Blog Page 9

Lenders Forcing Landlords To Swallow Higher Insurance Coverage Or Face Distress (Bisnow)

0
This image has an empty alt attribute; its file name is Blog-Featured-Images-4-1024x1024.png

CRED iQ in the News – April, 4 2025

Article Snapshot:

  • Commercial real estate distress has been on the rise as more property owners struggle to stay current with their loans. But the rising cost of insurance is adding a new threat for small landlords: having coverage forced on them by their lenders.
  • Foreclosures and defaults are rising again. By the end of 2024, more than 10% of all commercial real estate properties backed by a CMBS loan were in some form of distress, according to CRE data firm Cred iQ

CRED iQ Market Insights: Distress Rate Declines for Second Consecutive Month as Retail and Hotel Segments Diverge

0

April 03, 2025 – At CRED iQ, we’re committed to delivering timely, data-driven insights into the commercial real estate (CRE) market. Our latest analysis reveals a notable shift: the overall distress rate across commercial mortgage-backed securities (CMBS) has dropped for the second consecutive month, declining by 20 basis points to 10.6%. This encouraging trend is accompanied by modest improvements in our core distress metrics, signaling potential stabilization in certain segments of the market. However, a closer look at property types reveals a tale of divergence—particularly between retail and hotel—offering critical takeaways for investors and stakeholders.

Distress Metrics Show Incremental Progress

Our research team tracks two key indicators of distress: delinquency rates and special servicing rates. In our latest report, the delinquency rate edged down from 8.0% in March to 7.9%, while the special servicing rate saw a more significant 40-basis-point reduction, landing at 9.7%. A year ago, these figures stood at 5.4% and 7.4%, respectively, underscoring how much the CRE landscape has evolved. These month-over-month improvements suggest that while challenges persist, the market may be finding its footing in select areas.

Segment Spotlight: Retail Shines, Hotel Struggles

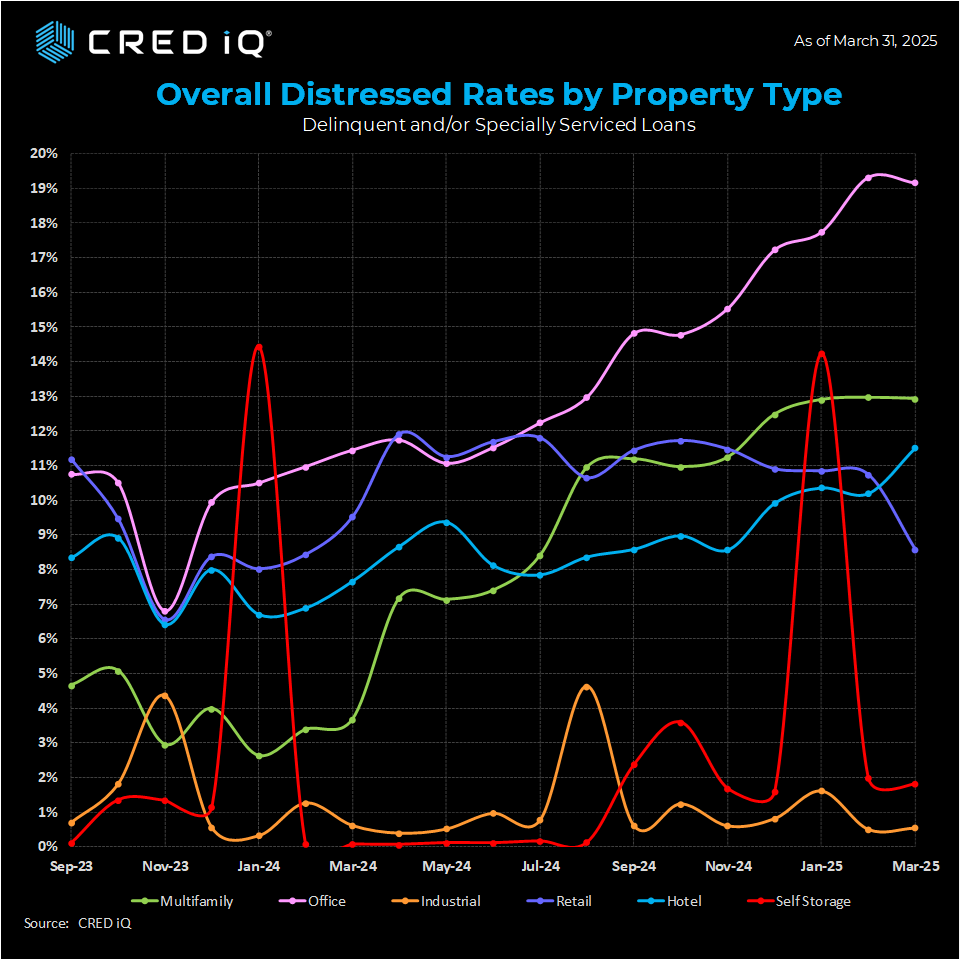
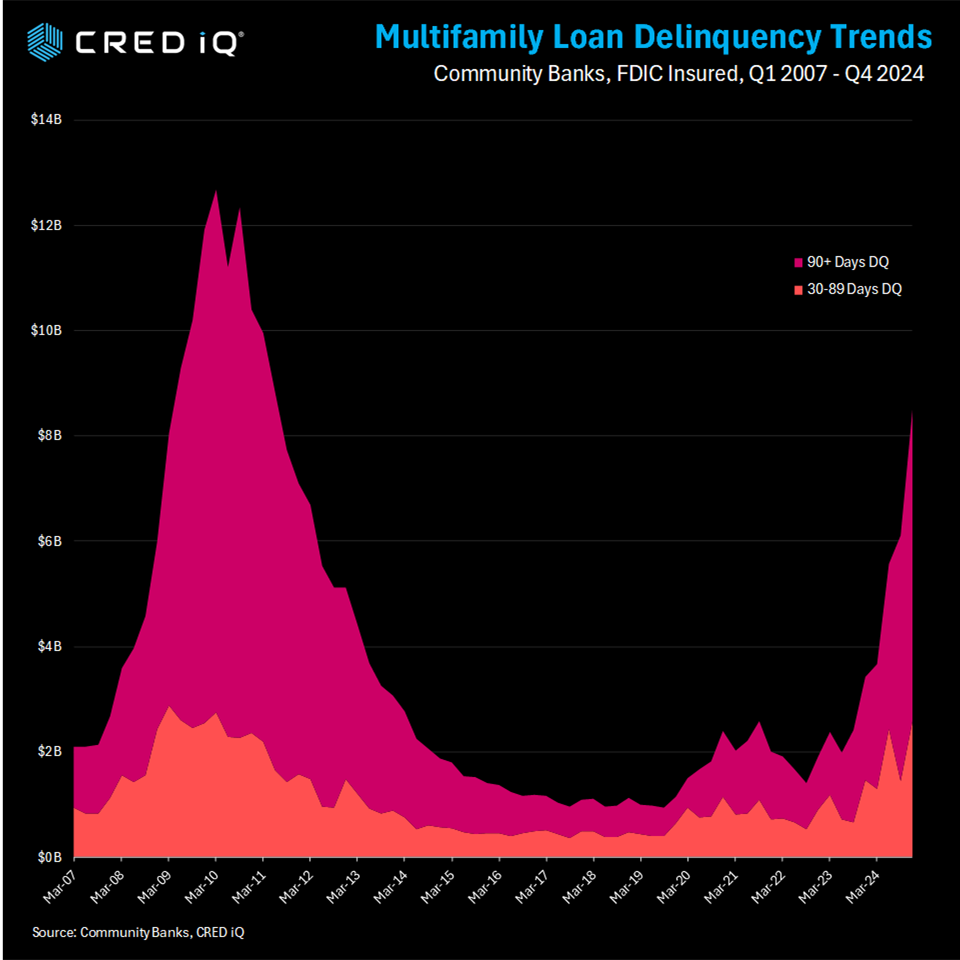
Among property types, the office and multifamily segments remain the most distressed, though both posted relatively flat results. Office continues to lead the pack at 19.2% (down 10 basis points from March), while multifamily eased slightly to 12.9% (also down 10 basis points). These incremental declines hint at resilience, but the broader distress levels in these sectors still warrant close attention.

The real story this month lies in the contrasting fortunes of retail and hotel. Retail, which had been neck-and-neck with hotel in March, delivered a standout performance—its distress rate plummeted 210 basis points to 8.6%. This marks the fifth consecutive month of improvement for the sector and the largest drop in that streak. Factors such as adaptive reuse, strong consumer spending, or successful lease negotiations may be driving this positive momentum—a trend we’ll continue to monitor.

Meanwhile, the hotel segment moved in the opposite direction, with its distress rate climbing 130 basis points to 11.5%. This uptick brings hotel closer to overtaking multifamily as the second-most distressed property type. Rising operational costs, shifting travel patterns, or maturing loans could be contributing to this increase, making hotels a focal point for our next analysis.

Industrial and self-storage, as expected, remain bright spots. Industrial held steady at an impressively low 0.5% distress rate, while self-storage shaved 20 basis points to 1.8%. These segments continue to demonstrate stability amid broader market fluctuations.

Payment Status: A Mixed Picture

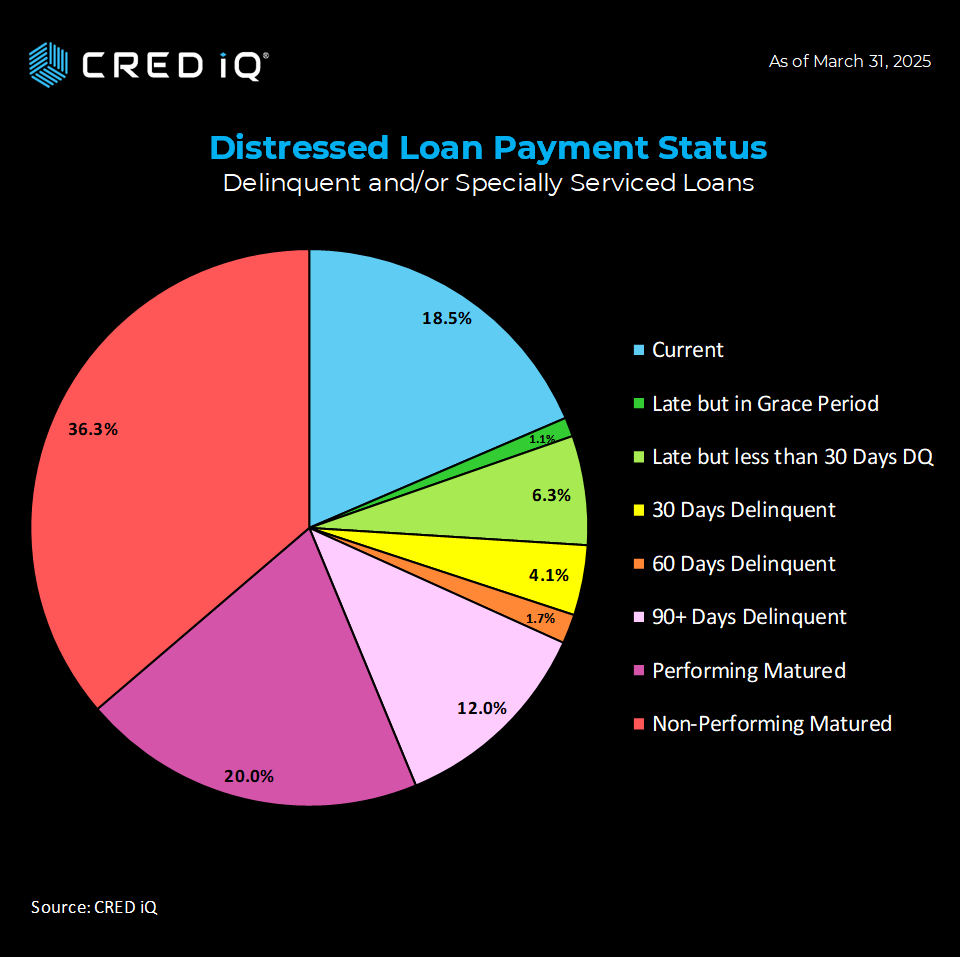
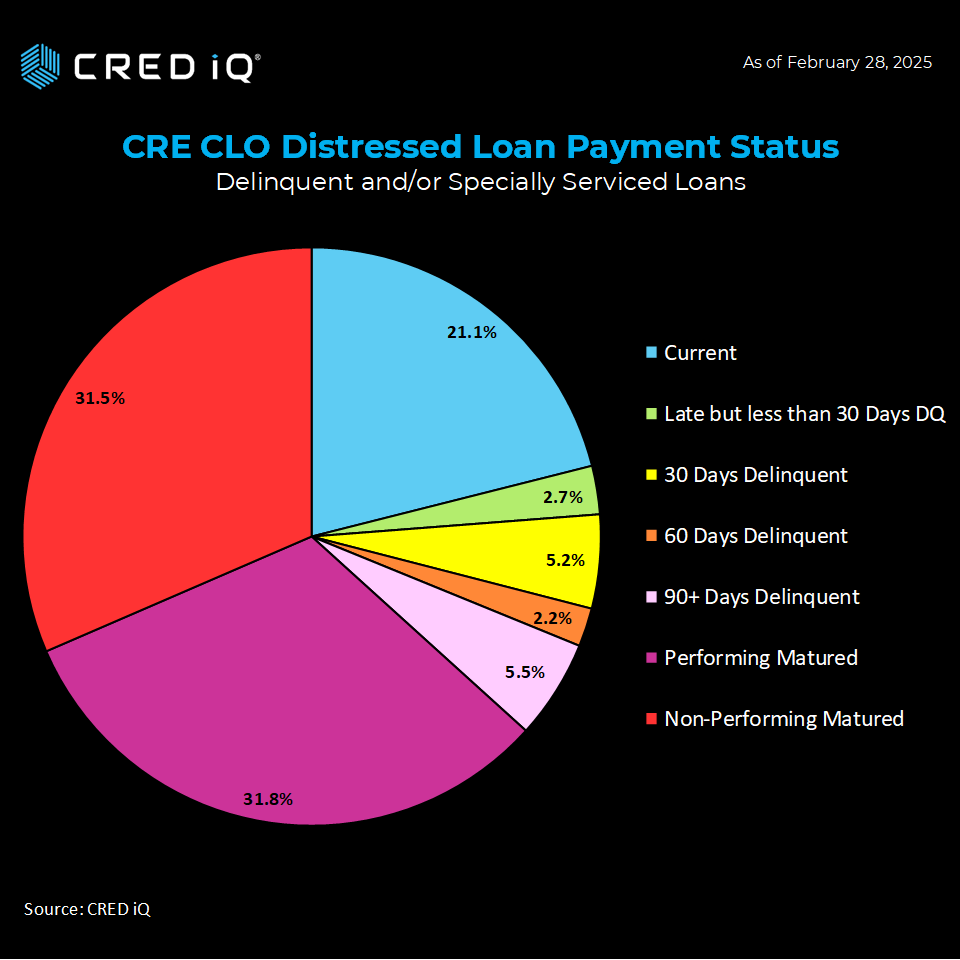
Digging deeper into payment statuses across approximately $55.6 billion in CMBS loans, we found:

  • $10.3 billion (18.5%) are current,
  • $14.0 billion (25.2%) are delinquent (including those within grace periods),
  • $31.3 billion (56.2%) have passed their maturity date, with 20.0% performing and 36.3% non-performing.

These figures are largely unchanged from March, suggesting a steady—if uneven—state of payment performance across the portfolio.

Our Methodology

CRED iQ’s distress rate is a comprehensive measure that combines delinquency (30+ days past due) and special servicing activity, encompassing both performing and non-performing loans that fail to pay off at maturity. Our analysis focuses on CMBS properties securitized in conduits and single-borrower large loan structures, while we track Freddie Mac, Fannie Mae, Ginnie Mae, and CRE CLO metrics separately for a holistic view of the market.

What’s Next?

The second consecutive decline in our overall distress rate is a cautiously optimistic signal for the CRE sector. Retail’s impressive turnaround offers a glimmer of hope, though hotel’s rising distress reminds us that recovery is far from uniform. As we move forward, CRED iQ remains dedicated to providing actionable insights to help our clients navigate this dynamic landscape.

Stay tuned for our next update, and feel free to reach out to our team for a deeper dive into the data shaping today’s CRE market.

About CRED iQ

CRED iQ is a market data provider that offers a robust suite of data and software solutions tailored for commercial real estate and finance professionals.

With over $2.3 trillion of CRE loans, CRED iQ delivers instant access to a comprehensive range of financial data and analytics for millions of properties in every market. CRED iQ’s data and analytical capabilities are instrumental in helping investors, lenders and brokers make informed and strategic decisions critical to their business.

THE DATA, INFORMATION AND/OR RELATED MATERAL (“DELIVERABLES”) IS BEING OFFERED AS-IS/WHERE-AS CONDITION. CRED-IQ MAKES NO REPRESENTATION OR WARRANTY AS TO QUALITY OR ACCURACY OF SUCH DELIVERABLES BEING PURCHASED, WHETHER EXPRESS OR IMPLIED, EITHER IN FACT OR BY OPERATION OF LAW, STATUTE, OR OTHERWISE, AND CRED-IQ SPECIFICALLY DISCLAIMS ANY AND ALL IMPLIED OR STATUTORY WARRANTIES INCLUDING WARRANTIES OF MERCHANTABILITY AND OF FITNESS FOR A PARTICULAR PURPOSE, TECHNICAL PERFORMANCE, AND NON-INFRINGEMENT. WITHOUT LIMITING THE FOREGOING, YOU AS CUSTOMER ACKNOWLEDGE THAT YOU HAVE NOT AND ARE NOT RELYING UPON ANY IMPLIED WARRANTY OF MERCHANTABILITY OR OF FITNESS FOR A PARTICULAR PURPOSE OR OTHERWISE, OR UPON ANY REPRESENTATION OR WARRANTY WHATSOEVER AS TO THE DELIVERABLES  IN ANY REGARDS WHATSOEVER, AND ACKNOWLEDGE  THAT CRED-IQ MAKES NO, AND HEREBY DISCLAIMS ANY, REPRESENTATION, WARRANTY OR GUARANTEE THAT THE PURCHASE, USE OR COMMERCIALIZATION OF ANY DELIVERABLES WILL BE USEFUL TO YOU OR FREE FROM INTERFERENCE. BY ACCEPTANCE OF THE DELIVERABLES, YOU HEREBY RELEASE CRED-IQ AND ITS AFFILIATES AND AGENTS FROM ALL CLAIMS, DAMAGES AND LIABILITY ARISING HEREUNDER.

Announcing BANK5 2025-5YR14

0

A CRED iQ Preliminary Analysis

Deal Overview

The BANK5 2025-5YR14 CMBS deal is a new issuance securitization for the CMBS market, with a total pooled balance of $884.4 million. The deal is jointly managed by prominent financial institutions including Wells Fargo, Bank of America, JP Morgan, and Morgan Stanley. The deal is collateralized by 25 loans and secured by 72 properties across a variety of sectors, including office, retail, and multifamily. The strategic geographic distribution of these properties ensures balanced exposure across major markets. The deal’s weighted average loan-to-value (LTV) ratio of 61.1%, and the weighted average mortgage interest rate is 6.55%.

Key Metrics

The loan pool for BANK5 2025-5YR14 is structured to include a mix of amortizing and interest-only loans, with 13.1% of the mortgage pool having scheduled amortization. The remainder of the pool (86.9%) consists of interest-only payments throughout the loan term, offering investors a steady income stream. The pool boasts a weighted average debt service coverage ratio (DSCR) of 1.62. The weighted average net operating income (NOI) debt yield is 11.6%.

Geography & Property Types

A key strength of the BANK5 2025-5YR14 CMBS deal is its diverse property type distribution, which enhances portfolio resilience. Office properties constitute 24.2% of the total balance, while retail properties account for 20.4% of the balance. The geographic distribution of the properties across prime markets, including high-growth areas in New York City, Chicago, and Washington, DC.

About CRED iQ

CRED iQ is a market data provider that offers a robust suite of data and software solutions tailored for commercial real estate and finance professionals.

With over $2.3 trillion of CRE loans, CRED iQ delivers instant access to a comprehensive range of financial data and analytics for millions of properties in every market. CRED iQ’s data and analytical capabilities are instrumental in helping investors, lenders and brokers make informed and strategic decisions critical to their business.

THE DATA, INFORMATION AND/OR RELATED MATERAL (“DELIVERABLES”) IS BEING OFFERED AS-IS/WHERE-AS CONDITION. CRED-IQ MAKES NO REPRESENTATION OR WARRANTY AS TO QUALITY OR ACCURACY OF SUCH DELIVERABLES BEING PURCHASED, WHETHER EXPRESS OR IMPLIED, EITHER IN FACT OR BY OPERATION OF LAW, STATUTE, OR OTHERWISE, AND CRED-IQ SPECIFICALLY DISCLAIMS ANY AND ALL IMPLIED OR STATUTORY WARRANTIES INCLUDING WARRANTIES OF MERCHANTABILITY AND OF FITNESS FOR A PARTICULAR PURPOSE, TECHNICAL PERFORMANCE, AND NON-INFRINGEMENT. WITHOUT LIMITING THE FOREGOING, YOU AS CUSTOMER ACKNOWLEDGE THAT YOU HAVE NOT AND ARE NOT RELYING UPON ANY IMPLIED WARRANTY OF MERCHANTABILITY OR OF FITNESS FOR A PARTICULAR PURPOSE OR OTHERWISE, OR UPON ANY REPRESENTATION OR WARRANTY WHATSOEVER AS TO THE DELIVERABLES  IN ANY REGARDS WHATSOEVER, AND ACKNOWLEDGE  THAT CRED-IQ MAKES NO, AND HEREBY DISCLAIMS ANY, REPRESENTATION, WARRANTY OR GUARANTEE THAT THE PURCHASE, USE OR COMMERCIALIZATION OF ANY DELIVERABLES WILL BE USEFUL TO YOU OR FREE FROM INTERFERENCE. BY ACCEPTANCE OF THE DELIVERABLES, YOU HEREBY RELEASE CRED-IQ AND ITS AFFILIATES AND AGENTS FROM ALL CLAIMS, DAMAGES AND LIABILITY ARISING HEREUNDER.

Apartment Loan Delinquencies Surge 39% in Q4 2024: A Deep Dive into the Numbers

0

Hey, real estate enthusiasts! The CRED iQ Research team here, back with a fresh look at the multifamily loan landscape. This week, we’ve zoomed in on the latest trends shaking up the apartment sector, building on the community bank data from our 2025 Almanac. Buckle up—because the numbers are telling a story of rising delinquencies, slowing growth, and some eye-popping loan loss figures for 2024.

Delinquency Dollars Pile Up: $2.38 Billion in Q4 Alone

Let’s start with the headline: multifamily loan delinquencies at community banks jumped 39% from Q3 to Q4 2024, ballooning by $2.38 billion in newly delinquent loans. That brings the total delinquent balance to a hefty $8.49 billion by year-end. For context, this figure was just $6.11 billion in Q3 2024 and a modest $1.98 billion back in Q2 2023. That’s right—delinquencies have been climbing steadily since mid-2023, but 2024 turned up the heat with bigger quarter-over-quarter spikes.

Breaking it down, the year started slow with a $234.8 million uptick in Q1 (compared to Q4 2023). Then things accelerated: Q2 added $1.90 billion, Q3 tacked on $545.6 million, and Q4 slammed the door with that massive $2.4 billion increase. By the time the calendar flipped to 2025, the delinquency rate for multifamily loans hit 1.35%—a sharp rise from 0.56% a year earlier. Q1 2025 data isn’t out yet, but the trend lines suggest this percentage isn’t slowing down anytime soon.

Growth Slows, Balances Still Climb

Over the past decade, multifamily loan balances held by community banks have swelled at a solid 7.9% average annual growth rate—from $297.4 billion in 2014 to $628.9 billion in 2024. That’s a lot of apartments! But here’s the twist: growth has hit the brakes since 2023, dropping to just 2.2% that year and ticking up slightly to 2.8% in 2024. So, while the total loan pie keeps expanding, it’s growing at a much slower pace than before—meanwhile, those delinquency cracks are widening.

Losses Sting: Realized Hits Double in 2024

If rising delinquencies weren’t enough, realized loan losses are adding salt to the wound. In 2023, community banks took a $305.8 million hit—a jaw-dropping 411% leap over 2022. Fast forward to 2024, and losses more than doubled to $691.8 million, up 126% from the year prior. That’s not just a blip—it’s a signal that the multifamily sector is feeling some serious pressure.

Why It Matters

So, what’s driving this? We dug into FDIC-insured multifamily loan data to understand how community banks—key players in this ecosystem—are exposed. The uptick in delinquencies and losses points to broader challenges: rising interest rates, softening rents, or maybe even over-leveraged borrowers. Whatever the culprits, the numbers don’t lie—this is a trend worth watching.

Stay tuned as we keep our finger on the pulse of the multifamily market. Got questions or want us to dig deeper? Drop us a line—we’re here to crunch the data and cut through the noise!

About CRED iQ

CRED iQ is a market data provider that offers a robust suite of data and software solutions tailored for commercial real estate and finance professionals.

With over $2.3 trillion of CRE loans, CRED iQ delivers instant access to a comprehensive range of financial data and analytics for millions of properties in every market. CRED iQ’s data and analytical capabilities are instrumental in helping investors, lenders and brokers make informed and strategic decisions critical to their business.

Distress Rates are High in These Markets (GlobeSt)

0
This image has an empty alt attribute; its file name is Blog-Featured-Images-4-1024x1024.png

CRED iQ in the News – March 26, 2025

Article Snapshot:

Despite signs of improvement in commercial real estate markets, including the office sector, distress remains prevalent in many metropolitan areas. CRED iQ analyzed the top 50 metropolitan statistical areas, focusing on the loans they track to determine the proportion of distressed loans. The distress rate is defined as the combined percentage of delinquent and specially serviced loans.

Top 50 Markets by CRED iQ Distress Metrics

0

CRED iQ’s research team explored geographic distress trends across the United States in our latest research.  We ran our analysis based upon current loan balances of all of the loans CRED iQ tracks within each market and then calculated the proportion of loans that are distressed.

Across the top 50 MSAs, our team calculated the CRED iQ Distress Rate for each market (which combines delinquent and/or specially serviced loans). 

Minneapolis logged the highest level of distress with 49.7% of their loans in distress, followed by Providence (45.4%), Rochester (35.7%), Portland-Vancouver-Beaverton(32.9%) and Chicago (28.9%) – rounding out the top 5 MSAs with the highest levels of distress.  To provide perspective, the overall distress rate for all loans across every market was 10.8% as of February.

Some of the strongest performing MSAs in the top 50 include San Juan and Salt Lake City (0% distress today), while San Diego, Columbus, Sacramento, Jacksonville, Las Vegas and Kansas City all operating under 3%. 

Loan Highlight

The $1.28 billion Workspace loan is backed by a 147-property portfolio consisting of mostly office and flex space throughout the country. Minneapolis is one of the top 5 markets of the portfolio, backing 13.0% ($166.4 million) of the mortgage loan. There are 19 total properties in Minneapolis, including 13 offices and 6 flex properties.

The loan transferred to the special servicer due to imminent monetary default as the loan has a July 2025 maturity date. The loan was late but less than 30 days delinquent as of the February 2025 remittance period. The portfolio is divided into two components; component A (20.3% of total mortgage balance) had 3, one-year extension options at underwriting, while component B (79.7%) doesn’t have any extension options.  

Early Warning Signals

CRED iQ’s early signals of upcoming distress include loans that have been added to the servicer’s watchlist for credit-related issues.  Issues include weak financial performance, low occupancy, high tenant rollover, upcoming maturity risk among other reasons to be flagged as possible troubles.

About CRED iQ

CRED iQ is a market data provider that offers a robust suite of data and software solutions tailored for commercial real estate and finance professionals.

With over $2.3 trillion of CRE loans, CRED iQ delivers instant access to a comprehensive range of financial data and analytics for millions of properties in every market. CRED iQ’s data and analytical capabilities are instrumental in helping investors, lenders and brokers make informed and strategic decisions critical to their business.

Announcing BMARK 2025-V14

0

A CRED iQ Preliminary Analysis

Deal Overview

The BMARK 2025-V14 CMBS deal is a new issuance securitization for the CMBS market, with a total pooled balance of $939.2 million. The deal is jointly managed by prominent financial institutions including Deutsche Bank, Goldman Sachs, BMO, Barclays, and Citigroup. The deal is collateralized by 35 loans and secured by 61 properties across a variety of sectors, including multifamily, office, and mixed use. The strategic geographic distribution of these properties ensures balanced exposure across major markets. The deal’s weighted average loan-to-value (LTV) ratio of 59.4%, and the weighted average mortgage interest rate is 6.40%.

Key Metrics

The loan pool for BMARK 2025-V14 is structured to include a mix of amortizing and interest-only loans, with 3.3% of the mortgage pool having scheduled amortization. The remainder of the pool (96.7%) consists of interest-only payments throughout the loan term, offering investors a steady income stream. The pool boasts a weighted average debt service coverage ratio (DSCR) of 1.66. The weighted average net operating income (NOI) debt yield is 11.3%.

Geography & Property Types

A key strength of the BMARK 2025-V14 CMBS deal is its diverse property type distribution, which enhances portfolio resilience. Multifamily properties constitute 45.5% of the total balance, while retail offices account for 24.7% of the balance. The geographic distribution of the properties across prime markets, including high-growth areas in New York City, Seattle, and Boston.

About CRED iQ

CRED iQ is a market data provider that offers a robust suite of data and software solutions tailored for commercial real estate and finance professionals.

With over $2.3 trillion of CRE loans, CRED iQ delivers instant access to a comprehensive range of financial data and analytics for millions of properties in every market. CRED iQ’s data and analytical capabilities are instrumental in helping investors, lenders and brokers make informed and strategic decisions critical to their business.

THE DATA, INFORMATION AND/OR RELATED MATERAL (“DELIVERABLES”) IS BEING OFFERED AS-IS/WHERE-AS CONDITION. CRED-IQ MAKES NO REPRESENTATION OR WARRANTY AS TO QUALITY OR ACCURACY OF SUCH DELIVERABLES BEING PURCHASED, WHETHER EXPRESS OR IMPLIED, EITHER IN FACT OR BY OPERATION OF LAW, STATUTE, OR OTHERWISE, AND CRED-IQ SPECIFICALLY DISCLAIMS ANY AND ALL IMPLIED OR STATUTORY WARRANTIES INCLUDING WARRANTIES OF MERCHANTABILITY AND OF FITNESS FOR A PARTICULAR PURPOSE, TECHNICAL PERFORMANCE, AND NON-INFRINGEMENT. WITHOUT LIMITING THE FOREGOING, YOU AS CUSTOMER ACKNOWLEDGE THAT YOU HAVE NOT AND ARE NOT RELYING UPON ANY IMPLIED WARRANTY OF MERCHANTABILITY OR OF FITNESS FOR A PARTICULAR PURPOSE OR OTHERWISE, OR UPON ANY REPRESENTATION OR WARRANTY WHATSOEVER AS TO THE DELIVERABLES  IN ANY REGARDS WHATSOEVER, AND ACKNOWLEDGE  THAT CRED-IQ MAKES NO, AND HEREBY DISCLAIMS ANY, REPRESENTATION, WARRANTY OR GUARANTEE THAT THE PURCHASE, USE OR COMMERCIALIZATION OF ANY DELIVERABLES WILL BE USEFUL TO YOU OR FREE FROM INTERFERENCE. BY ACCEPTANCE OF THE DELIVERABLES, YOU HEREBY RELEASE CRED-IQ AND ITS AFFILIATES AND AGENTS FROM ALL CLAIMS, DAMAGES AND LIABILITY ARISING HEREUNDER.

Announcing BMO 2025-5C9

0

A CRED iQ Preliminary Analysis

Deal Overview

The BMO 2025-5C9 CMBS deal is a new issuance securitization for the CMBS market, with a total pooled balance of $681.7 million. The deal is jointly managed by prominent financial institutions including BMO, Goldman Sachs, Deutsche Bank, Societe Generale, UBS, and Citigroup. The deal is collateralized by 31 loans and secured by 54 properties across a variety of sectors, including hospitality, retail, and mixed use. The strategic geographic distribution of these properties ensures balanced exposure across major markets. The deal’s weighted average loan-to-value (LTV) ratio of 54.0%, and the weighted average mortgage interest rate is 6.51%.

Key Metrics

The loan pool for BMO 2025-5C9is structured to include a mix of amortizing and interest-only loans, with 2.6% of the mortgage pool having scheduled amortization. The remainder of the pool (97.4%) consists of interest-only payments throughout the loan term, offering investors a steady income stream. The pool boasts a weighted average debt service coverage ratio (DSCR) of 1.88. The weighted average net operating income (NOI) debt yield is 12.8%.

Geography & Property Types

A key strength of the BMO 2025-5C9 CMBS deal is its diverse property type distribution, which enhances portfolio resilience. Hospitality properties constitute 21.3% of the total balance, while retail properties account for 19.5% of the balance. The geographic distribution of the properties across prime markets, including high-growth areas in New York City, Fayetteville, and Chicago.

About CRED iQ

CRED iQ is a market data provider that offers a robust suite of data and software solutions tailored for commercial real estate and finance professionals.

With over $2.3 trillion of CRE loans, CRED iQ delivers instant access to a comprehensive range of financial data and analytics for millions of properties in every market. CRED iQ’s data and analytical capabilities are instrumental in helping investors, lenders and brokers make informed and strategic decisions critical to their business.

THE DATA, INFORMATION AND/OR RELATED MATERAL (“DELIVERABLES”) IS BEING OFFERED AS-IS/WHERE-AS CONDITION. CRED-IQ MAKES NO REPRESENTATION OR WARRANTY AS TO QUALITY OR ACCURACY OF SUCH DELIVERABLES BEING PURCHASED, WHETHER EXPRESS OR IMPLIED, EITHER IN FACT OR BY OPERATION OF LAW, STATUTE, OR OTHERWISE, AND CRED-IQ SPECIFICALLY DISCLAIMS ANY AND ALL IMPLIED OR STATUTORY WARRANTIES INCLUDING WARRANTIES OF MERCHANTABILITY AND OF FITNESS FOR A PARTICULAR PURPOSE, TECHNICAL PERFORMANCE, AND NON-INFRINGEMENT. WITHOUT LIMITING THE FOREGOING, YOU AS CUSTOMER ACKNOWLEDGE THAT YOU HAVE NOT AND ARE NOT RELYING UPON ANY IMPLIED WARRANTY OF MERCHANTABILITY OR OF FITNESS FOR A PARTICULAR PURPOSE OR OTHERWISE, OR UPON ANY REPRESENTATION OR WARRANTY WHATSOEVER AS TO THE DELIVERABLES  IN ANY REGARDS WHATSOEVER, AND ACKNOWLEDGE  THAT CRED-IQ MAKES NO, AND HEREBY DISCLAIMS ANY, REPRESENTATION, WARRANTY OR GUARANTEE THAT THE PURCHASE, USE OR COMMERCIALIZATION OF ANY DELIVERABLES WILL BE USEFUL TO YOU OR FREE FROM INTERFERENCE. BY ACCEPTANCE OF THE DELIVERABLES, YOU HEREBY RELEASE CRED-IQ AND ITS AFFILIATES AND AGENTS FROM ALL CLAIMS, DAMAGES AND LIABILITY ARISING HEREUNDER.

Announcing BANK 2025-BNK49

0

A CRED iQ Preliminary Analysis

Deal Overview

The BANK 2025-BNK49 CMBS deal is a new issuance securitization for the CMBS market, with a total pooled balance of $929.2 million. The deal is jointly managed by prominent financial institutions including Bank of America, Morgan Stanley, JP Morgan, Wells Fargo, and Citi Real Estate. The deal is collateralized by 37 loans and secured by 65 properties across a variety of sectors, including office, hospitality, and retail. The strategic geographic distribution of these properties ensures balanced exposure across major markets. The deal’s weighted average loan-to-value (LTV) ratio of 53.4%, and the weighted average mortgage interest rate is 6.25%.

Key Metrics

The loan pool for BANK 2025-BNK49 is structured to include a mix of amortizing and interest-only loans, with 30.9% of the mortgage pool having scheduled amortization. The remainder of the pool (69.1%) consists of interest-only payments throughout the loan term, offering investors a steady income stream. The pool boasts a weighted average debt service coverage ratio (DSCR) of 2.05. The weighted average net operating income (NOI) debt yield is 14.1%.

Geography & Property Types

A key strength of the BANK 2025-BNK49 CMBS deal is its diverse property type distribution, which enhances portfolio resilience. Office properties constitute 37.6% of the total balance, while hospitality properties account for 21.4% of the balance. The geographic distribution of the properties across prime markets, including high-growth areas in Los Angeles, New York City, and Dallas.

About CRED iQ

CRED iQ is a market data provider that offers a robust suite of data and software solutions tailored for commercial real estate and finance professionals.

With over $2.3 trillion of CRE loans, CRED iQ delivers instant access to a comprehensive range of financial data and analytics for millions of properties in every market. CRED iQ’s data and analytical capabilities are instrumental in helping investors, lenders and brokers make informed and strategic decisions critical to their business.

THE DATA, INFORMATION AND/OR RELATED MATERAL (“DELIVERABLES”) IS BEING OFFERED AS-IS/WHERE-AS CONDITION. CRED-IQ MAKES NO REPRESENTATION OR WARRANTY AS TO QUALITY OR ACCURACY OF SUCH DELIVERABLES BEING PURCHASED, WHETHER EXPRESS OR IMPLIED, EITHER IN FACT OR BY OPERATION OF LAW, STATUTE, OR OTHERWISE, AND CRED-IQ SPECIFICALLY DISCLAIMS ANY AND ALL IMPLIED OR STATUTORY WARRANTIES INCLUDING WARRANTIES OF MERCHANTABILITY AND OF FITNESS FOR A PARTICULAR PURPOSE, TECHNICAL PERFORMANCE, AND NON-INFRINGEMENT. WITHOUT LIMITING THE FOREGOING, YOU AS CUSTOMER ACKNOWLEDGE THAT YOU HAVE NOT AND ARE NOT RELYING UPON ANY IMPLIED WARRANTY OF MERCHANTABILITY OR OF FITNESS FOR A PARTICULAR PURPOSE OR OTHERWISE, OR UPON ANY REPRESENTATION OR WARRANTY WHATSOEVER AS TO THE DELIVERABLES  IN ANY REGARDS WHATSOEVER, AND ACKNOWLEDGE  THAT CRED-IQ MAKES NO, AND HEREBY DISCLAIMS ANY, REPRESENTATION, WARRANTY OR GUARANTEE THAT THE PURCHASE, USE OR COMMERCIALIZATION OF ANY DELIVERABLES WILL BE USEFUL TO YOU OR FREE FROM INTERFERENCE. BY ACCEPTANCE OF THE DELIVERABLES, YOU HEREBY RELEASE CRED-IQ AND ITS AFFILIATES AND AGENTS FROM ALL CLAIMS, DAMAGES AND LIABILITY ARISING HEREUNDER.

CRE CLO Distress Rate Reaches Record 16%

0

The sector added 90 Basis Points this month, logging a 4-month consecutive record high

The CRED iQ CRE CLO distress rate added 90 basis points in February – reaching a new high of 16%. A year ago, the distress rate was only 9.4% but has been steadily rising as these floating rate loans are failing to pay off at their maturity dates.  Underpinning the distress rate, February’s delinquency rate tacked on 44 basis points to 12.2%; similarly, the special servicing rate added 57 basis points to 9.4% in this print.

The CRED iQ distress rate includes any loan reported 30 days delinquent or worse, past their maturity, specially serviced, or a combination of these.  We also examined the most recent property-level net operating income figures and compared them to underwritten expectations.

Payment Status

Looking across payment status in February, 30.7%  of loans are performing matured (down from 33.4% in January).   32.7% of loans were non-performing matured (up from 25.6% last month). Combining these two metrics, 63.4% of the CRE CLO loans in our study are past their maturity dates, (up 436 basis points from 59.0% in last month’s report). 20.3% of the CRE CLO loans are current (up from18.8% in January) .  Combining late but less than 30 days delinquent, the percentage increases to 23.1% –up from 22.1% in our January print.

Delinquent loans that have not past their maturity date accounted for 13.5% of the CRE CLO loans — down from 18.9% in January

Analysis Scope & Methodology

CRED iQ consolidated all of the loan-level performance data for every outstanding CRE CLO loan to measure the underlying risks associated with these transitional assets. Our team examined $66.4 billion in active CRE CLO loans. Many of these loans were originated in 2021 at times where cap rates were low, valuations high, low interest rates, and are starting to run into maturity issues given the spike in rates.

Some of the largest issuers of CRE CLO debt over the past five years include MF1, Arbor, LoanCore, Benefit Street Partners, Bridge Investment Group, FS Rialto, and TPG. The vast majority of the $79.1 billion in CRE CLO loans are structured with floating rates with 3-year loan terms equipped with loan extension options if certain financial hurdles are met.

About CRED iQ

CRED iQ is a market data provider that offers a robust suite of data and software solutions tailored for commercial real estate and finance professionals.

With over $2.3 trillion of CRE loans, CRED iQ delivers instant access to a comprehensive range of financial data and analytics for millions of properties in every market. CRED iQ’s data and analytical capabilities are instrumental in helping investors, lenders and brokers make informed and strategic decisions critical to their business.

2,085FollowersFollow
6SubscribersSubscribe