
CRED iQ monitors distressed rates and market performance for nearly 400 MSAs across the United States, covering over $900 billion in outstanding commercial real estate (CRE) debt. Distressed rates (DQ + SS%) include loans that are specially serviced, delinquent, or a combination of both. Distressed rates and month-over-month changes are presented below for the 50 largest MSAs, including distressed rates that are stratified by property type/sector, resulting in a granular view of distress by market-sector.
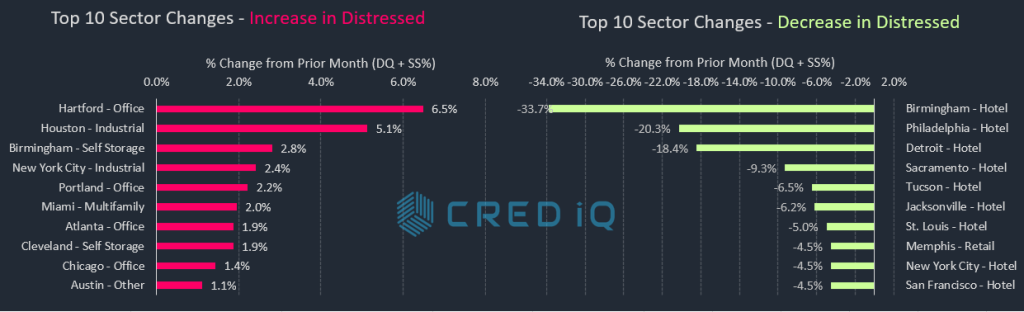
The majority of Top 50 MSAs exhibited an improvement in the overall rate of distressed commercial mortgages in April 2022. There were approximately 36 markets, or 72% of the Top 50, with month-over-month declines in the percentage of distressed CRE loans. Among the MSAs with the sharpest declines this month were Memphis and Birmingham, AL. By property type, much of the improvement was attributed to the lodging sector. Loans secured by lodging properties accounted for nine of the 10 largest declines in distress by market-sector, including Birmingham, AL, Philadelphia, and Detroit.
Conversely, the Baltimore market had the highest increase in distressed CRE loans compared to the prior month. The increase was primarily driven by a 30-day delinquency from a loan secured by Chatham Gardens Apartments, a 414-unit multifamily property located in Ellicott City, MD.
Office was the most prevalent property type among increases in distress by market-sector, accounting for four of the Top 10 increases in distress. The Hartford office market experienced the highest month-over-month increase in distress. A $25.6 million mortgage secured by the Stilts Building at 20 Church Street transferred to special servicing in March 2022. The Atlanta office market was also among the Top 10 market-sectors to show a higher month-over-month rate of distress. A major contributor to Atlanta’s office distress is a $115.3 million mortgage secured by the Peachtree Center, which transferred to special servicing ahead of its April 2022 maturity date. Peachtree Center is a seven-building office complex located in the CBD of Atlanta. Reported occupancy across the seven buildings was 61% as of September 2021. The loan’s initial maturity date was in April 2022, but the borrower has a 12-month extension option.
Distressed rates for the industrial sector exhibited notable increases in multiple markets this month due to delinquencies and transfers to special servicing. In one example, the $26.1 million FMC Technologies loan transferred to special servicing. The FMC Technologies loan was last featured in CRED iQ’s November 30, 2021 Weekly Asset Review, which detailed the implications of single tenant TechnipFMC’s lease expiration on March 31, 2022. The loan’s transfer to special servicing adversely impacted the distressed rate for Houston industrial properties. The distressed rate for industrial properties in the New York City MSA was also adversely impacted this month — the $51.2 million Supor Industrial Portfolio loan, secured by a portfolio of properties in Harrison, NJ, became 30 days delinquent in April 2022.
The Minneapolis MSA has the highest overall distressed rate at 22.3%, which was a slight decline compared to the prior month. Louisville (17.4%), New Orleans (13.3%), Milwaukee (11.0%), and Cleveland (9.5%) comprise the remaining markets with the highest rates of distress. After a one-month hiatus, the Cleveland MSA re-entered the Top 5 markets with CRE distress. The Sacramento market (0.43%) had the lowest percentage of distress among the Top 50 MSAs, supplanting the Raleigh MSA, which held the distinction previously.
For the full CRED DQ Report, download here:
| MSA – Property Type | DQ/SS (millions) | DS/SS (%) | Monthly Change |
| Allentown-Bethlehem-Easton, PA-NJ MSA | $78.3 | 2.5% | 0.0% |
| Allentown – Hotel | $0.0 | 0.0% | 0.0% |
| Allentown – Industrial | $0.0 | 0.0% | 0.0% |
| Allentown – Multifamily | $0.0 | 0.0% | 0.0% |
| Allentown – Office | $59.1 | 21.2% | 3.1% |
| Allentown – Other | $0.0 | 0.0% | 0.0% |
| Allentown – Retail | $19.2 | 5.4% | 0.2% |
| Allentown – Self Storage | $0.0 | 0.0% | 0.0% |
| Atlanta – Atlanta-Sandy Springs-Marietta, GA MSA | $651.7 | 2.5% | 0.0% |
| Atlanta – Hotel | $155.5 | 8.5% | -1.3% |
| Atlanta – Industrial | $17.9 | 3.3% | 0.1% |
| Atlanta – Multifamily | $05.7 | 0.0% | 0.0% |
| Atlanta – Office | $55.9 | 2.2% | 1.9% |
| Atlanta – Other | $0.0 | 0.0% | 0.0% |
| Atlanta – Retail | $416.7 | 15.9% | 0.6% |
| Atlanta – Self Storage | $0.0 | 0.0% | 0.0% |
| Austin – Austin-Round Rock, TX MSA | $193.1 | 2.2% | -0.2% |
| Austin – Hotel | $57.2 | 7.1% | -0.9% |
| Austin – Industrial | $0.0 | 0.0% | 0.0% |
| Austin – Multifamily | $81.2 | 1.5% | 0.4% |
| Austin – Office | $0.0 | 0.0% | 0.0% |
| Austin – Other | $04.2 | 1.1% | 1.1% |
| Austin – Retail | $50.6 | 5.8% | -3.5% |
| Austin – Self Storage | $0.0 | 0.0% | 0.0% |
| Baltimore – Baltimore-Towson, MD MSA | $465.5 | 5.0% | 0.6% |
| Baltimore – Hotel | $71.8 | 16.1% | -3.1% |
| Baltimore – Industrial | $0.0 | 0.0% | 0.0% |
| Baltimore – Multifamily | $72.1 | 1.1% | 1.0% |
| Baltimore – Office | $58.1 | 9.1% | 0.0% |
| Baltimore – Other | $11.7 | 3.2% | 0.0% |
| Baltimore – Retail | $251.7 | 22.6% | 0.4% |
| Baltimore – Self Storage | $0.0 | 0.0% | 0.0% |
| Birmingham – Birmingham-Hoover, AL MSA | $131.2 | 4.8% | -1.7% |
| Birmingham – Hotel | $11.3 | 11.1% | -33.7% |
| Birmingham – Industrial | $0.0 | 0.0% | 0.0% |
| Birmingham – Multifamily | $0.0 | 0.0% | -0.1% |
| Birmingham – Office | $96.2 | 19.0% | 0.0% |
| Birmingham – Other | $0.0 | 0.0% | 0.0% |
| Birmingham – Retail | $22.7 | 3.1% | 0.1% |
| Birmingham – Self Storage | $0.9 | 2.8% | 2.8% |
| Boston – Boston-Cambridge-Quincy, MA-NH MSA | $120.3 | 0.7% | -0.1% |
| Boston – Hotel | $28.9 | 4.3% | -2.1% |
| Boston – Industrial | $0.0 | 0.0% | 0.0% |
| Boston – Multifamily | $0.0 | 0.0% | 0.0% |
| Boston – Office | $0.0 | 0.0% | 0.0% |
| Boston – Other | $0.0 | 0.0% | 0.0% |
| Boston – Retail | $91.4 | 6.4% | 1.6% |
| Boston – Self Storage | $0.0 | 0.0% | 0.0% |
| Bridgeport – Bridgeport-Stamford-Norwalk, CT MSA | $200.9 | 5.2% | -0.1% |
| Bridgeport – Hotel | $62.4 | 52.9% | 2.0% |
| Bridgeport – Industrial | $17.8 | 15.0% | 0.0% |
| Bridgeport – Multifamily | $0.9 | 0.1% | 0.0% |
| Bridgeport – Office | $103.5 | 8.8% | -0.6% |
| Bridgeport – Other | $09.8 | 2.4% | 0.0% |
| Bridgeport – Retail | $06.4 | 2.0% | 0.0% |
| Bridgeport – Self Storage | $0.0 | 0.0% | 0.0% |
| Charlotte – Charlotte-Gastonia-Concord, NC-SC MSA | $293.5 | 3.6% | 0.0% |
| Charlotte – Hotel | $87.2 | 7.7% | 0.2% |
| Charlotte – Industrial | $0.0 | 0.0% | 0.0% |
| Charlotte – Multifamily | $0.7 | 0.0% | 0.0% |
| Charlotte – Office | $21.3 | 2.3% | 0.0% |
| Charlotte – Other | $85.0 | 25.1% | -1.8% |
| Charlotte – Retail | $99.3 | 8.5% | 0.7% |
| Charlotte – Self Storage | $0.0 | 0.0% | 0.0% |
| Chicago – Chicago-Naperville-Joliet, IL-IN-WI MSA | $2,547.9 | 8.9% | 0.1% |
| Chicago – Hotel | $835.6 | 40.6% | -0.9% |
| Chicago – Industrial | $03.8 | 0.1% | -0.1% |
| Chicago – Multifamily | $185.3 | 1.9% | 1.1% |
| Chicago – Office | $894.2 | 11.4% | 1.4% |
| Chicago – Other | $244.9 | 12.6% | -0.4% |
| Chicago – Retail | $384.1 | 11.4% | 0.2% |
| Chicago – Self Storage | $0.0 | 0.0% | 0.0% |
| Cincinnati – Cincinnati-Middletown, OH-KY-IN MSA | $241.8 | 6.2% | -0.3% |
| Cincinnati – Hotel | $100.5 | 35.1% | -2.7% |
| Cincinnati – Industrial | $0.0 | 0.0% | 0.0% |
| Cincinnati – Multifamily | $0.0 | 0.0% | 0.0% |
| Cincinnati – Office | $0.0 | 0.0% | 0.0% |
| Cincinnati – Other | $06.9 | 2.5% | 0.0% |
| Cincinnati – Retail | $134.4 | 20.0% | 0.8% |
| Cincinnati – Self Storage | $0.0 | 0.0% | 0.0% |
| Cleveland – Cleveland-Elyria-Mentor, OH MSA | $379.5 | 9.5% | -0.1% |
| Cleveland – Hotel | $77.5 | 41.1% | 1.5% |
| Cleveland – Industrial | $0.0 | 0.0% | 0.0% |
| Cleveland – Multifamily | $0.0 | 0.0% | 0.0% |
| Cleveland – Office | $103.9 | 13.3% | 0.5% |
| Cleveland – Other | $175.6 | 43.1% | 0.0% |
| Cleveland – Retail | $21.7 | 3.0% | 0.0% |
| Cleveland – Self Storage | $0.8 | 1.9% | 1.9% |
| Columbus, OH – Columbus, OH MSA | $248.2 | 3.7% | 0.2% |
| Columbus, OH – Hotel | $83.2 | 29.8% | 2.4% |
| Columbus, OH – Industrial | $11.8 | 3.6% | 0.4% |
| Columbus, OH – Multifamily | $20.0 | 0.4% | 0.4% |
| Columbus, OH – Office | $12.3 | 2.1% | 0.0% |
| Columbus, OH – Other | $0.0 | 0.0% | 0.0% |
| Columbus, OH – Retail | $120.9 | 15.6% | 0.7% |
| Columbus, OH – Self Storage | $0.0 | 0.0% | 0.0% |
| Dallas – Dallas-Fort Worth-Arlington, TX MSA | $399.5 | 1.2% | -0.4% |
| Dallas – Hotel | $124.6 | 3.6% | -2.5% |
| Dallas – Industrial | $01.7 | 0.1% | 0.0% |
| Dallas – Multifamily | $12.9 | 0.1% | 0.0% |
| Dallas – Office | $102.4 | 2.9% | 0.1% |
| Dallas – Other | $23.5 | 1.1% | 0.0% |
| Dallas – Retail | $134.3 | 5.7% | -0.9% |
| Dallas – Self Storage | $0.0 | 0.0% | 0.0% |
| Denver – Denver-Aurora, CO MSA | $324.5 | 2.0% | -0.2% |
| Denver – Hotel | $24.3 | 3.1% | -1.1% |
| Denver – Industrial | $0.0 | 0.0% | 0.0% |
| Denver – Multifamily | $0.0 | 0.0% | 0.0% |
| Denver – Office | $182.7 | 9.6% | 0.2% |
| Denver – Other | $66.5 | 7.0% | 0.0% |
| Denver – Retail | $51.0 | 3.4% | -1.3% |
| Denver – Self Storage | $0.0 | 0.0% | 0.0% |
| Detroit – Detroit-Warren-Livonia, MI MSA | $293.9 | 3.3% | -1.3% |
| Detroit – Hotel | $81.4 | 11.8% | -18.4% |
| Detroit – Industrial | $18.3 | 3.5% | 0.1% |
| Detroit – Multifamily | $27.3 | 0.8% | 0.7% |
| Detroit – Office | $0.0 | 0.0% | 0.0% |
| Detroit – Other | $22.1 | 3.6% | 0.0% |
| Detroit – Retail | $144.8 | 9.0% | -0.2% |
| Detroit – Self Storage | $0.0 | 0.0% | 0.0% |
| Hartford – Hartford-West Hartford-East Hartford, CT MSA | $205.5 | 8.2% | 0.5% |
| Hartford – Hotel | $62.3 | 51.7% | -3.4% |
| Hartford – Industrial | $0.0 | 0.0% | 0.0% |
| Hartford – Multifamily | $0.0 | 0.0% | 0.0% |
| Hartford – Office | $113.2 | 28.6% | 6.5% |
| Hartford – Other | $0.0 | 0.0% | 0.0% |
| Hartford – Retail | $30.0 | 12.9% | 0.2% |
| Hartford – Self Storage | $0.0 | 0.0% | 0.0% |
| Houston – Houston-Sugar Land-Baytown, TX MSA | $1,174.6 | 4.9% | 0.1% |
| Houston – Hotel | $580.8 | 49.8% | 0.6% |
| Houston – Industrial | $30.3 | 6.0% | 5.1% |
| Houston – Multifamily | $28.9 | 0.2% | 0.0% |
| Houston – Office | $433.0 | 10.8% | 0.2% |
| Houston – Other | $0.0 | 0.0% | 0.0% |
| Houston – Retail | $101.7 | 2.6% | 0.0% |
| Houston – Self Storage | $0.0 | 0.0% | 0.0% |
| Indianapolis – Indianapolis-Carmel, IN MSA | $238.6 | 4.5% | -0.1% |
| Indianapolis – Hotel | $81.5 | 13.4% | 0.0% |
| Indianapolis – Industrial | $0.0 | 0.0% | 0.0% |
| Indianapolis – Multifamily | $32.0 | 1.2% | -0.1% |
| Indianapolis – Office | $75.0 | 12.3% | 0.0% |
| Indianapolis – Other | $09.7 | 2.8% | -0.1% |
| Indianapolis – Retail | $37.7 | 8.6% | 1.2% |
| Indianapolis – Self Storage | $02.6 | 3.8% | 0.2% |
| Jacksonville – Jacksonville, FL MSA | $24.4 | 0.5% | -0.6% |
| Jacksonville – Hotel | $14.0 | 3.6% | -6.2% |
| Jacksonville – Industrial | $0.0 | 0.0% | 0.0% |
| Jacksonville – Multifamily | $01.5 | 0.0% | 0.0% |
| Jacksonville – Office | $04.2 | 0.9% | 0.0% |
| Jacksonville – Other | $0.0 | 0.0% | 0.0% |
| Jacksonville – Retail | $04.8 | 1.1% | -1.5% |
| Jacksonville – Self Storage | $0.0 | 0.0% | 0.0% |
| Kansas City – Kansas City, MO-KS MSA | $141.8 | 2.7% | -0.2% |
| Kansas City – Hotel | $81.1 | 27.9% | -1.1% |
| Kansas City – Industrial | $0.0 | 0.0% | 0.0% |
| Kansas City – Multifamily | $07.5 | 0.3% | 0.0% |
| Kansas City – Office | $0.0 | 0.0% | 0.0% |
| Kansas City – Other | $0.0 | 0.0% | 0.0% |
| Kansas City – Retail | $53.2 | 7.6% | 0.1% |
| Kansas City – Self Storage | $0.0 | 0.0% | 0.0% |
| Las Vegas – Las Vegas-Paradise, NV MSA | $318.4 | 1.6% | -0.2% |
| Las Vegas – Hotel | $0.0 | 0.0% | -0.4% |
| Las Vegas – Industrial | $0.0 | 0.0% | 0.0% |
| Las Vegas – Multifamily | $0.0 | 0.0% | 0.0% |
| Las Vegas – Office | $21.8 | 3.2% | 0.0% |
| Las Vegas – Other | $0.0 | 0.0% | 0.0% |
| Las Vegas – Retail | $296.6 | 6.3% | 0.0% |
| Las Vegas – Self Storage | $0.0 | 0.0% | 0.0% |
| Los Angeles – Los Angeles-Long Beach-Santa Ana, CA MSA | $891.8 | 1.8% | -0.4% |
| Los Angeles – Hotel | $372.5 | 8.5% | -3.2% |
| Los Angeles – Industrial | $02.0 | 0.2% | 0.0% |
| Los Angeles – Multifamily | $43.7 | 0.2% | 0.0% |
| Los Angeles – Office | $11.9 | 0.1% | -0.5% |
| Los Angeles – Other | $107.8 | 3.5% | 0.0% |
| Los Angeles – Retail | $353.9 | 5.4% | 0.3% |
| Los Angeles – Self Storage | $0.0 | 0.0% | 0.0% |
| Louisville – Louisville/Jefferson County, KY-IN MSA | $539.3 | 17.4% | -0.3% |
| Louisville – Hotel | $234.4 | 56.0% | -0.1% |
| Louisville – Industrial | $0.0 | 0.0% | 0.0% |
| Louisville – Multifamily | $03.7 | 0.3% | 0.0% |
| Louisville – Office | $0.0 | 0.0% | 0.0% |
| Louisville – Other | $0.0 | 0.0% | 0.0% |
| Louisville – Retail | $301.2 | 47.3% | 0.0% |
| Louisville – Self Storage | $0.0 | 0.0% | 0.0% |
| Memphis – Memphis, TN-AR-MS MSA | $83.9 | 3.5% | -2.0% |
| Memphis – Hotel | $24.4 | 14.0% | -3.5% |
| Memphis – Industrial | $0.0 | 0.0% | 0.0% |
| Memphis – Multifamily | $0.0 | 0.0% | -1.6% |
| Memphis – Office | $0.0 | 0.0% | 0.0% |
| Memphis – Other | $18.4 | 29.4% | 0.0% |
| Memphis – Retail | $41.1 | 11.6% | -4.5% |
| Memphis – Self Storage | $0.0 | 0.0% | 0.0% |
| Miami – Miami-Fort Lauderdale-Pompano Beach, FL MSA | $658.0 | 2.8% | 0.0% |
| Miami – Hotel | $91.3 | 2.0% | -3.2% |
| Miami – Industrial | $0.0 | 0.0% | 0.0% |
| Miami – Multifamily | $179.6 | 2.0% | 2.0% |
| Miami – Office | $07.5 | 0.4% | -0.4% |
| Miami – Other | $08.6 | 0.5% | 0.0% |
| Miami – Retail | $371.0 | 6.8% | 0.2% |
| Miami – Self Storage | $0.0 | 0.0% | 0.0% |
| Milwaukee – Milwaukee-Waukesha-West Allis, WI MSA | $274.8 | 11.0% | -0.3% |
| Milwaukee – Hotel | $35.3 | 23.7% | 0.0% |
| Milwaukee – Industrial | $0.0 | 0.0% | 0.0% |
| Milwaukee – Multifamily | $0.0 | 0.0% | 0.0% |
| Milwaukee – Office | $88.6 | 17.0% | -1.2% |
| Milwaukee – Other | $0.0 | 0.0% | 0.0% |
| Milwaukee – Retail | $150.9 | 29.1% | 0.2% |
| Milwaukee – Self Storage | $0.0 | 0.0% | 0.0% |
| Minneapolis – Minneapolis-St. Paul-Bloomington, MN-WI MSA | $1,869.2 | 22.2% | -0.8% |
| Minneapolis – Hotel | $285.8 | 48.3% | -2.6% |
| Minneapolis – Industrial | $0.0 | 0.0% | 0.0% |
| Minneapolis – Multifamily | $0.0 | 0.0% | 0.0% |
| Minneapolis – Office | $140.1 | 6.9% | 0.0% |
| Minneapolis – Other | $11.6 | 2.8% | 0.0% |
| Minneapolis – Retail | $1,431.7 | 74.1% | 0.4% |
| Minneapolis – Self Storage | $0.0 | 0.0% | 0.0% |
| Nashville – Nashville-Davidson-Murfreesboro-Franklin, TN MSA | $136.6 | 2.2% | -0.2% |
| Nashville – Hotel | $133.5 | 10.0% | 0.7% |
| Nashville – Industrial | $0.0 | 0.0% | 0.0% |
| Nashville – Multifamily | $0.0 | 0.0% | 0.0% |
| Nashville – Office | $0.0 | 0.0% | 0.0% |
| Nashville – Other | $0.0 | 0.0% | 0.0% |
| Nashville – Retail | $03.1 | 0.4% | -0.8% |
| Nashville – Self Storage | $0.0 | 0.0% | 0.0% |
| New Orleans – New Orleans-Metairie-Kenner, LA MSA | $466.1 | 13.3% | -0.1% |
| New Orleans – Hotel | $388.2 | 37.0% | 0.5% |
| New Orleans – Industrial | $0.0 | 0.0% | 0.0% |
| New Orleans – Multifamily | $13.2 | 1.5% | -0.1% |
| New Orleans – Office | $27.4 | 5.1% | 0.0% |
| New Orleans – Other | $14.9 | 7.7% | 0.0% |
| New Orleans – Retail | $22.4 | 3.1% | 0.0% |
| New Orleans – Self Storage | $0.0 | 0.0% | 0.0% |
| New York City – New York-Northern New Jersey-Long Island, NY-NJ-PA MSA | $5,899.7 | 4.8% | 0.0% |
| New York City – Hotel | $1,355.2 | 38.0% | -4.5% |
| New York City – Industrial | $58.7 | 3.2% | 2.4% |
| New York City – Multifamily | $430.9 | 1.2% | -0.2% |
| New York City – Office | $1,489.2 | 3.4% | 0.9% |
| New York City – Other | $1,248.2 | 5.4% | -0.6% |
| New York City – Retail | $1,317.7 | 9.6% | 0.2% |
| New York City – Self Storage | $0.0 | 0.0% | 0.0% |
| Orlando – Orlando-Kissimmee, FL MSA | $195.1 | 1.9% | 0.1% |
| Orlando – Hotel | $106.2 | 3.7% | 0.3% |
| Orlando – Industrial | $0.0 | 0.0% | 0.0% |
| Orlando – Multifamily | $01.9 | 0.0% | 0.0% |
| Orlando – Office | $47.0 | 10.1% | 0.4% |
| Orlando – Other | $0.0 | 0.0% | 0.0% |
| Orlando – Retail | $40.0 | 5.0% | 0.2% |
| Orlando – Self Storage | $0.0 | 0.0% | 0.0% |
| Philadelphia – Philadelphia-Camden-Wilmington, PA-NJ-DE-MD MSA | $581.6 | 2.8% | -1.2% |
| Philadelphia – Hotel | $95.2 | 10.6% | -20.3% |
| Philadelphia – Industrial | $0.0 | 0.0% | 0.0% |
| Philadelphia – Multifamily | $93.5 | 1.0% | 0.0% |
| Philadelphia – Office | $132.1 | 3.4% | 0.7% |
| Philadelphia – Other | $47.5 | 3.6% | 0.1% |
| Philadelphia – Retail | $213.3 | 8.6% | -0.1% |
| Philadelphia – Self Storage | $0.0 | 0.0% | 0.0% |
| Phoenix – Phoenix-Mesa-Scottsdale, AZ MSA | $196.2 | 1.1% | -0.3% |
| Phoenix – Hotel | $16.1 | 1.0% | -1.2% |
| Phoenix – Industrial | $10.1 | 2.1% | -1.5% |
| Phoenix – Multifamily | $0.0 | 0.0% | 0.0% |
| Phoenix – Office | $23.7 | 1.0% | -0.1% |
| Phoenix – Other | $0.0 | 0.0% | -1.8% |
| Phoenix – Retail | $146.3 | 6.4% | -0.5% |
| Phoenix – Self Storage | $0.0 | 0.0% | 0.0% |
| Pittsburgh – Pittsburgh, PA MSA | $55.8 | 1.1% | 0.0% |
| Pittsburgh – Hotel | $24.9 | 12.0% | 0.6% |
| Pittsburgh – Industrial | $0.0 | 0.0% | 0.0% |
| Pittsburgh – Multifamily | $0.0 | 0.0% | 0.0% |
| Pittsburgh – Office | $15.2 | 1.4% | 0.0% |
| Pittsburgh – Other | $08.0 | 2.2% | 0.1% |
| Pittsburgh – Retail | $07.8 | 1.1% | 0.0% |
| Pittsburgh – Self Storage | $0.0 | 0.0% | 0.0% |
| Portland – Portland-Vancouver-Beaverton, OR-WA MSA | $504.2 | 7.3% | -0.1% |
| Portland – Hotel | $470.7 | 54.5% | 0.0% |
| Portland – Industrial | $0.0 | 0.0% | 0.0% |
| Portland – Multifamily | $12.8 | 0.3% | 0.1% |
| Portland – Office | $20.7 | 5.8% | 2.2% |
| Portland – Other | $0.0 | 0.0% | 0.0% |
| Portland – Retail | $0.0 | 0.0% | 0.0% |
| Portland – Self Storage | $0.0 | 0.0% | 0.0% |
| Raleigh – Raleigh-Cary, NC MSA | $19.5 | 0.5% | 0.2% |
| Raleigh – Hotel | $09.5 | 3.2% | -0.2% |
| Raleigh – Industrial | $0.0 | 0.0% | 0.0% |
| Raleigh – Multifamily | $10.0 | 0.4% | 0.4% |
| Raleigh – Office | $0.0 | 0.0% | 0.0% |
| Raleigh – Other | $0.0 | 0.0% | 0.0% |
| Raleigh – Retail | $0.0 | 0.0% | -0.5% |
| Raleigh – Self Storage | $0.0 | 0.0% | 0.0% |
| Richmond – Richmond, VA MSA | $82.0 | 2.4% | -0.1% |
| Richmond – Hotel | $0.0 | 0.0% | 0.0% |
| Richmond – Industrial | $0.0 | 0.0% | 0.0% |
| Richmond – Multifamily | $0.0 | 0.0% | 0.0% |
| Richmond – Office | $0.0 | 0.0% | 0.0% |
| Richmond – Other | $0.0 | 0.0% | 0.0% |
| Richmond – Retail | $82.0 | 14.9% | 0.3% |
| Richmond – Self Storage | $0.0 | 0.0% | 0.0% |
| Riverside – Riverside-San Bernardino-Ontario, CA MSA | $274.0 | 3.1% | -0.2% |
| Riverside – Hotel | $64.8 | 23.1% | -2.7% |
| Riverside – Industrial | $0.0 | 0.0% | 0.0% |
| Riverside – Multifamily | $08.1 | 0.2% | 0.0% |
| Riverside – Office | $0.0 | 0.0% | 0.0% |
| Riverside – Other | $0.0 | 0.0% | 0.0% |
| Riverside – Retail | $201.0 | 9.7% | -0.7% |
| Riverside – Self Storage | $0.0 | 0.0% | 0.0% |
| Sacramento – Sacramento-Arden-Arcade-Roseville, CA MSA | $25.4 | 0.4% | -0.6% |
| Sacramento – Hotel | $05.7 | 1.6% | -9.3% |
| Sacramento – Industrial | $0.0 | 0.0% | 0.0% |
| Sacramento – Multifamily | $0.0 | 0.0% | 0.0% |
| Sacramento – Office | $06.1 | 0.8% | 0.0% |
| Sacramento – Other | $0.0 | 0.0% | 0.0% |
| Sacramento – Retail | $13.6 | 1.7% | 0.0% |
| Sacramento – Self Storage | $0.0 | 0.0% | 0.0% |
| Salt Lake City – Salt Lake City, UT MSA | $46.8 | 1.3% | 0.0% |
| Salt Lake City – Hotel | $46.8 | 16.6% | -0.3% |
| Salt Lake City – Industrial | $0.0 | 0.0% | 0.0% |
| Salt Lake City – Multifamily | $0.0 | 0.0% | 0.0% |
| Salt Lake City – Office | $0.0 | 0.0% | 0.0% |
| Salt Lake City – Other | $0.0 | 0.0% | 0.0% |
| Salt Lake City – Retail | $0.0 | 0.0% | 0.0% |
| Salt Lake City – Self Storage | $0.0 | 0.0% | 0.0% |
| San Antonio – San Antonio, TX MSA | $142.9 | 2.2% | 0.1% |
| San Antonio – Hotel | $08.4 | 3.1% | 0.8% |
| San Antonio – Industrial | $01.4 | 0.8% | 0.8% |
| San Antonio – Multifamily | $08.0 | 0.2% | 0.2% |
| San Antonio – Office | $0.0 | 0.0% | 0.0% |
| San Antonio – Other | $0.0 | 0.0% | 0.0% |
| San Antonio – Retail | $125.1 | 14.0% | -0.1% |
| San Antonio – Self Storage | $0.0 | 0.0% | 0.0% |
| San Diego – San Diego-Carlsbad-San Marcos, CA MSA | $87.9 | 0.7% | -0.3% |
| San Diego – Hotel | $61.7 | 3.1% | -0.8% |
| San Diego – Industrial | $0.0 | 0.0% | 0.0% |
| San Diego – Multifamily | $01.4 | 0.0% | -0.2% |
| San Diego – Office | $0.0 | 0.0% | 0.0% |
| San Diego – Other | $20.5 | 2.9% | -0.1% |
| San Diego – Retail | $04.3 | 0.4% | 0.0% |
| San Diego – Self Storage | $0.0 | 0.0% | 0.0% |
| San Francisco – San Francisco-Oakland-Fremont, CA MSA | $169.8 | 0.7% | -0.9% |
| San Francisco – Hotel | $62.8 | 2.8% | -4.5% |
| San Francisco – Industrial | $0.0 | 0.0% | 0.0% |
| San Francisco – Multifamily | $20.8 | 0.3% | 0.0% |
| San Francisco – Office | $0.0 | 0.0% | -1.1% |
| San Francisco – Other | $38.6 | 2.2% | 0.0% |
| San Francisco – Retail | $47.6 | 4.1% | 0.1% |
| San Francisco – Self Storage | $0.0 | 0.0% | 0.0% |
| San Jose – San Jose-Sunnyvale-Santa Clara, CA MSA | $135.7 | 1.0% | 0.0% |
| San Jose – Hotel | $121.0 | 5.8% | 0.0% |
| San Jose – Industrial | $0.0 | 0.0% | 0.0% |
| San Jose – Multifamily | $0.0 | 0.0% | 0.0% |
| San Jose – Office | $14.7 | 0.2% | 0.0% |
| San Jose – Other | $0.0 | 0.0% | 0.0% |
| San Jose – Retail | $0.0 | 0.0% | 0.0% |
| San Jose – Self Storage | $0.0 | 0.0% | 0.0% |
| Seattle – Seattle-Tacoma-Bellevue, WA MSA | $76.2 | 0.4% | -0.2% |
| Seattle – Hotel | $71.8 | 5.9% | -2.4% |
| Seattle – Industrial | $0.0 | 0.0% | 0.0% |
| Seattle – Multifamily | $04.3 | 0.1% | 0.0% |
| Seattle – Office | $0.0 | 0.0% | 0.0% |
| Seattle – Other | $0.0 | 0.0% | 0.0% |
| Seattle – Retail | $0.0 | 0.0% | 0.0% |
| Seattle – Self Storage | $0.0 | 0.0% | 0.0% |
| St. Louis – St. Louis, MO-IL MSA | $376.4 | 9.0% | -0.7% |
| St. Louis – Hotel | $42.2 | 15.7% | -5.0% |
| St. Louis – Industrial | $0.0 | 0.0% | 0.0% |
| St. Louis – Multifamily | $07.7 | 0.5% | -1.0% |
| St. Louis – Office | $108.9 | 20.1% | 0.9% |
| St. Louis – Other | $23.0 | 4.2% | 0.0% |
| St. Louis – Retail | $194.5 | 19.8% | 0.0% |
| St. Louis – Self Storage | $0.0 | 0.0% | 0.0% |
| Tampa – Tampa-St. Petersburg-Clearwater, FL | $300.0 | 3.4% | -0.1% |
| Tampa – Hotel | $29.9 | 4.4% | 0.1% |
| Tampa – Industrial | $0.0 | 0.0% | 0.0% |
| Tampa – Multifamily | $02.5 | 0.0% | 0.0% |
| Tampa – Office | $23.7 | 3.9% | -0.2% |
| Tampa – Other | $0.0 | 0.0% | 0.0% |
| Tampa – Retail | $243.9 | 27.2% | 0.5% |
| Tampa – Self Storage | $0.0 | 0.0% | 0.0% |
| Tucson – Tucson, AZ MSA | $165.9 | 5.3% | -0.6% |
| Tucson – Hotel | $04.7 | 1.6% | -6.5% |
| Tucson – Industrial | $0.0 | 0.0% | 0.0% |
| Tucson – Multifamily | $0.0 | 0.0% | 0.0% |
| Tucson – Office | $0.0 | 0.0% | 0.0% |
| Tucson – Other | $0.0 | 0.0% | 0.0% |
| Tucson – Retail | $161.3 | 20.1% | 0.0% |
| Tucson – Self Storage | $0.0 | 0.0% | 0.0% |
| Virginia Beach – Virginia Beach-Norfolk-Newport News, VA-NC MSA | $226.2 | 5.0% | -0.2% |
| Virginia Beach – Hotel | $0.0 | 0.0% | -2.1% |
| Virginia Beach – Industrial | $21.2 | 6.9% | 0.0% |
| Virginia Beach – Multifamily | $0.0 | 0.0% | 0.0% |
| Virginia Beach – Office | $02.8 | 0.7% | 0.7% |
| Virginia Beach – Other | $0.0 | 0.0% | 0.0% |
| Virginia Beach – Retail | $202.2 | 23.2% | 0.2% |
| Virginia Beach – Self Storage | $0.0 | 0.0% | 0.0% |
| Washington, DC – Washington-Arlington-Alexandria, DC-VA-MD-WV MSA | $537.8 | 1.9% | -0.3% |
| Washington, DC – Hotel | $14.8 | 1.6% | -1.8% |
| Washington, DC – Industrial | $11.2 | 2.0% | 0.0% |
| Washington, DC – Multifamily | $01.2 | 0.0% | 0.0% |
| Washington, DC – Office | $323.6 | 4.8% | -0.6% |
| Washington, DC – Other | $44.7 | 2.7% | 0.0% |
| Washington, DC – Retail | $142.2 | 4.9% | -0.3% |
| Washington, DC – Self Storage | $0.0 | 0.0% | 0.0% |
| Grand Total | $23,696.8 | 3.5% | -0.2% |
About CRED iQ
CRED iQ is a commercial real estate data, analytics, and valuation platform providing actionable intelligence to CRE and capital markets investors. Subscribers to CRED iQ use the platform to identify valuable leads for leasing, lending, refinancing, distressed debt, and acquisition opportunities. Our data platform is powered by over $2.0 trillion of CMBS, CRE CLO, SBLL, Ginnie Mae, FHA/HUD, and Freddie Mac loan and property data.
