
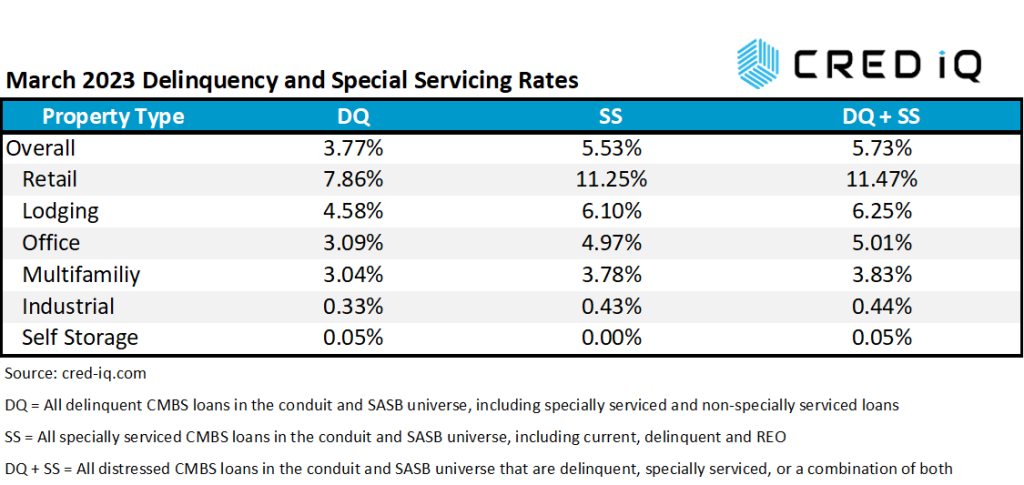
SS = All specially serviced CMBS loans in the conduit and SASB universe, including current, delinquent and REO
DQ + SS = All distressed CMBS loans in the conduit and SASB universe that are delinquent, specially serviced, or a combination of both
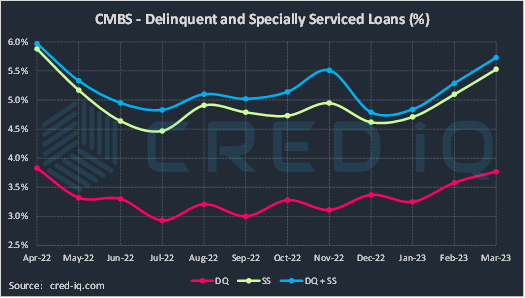
The CRED iQ delinquency rate for CMBS for the month of March 2023 increased for the second consecutive month to 3.77%. The delinquency rate was 19 basis points higher than the prior month’s delinquency rate of 3.58%. The increases in delinquency are congruent with headline risk related to industry-wide concerns surrounding commercial real estate debt in an economic slowdown. The delinquency rate is equal to the percentage of all delinquent specially serviced loans and delinquent non-specially serviced loans, for CRED iQ’s sample universe of $600+ billion in CMBS conduit and single asset single-borrower (SASB) loans. CRED iQ’s special servicing rate, equal to the percentage of CMBS loans that are with the special servicer (delinquent and non-delinquent), also increased month-over-month to 5.53% from 5.10%. The special servicing rate increased by approximately 40 basis points in each of the two preceding months. Aggregating the two indicators of distress – delinquency rate and special servicing rate – into an overall distressed rate (DQ + SS%) equals 5.73% of CMBS loans that are specially serviced, delinquent, or a combination of both. In parallel with delinquency and special servicing rates, the overall distressed rate increased compared to the prior month’s distressed rate of 5.29%. Distressed rates generally track slightly higher than special servicing rates as most delinquent loans are also with the special servicer.
SS = All specially serviced CMBS loans in the conduit and SASB universe, including current, delinquent and REO
DQ + SS = All distressed CMBS loans in the conduit and SASB universe that are delinquent, specially serviced, or a combination of both
By property type, focus will naturally narrow on the delinquency rate for the office sector given the headwinds the property type is facing. The delinquency rate for loans secured by office properties increased to 3.09% as of March 2023, which was 78 basis points higher than February and represented a 34% month-over-month increase. The office delinquency rate has increased for four consecutive months and is at its highest level since 2020 when CRED iQ started tracking delinquency rates.
Major delinquencies continue to stress the office landscape. Last month was headlined by Columbia Property Trust’s payment default on $1.7 billion in mortgage debt secured by seven office properties located in New York, San Francisco, Boston, and Jersey City. Among this month’s newly delinquent office loans was a $350 million floating-rate mortgage secured by the Gas Company Tower in Los Angeles, CA. The loan defaulted at maturity in February 2023 and subsequently transferred to special servicing. The loan’s credit issues included additional leverage from $115 million in mezzanine debt and an interest rate cap agreement that expired in February 2023. Additionally, reported occupancy for the DTLA office tower was 73%, adding to the recipe of distress.
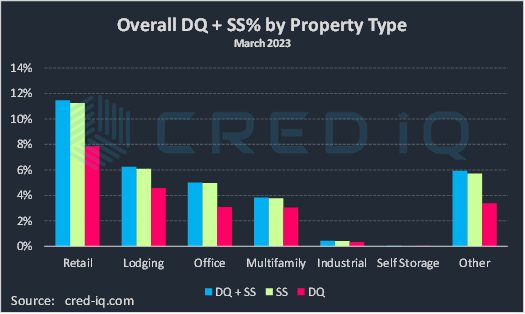
Delinquency rates for retail (7.86%), lodging (4.58%), office (3.09%), and multifamily (3.04%) all exhibited month-over-month increases. Delinquency rates for industrial (0.33%) and self-storage (0.05%) were relatively unchanged compared to the prior month.
Pivoting to special servicing rates, all property types besides self-storage exhibited month-over-month increases in the percentage of loans transferred to the special servicer. The retail sector has the highest specially serviced rate among all property types at 11.25%. The elevated special servicing rate for retail properties continues to be anchored by regional malls. A $242.2 million mortgage secured by a 780,000-SF portion of the Fair Oaks Mall in Fairfax, VA transferred to special servicing in late-February 2023 due to anticipated maturity default ahead of the loan’s May 2023 maturity date. Similarly, a $300 million mortgage secured by the 1.0 million-SF Bergen Town Center transferred to special servicing in March 2023 ahead of its May 2023 maturity date. Given the current refi environment, workouts for both loans may benefit from relief in the form of extension or modifications.
Aside from retail, the special servicing rate for lodging came in at 6.10%, a modest increase compared to February. The special servicing rate for office surged to 4.97%, representing a 19% month-over-month increase. Multifamily (3.78%) and industrial (0.43%) special servicing rates also exhibited increases. Special servicing inventory for loans secured by self-storage properties has been negligible for the past two months.
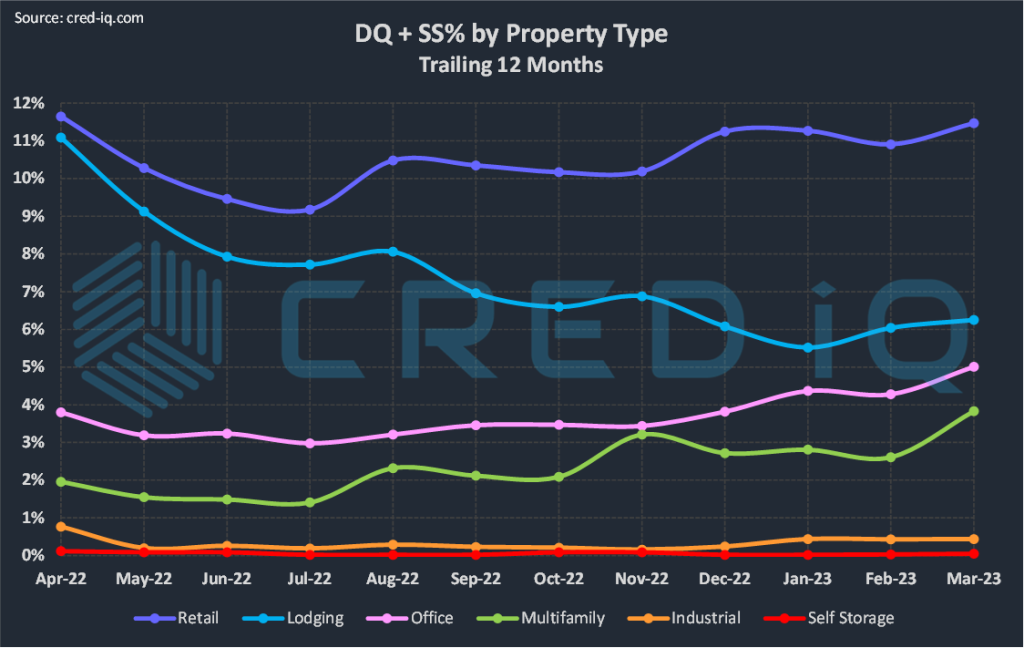
CRED iQ’s CMBS distressed rate (DQ + SS%) by property type accounts for loans that qualify for either delinquent or special servicing subsets. This month, the overall distressed rate for CMBS increased to 5.73%. The increase was 44 basis points higher than February’s distressed rate (5.29%), equal to an 8% increase. Although all property types experienced higher distress in March 2023 compared to February, the office sector was the biggest driver behind the change. Lastly, the spread between the overall delinquency rate and the special servicing rate increased in March 2023, indicating that many loans were transferred to special servicing preemptively prior to payment default or delinquency. This spread has potential to tighten as special servicing loans that are current in payment deteriorate in payment status as workouts are prolonged.
For additional information about two of this month’s largest loans that transferred to special servicing, click View Details below:
| [View Details] | [View Details] | |
| Loan | Gas Company Tower | Fair Oaks Mall |
| Balance | $350 million | $242.2 million |
| Special Servicer Transfer Date | 2/10/2023 | 2/28/2023 |
About CRED iQ
CRED iQ is a commercial real estate data, analytics, and valuation platform providing actionable intelligence to CRE and capital markets investors. Subscribers use the platform to identify valuable leads for leasing, lending, refinancing, distressed debt, and acquisition opportunities.
The platform also offers a highly efficient valuation engine which can be leveraged across all property types and geographies. Our data platform is powered by over $2.0 trillion in transactions and data covering CRE, CMBS, CRE CLO, Single Asset Single Borrower (SASB), and all of GSE / Agency.
