
CRED iQ monitors distressed rates and market performance for nearly 400 MSAs across the United States, covering over $900 billion in outstanding commercial real estate (CRE) debt. Distressed rates (DQ + SS%) include loans that are specially serviced, delinquent, or a combination of both. Distressed rates and month-over-month changes for data reported as of April 2023 are presented below for the 50 largest MSAs, broken out by property type for a granular view of distress by market-sector.
Of the 50 largest MSAs tracked by CRED iQ, the overwhelming majority exhibited month-over-month increases in the percentage of distressed CRE loans. There were 42 markets with increases in CRE distress, equal to 84% of the 50 largest MSAs. The average increase in distress was approximately 80 basis points. Notable markets with the largest increases in distress this month included Minneapolis (+2.5%), Jacksonville (+2.0%), and San Antonio (2.0%). The New Orleans (-1.8%) and Louisville (-1.1%) MSAs were among the few markets that exhibited month-over-month improvements in distressed rates during April 2023.
One of CRED iQ’s initial observations from new data revealed as of April 2023 is that many incumbent markets with the highest distressed rates were also the same markets that exhibited the sharpest month-over-month increases in distress. In other words, the worst performing markets deteriorated at the fastest rates during April 2023. Last month, CRED iQ focused on the Minneapolis MSA, which ranks as the market with the highest overall level of distress among the 50 largest MSAs — equal to 25.2%. This month, a significant increase in distress in the Chicago MSA moved the market into position for the second-highest rate of commercial real estate distress. In April 2023, Chicago exhibited a 1.3% month-over-month increase in the percentage of distressed CMBS loans, which was one of the 10 largest increases among the 50 largest MSAs.
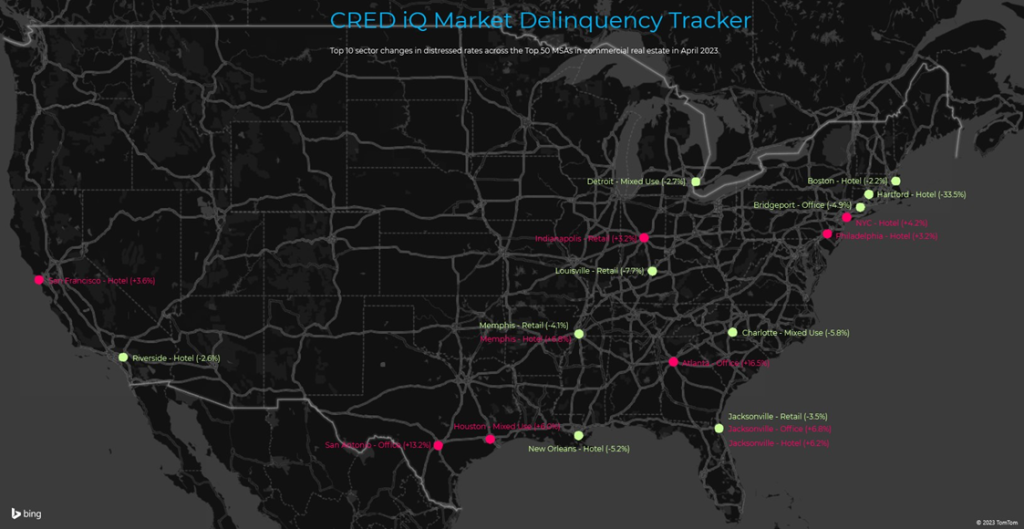
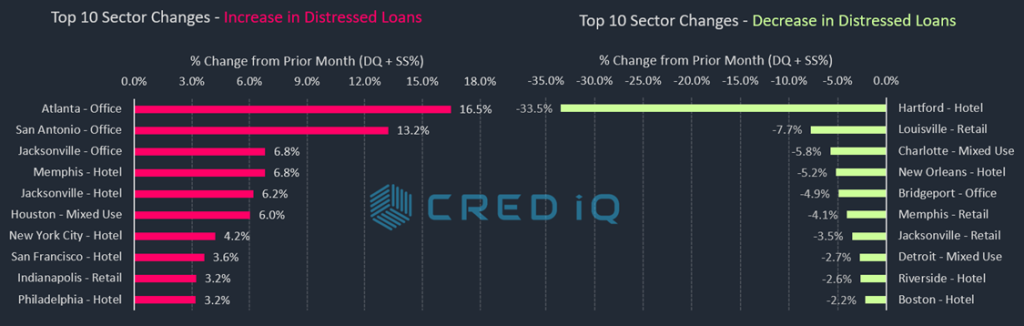
For a more granular analysis of the Top 50 markets, CRED iQ further delineated individual markets’ distressed rates by property type for a comprehensive view by market-sector. The market-sectors with the three highest percentage increases in distress rates during April 2023 were office sectors: Atlanta (+16.5%), San Antonio (+13.2%), and Jacksonville (+6.8%). Office distress in the Atlanta market was driven by a $350 million mortgage secured by a 2.2 million-SF, eight-property suburban office portfolio owned by Adventus Realty Trust. The loan transferred to special servicing in mid-March 2023 — five of the collateral office properties are located in suburban Atlanta. The San Antonio office market was adversely impacted by the Brass Professional Center, which transferred to special servicing on March 13, 2023. The 575,771-SF suburban office property secures a $56.3 million mortgage and was most recently reported as 71% occupied as of September 2022.
Increased distress was also notable across several hotel markets after a $982 million mortgage transferred to special servicing in April 2023 ahead of its June 2023 maturity date. The mortgage is secured by 34 Ashford Hospitality Trust hotels located across multiple markets. Five of those markets, in particular, showed relatively higher increases in distress as a result of the loan’s transfer to special servicing in April 2023: Memphis, Jacksonville, New York City, San Francisco, and Philadelphia. The hotel sector across each of these five markets each ranked in the 10 largest increases in distress among all of the market-sectors tracked by CRED iQ.
The inclusion of Jacksonville-Office and Jacksonville-Hotel highlights a volatile month for the MSA, which had the second-highest increase in the percentage of distress commercial real estate loans in April 2023. The hotel distress was derived from exposure to the aforementioned Ashford Hospital Trust portfolio and additional office distress was caused by a pair of 200,000-SF Duval County office buildings that transferred to special servicing in March 2023 — The Meridian at Deerwood Park and Greystone Park. The Minneapolis MSA has the highest overall distressed rate at 25.2% and distress for the market is at its highest level over the past 18 months. Chicago (10.8%), Birmingham, AL (10.7%), Milwaukee (10.5%), and Cleveland (9.4%) comprise the remaining markets with the highest rates of distress. The Chicago MSA continued its descension in the list of poorest performing markets, entering the Top 5 last month and descending further to the second-lowest ranking in April 2023. The San Jose MSA (0.3%) displaced Salt Lake City as the market with the lowest percentage of distress among the Top 50 MSAs.
View commercial real estate distressed rates broken out by market and property type below:
| MSA – Property Type | DQ/SS (millions) | DQ/SS (%) | Monthly Change |
| Allentown-Bethlehem-Easton, PA-NJ MSA | $77.8 | 2.6% | 0.2% |
| Allentown – Hotel | $1.1 | 3.1% | -0.2% |
| Allentown – Industrial | $0.0 | 0.0% | 0.0% |
| Allentown – Multifamily | $0.0 | 0.0% | 0.0% |
| Allentown – Office | $57.9 | 18.5% | 0.0% |
| Allentown – Other | $0.0 | 0.0% | 0.0% |
| Allentown – Retail | $18.9 | 5.2% | 0.2% |
| Allentown – Self Storage | $0.0 | 0.0% | 0.0% |
| Atlanta-Sandy Springs-Marietta, GA MSA | $665.9 | 2.9% | 1.2% |
| Atlanta – Hotel | $90.0 | 3.6% | 1.0% |
| Atlanta – Industrial | $0.0 | 0.0% | 0.0% |
| Atlanta – Multifamily | $4.0 | 0.0% | 0.0% |
| Atlanta – Office | $438.8 | 20.3% | 16.5% |
| Atlanta – Other | $0.0 | 0.0% | 0.0% |
| Atlanta – Retail | $133.1 | 7.1% | -7.4% |
| Atlanta – Self Storage | $0.0 | 0.0% | 0.0% |
| Austin-Round Rock, TX MSA | $126.4 | 1.6% | 0.4% |
| Austin – Hotel | $69.5 | 7.9% | 1.4% |
| Austin – Industrial | $0.0 | 0.0% | 0.0% |
| Austin – Multifamily | $0.0 | 0.0% | 0.0% |
| Austin – Office | $0.0 | 0.0% | 0.0% |
| Austin – Other | $8.3 | 1.9% | 0.9% |
| Austin – Retail | $48.7 | 6.4% | -0.6% |
| Austin – Self Storage | $0.0 | 0.0% | 0.0% |
| Baltimore-Towson, MD MSA | $394.6 | 4.9% | 1.7% |
| Baltimore – Hotel | $65.4 | 14.4% | 2.1% |
| Baltimore – Industrial | $0.0 | 0.0% | 0.0% |
| Baltimore – Multifamily | $5.2 | 0.1% | 0.0% |
| Baltimore – Office | $65.7 | 7.4% | -0.1% |
| Baltimore – Other | $11.5 | 6.7% | 1.2% |
| Baltimore – Retail | $246.9 | 23.0% | 7.7% |
| Baltimore – Self Storage | $0.0 | 0.0% | 0.0% |
| Birmingham-Hoover, AL MSA | $300.8 | 10.7% | 0.9% |
| Birmingham – Hotel | $10.3 | 7.6% | -1.6% |
| Birmingham – Industrial | $0.0 | 0.0% | 0.0% |
| Birmingham – Multifamily | $0.0 | 0.0% | 0.0% |
| Birmingham – Office | $120.5 | 23.5% | -0.2% |
| Birmingham – Other | $0.0 | 0.0% | 0.0% |
| Birmingham – Retail | $169.9 | 23.2% | -0.1% |
| Birmingham – Self Storage | $0.0 | 0.0% | 0.0% |
| Boston-Cambridge-Quincy, MA-NH MSA | $161.4 | 0.9% | -0.2% |
| Boston – Hotel | $19.3 | 1.1% | -2.2% |
| Boston – Industrial | $0.0 | 0.0% | 0.0% |
| Boston – Multifamily | $0.0 | 0.0% | 0.0% |
| Boston – Office | $50.3 | 0.7% | 0.0% |
| Boston – Other | $0.0 | 0.0% | -0.1% |
| Boston – Retail | $91.8 | 5.1% | -1.9% |
| Boston – Self Storage | $0.0 | 0.0% | 0.0% |
| Bridgeport-Stamford-Norwalk, CT MSA | $138.9 | 3.6% | -0.9% |
| Bridgeport – Hotel | $38.8 | 25.8% | -0.2% |
| Bridgeport – Industrial | $17.8 | 18.6% | 3.6% |
| Bridgeport – Multifamily | $0.0 | 0.0% | 0.0% |
| Bridgeport – Office | $72.5 | 6.1% | -4.9% |
| Bridgeport – Other | $9.8 | 2.2% | -0.4% |
| Bridgeport – Retail | $0.0 | 0.0% | 0.0% |
| Bridgeport – Self Storage | $0.0 | 0.0% | 0.0% |
| Charlotte-Gastonia-Concord, NC-SC MSA | $591.6 | 9.3% | 1.4% |
| Charlotte – Hotel | $39.5 | 4.5% | -0.8% |
| Charlotte – Industrial | $0.0 | 0.0% | 0.0% |
| Charlotte – Multifamily | $0.0 | 0.0% | 0.0% |
| Charlotte – Office | $353.9 | 36.6% | 0.0% |
| Charlotte – Other | $114.8 | 30.5% | -5.8% |
| Charlotte – Retail | $83.4 | 8.2% | -0.5% |
| Charlotte – Self Storage | $0.0 | 0.0% | 0.0% |
| Chicago-Naperville-Joliet, IL-IN-WI MSA | $2,853.0 | 10.8% | 1.3% |
| Chicago – Hotel | $739.6 | 41.9% | 1.3% |
| Chicago – Industrial | $0.0 | 0.0% | 0.0% |
| Chicago – Multifamily | $57.4 | 0.8% | 0.3% |
| Chicago – Office | $1,623.2 | 19.5% | 1.1% |
| Chicago – Other | $205.0 | 8.7% | 0.1% |
| Chicago – Retail | $227.8 | 7.3% | 0.1% |
| Chicago – Self Storage | $0.0 | 0.0% | 0.0% |
| Cincinnati-Middletown, OH-KY-IN MSA | $136.4 | 3.8% | 0.7% |
| Cincinnati – Hotel | $86.5 | 31.4% | 1.2% |
| Cincinnati – Industrial | $0.0 | 0.0% | 0.0% |
| Cincinnati – Multifamily | $0.0 | 0.0% | 0.0% |
| Cincinnati – Office | $0.0 | 0.0% | 0.0% |
| Cincinnati – Other | $6.8 | 3.2% | 0.6% |
| Cincinnati – Retail | $43.2 | 7.5% | 1.4% |
| Cincinnati – Self Storage | $0.0 | 0.0% | 0.0% |
| Cleveland-Elyria-Mentor, OH MSA | $352.7 | 9.4% | -0.9% |
| Cleveland – Hotel | $84.4 | 50.2% | 3.7% |
| Cleveland – Industrial | $0.0 | 0.0% | 0.0% |
| Cleveland – Multifamily | $0.0 | 0.0% | 0.0% |
| Cleveland – Office | $89.4 | 9.9% | -8.3% |
| Cleveland – Other | $171.4 | 43.7% | 0.7% |
| Cleveland – Retail | $7.6 | 1.1% | 0.0% |
| Cleveland – Self Storage | $0.0 | 0.0% | 0.0% |
| Columbus, OH MSA | $190.8 | 3.4% | 0.7% |
| Columbus, OH – Hotel | $19.0 | 7.0% | 0.2% |
| Columbus, OH – Industrial | $0.0 | 0.0% | 0.0% |
| Columbus, OH – Multifamily | $0.0 | 0.0% | 0.0% |
| Columbus, OH – Office | $57.3 | 8.2% | -0.1% |
| Columbus, OH – Other | $0.0 | 0.0% | 0.0% |
| Columbus, OH – Retail | $114.5 | 13.1% | 0.3% |
| Columbus, OH – Self Storage | $0.0 | 0.0% | 0.0% |
| Dallas-Fort Worth-Arlington, TX MSA | $308.0 | 1.1% | 0.3% |
| Dallas – Hotel | $124.1 | 3.7% | 1.7% |
| Dallas – Industrial | $0.0 | 0.0% | 0.0% |
| Dallas – Multifamily | $0.0 | 0.0% | 0.0% |
| Dallas – Office | $139.1 | 4.5% | -0.2% |
| Dallas – Other | $5.3 | 0.3% | -0.2% |
| Dallas – Retail | $39.4 | 2.2% | 0.3% |
| Dallas – Self Storage | $0.0 | 0.0% | 0.0% |
| Denver-Aurora, CO MSA | $786.6 | 6.3% | 1.3% |
| Denver – Hotel | $18.7 | 2.2% | 0.0% |
| Denver – Industrial | $0.0 | 0.0% | 0.0% |
| Denver – Multifamily | $0.0 | 0.0% | 0.0% |
| Denver – Office | $687.4 | 32.1% | 1.6% |
| Denver – Other | $34.3 | 4.3% | -5.6% |
| Denver – Retail | $46.2 | 3.2% | -0.2% |
| Denver – Self Storage | $0.0 | 0.0% | 0.0% |
| Detroit-Warren-Livonia, MI MSA | $264.0 | 2.7% | 0.0% |
| Detroit – Hotel | $83.8 | 12.7% | 1.0% |
| Detroit – Industrial | $18.8 | 2.9% | -0.3% |
| Detroit – Multifamily | $1.3 | 0.0% | 0.0% |
| Detroit – Office | $18.2 | 0.7% | -0.1% |
| Detroit – Other | $0.0 | 0.0% | -2.7% |
| Detroit – Retail | $142.0 | 9.7% | 0.1% |
| Detroit – Self Storage | $0.0 | 0.0% | 0.0% |
| Hartford-West Hartford-East Hartford, CT MSA | $154.8 | 7.3% | -0.2% |
| Hartford – Hotel | $4.2 | 3.5% | -33.5% |
| Hartford – Industrial | $0.0 | 0.0% | 0.0% |
| Hartford – Multifamily | $0.0 | 0.0% | 0.0% |
| Hartford – Office | $24.9 | 8.7% | 0.0% |
| Hartford – Other | $0.0 | 0.0% | 0.0% |
| Hartford – Retail | $125.7 | 43.2% | 4.5% |
| Hartford – Self Storage | $0.0 | 0.0% | 0.0% |
| Houston-Sugar Land-Baytown, TX MSA | $1,268.3 | 5.8% | 1.0% |
| Houston – Hotel | $446.2 | 46.4% | -1.9% |
| Houston – Industrial | $32.7 | 5.3% | 0.7% |
| Houston – Multifamily | $10.5 | 0.1% | -0.1% |
| Houston – Office | $642.3 | 17.9% | 1.8% |
| Houston – Other | $117.8 | 17.3% | 6.0% |
| Houston – Retail | $18.9 | 0.5% | -1.6% |
| Houston – Self Storage | $0.0 | 0.0% | 0.0% |
| Indianapolis-Carmel, IN MSA | $168.5 | 3.4% | 0.8% |
| Indianapolis – Hotel | $92.2 | 16.6% | 1.0% |
| Indianapolis – Industrial | $0.0 | 0.0% | 0.0% |
| Indianapolis – Multifamily | $1.7 | 0.1% | 0.1% |
| Indianapolis – Office | $59.8 | 9.4% | -0.2% |
| Indianapolis – Other | $0.0 | 0.0% | 0.0% |
| Indianapolis – Retail | $14.8 | 3.8% | 3.2% |
| Indianapolis – Self Storage | $0.0 | 0.0% | 0.0% |
| Jacksonville, FL MSA | $174.5 | 4.1% | 2.0% |
| Jacksonville – Hotel | $24.4 | 6.2% | 6.2% |
| Jacksonville – Industrial | $0.0 | 0.0% | 0.0% |
| Jacksonville – Multifamily | $0.0 | 0.0% | 0.0% |
| Jacksonville – Office | $38.2 | 6.8% | 6.8% |
| Jacksonville – Other | $0.0 | 0.0% | 0.0% |
| Jacksonville – Retail | $111.9 | 25.4% | -3.5% |
| Jacksonville – Self Storage | $0.0 | 0.0% | 0.0% |
| Kansas City, MO-KS MSA | $99.9 | 2.1% | 0.3% |
| Kansas City – Hotel | $29.3 | 12.4% | 0.0% |
| Kansas City – Industrial | $0.0 | 0.0% | 0.0% |
| Kansas City – Multifamily | $2.5 | 0.1% | 0.0% |
| Kansas City – Office | $0.0 | 0.0% | 0.0% |
| Kansas City – Other | $20.9 | 11.5% | 1.0% |
| Kansas City – Retail | $47.3 | 8.5% | 0.0% |
| Kansas City – Self Storage | $0.0 | 0.0% | 0.0% |
| Las Vegas-Paradise, NV MSA | $565.9 | 2.7% | 0.2% |
| Las Vegas – Hotel | $18.3 | 0.2% | 0.2% |
| Las Vegas – Industrial | $0.0 | 0.0% | 0.0% |
| Las Vegas – Multifamily | $0.0 | 0.0% | 0.0% |
| Las Vegas – Office | $0.0 | 0.0% | 0.0% |
| Las Vegas – Other | $325.0 | 39.3% | -1.0% |
| Las Vegas – Retail | $222.6 | 5.8% | -1.1% |
| Las Vegas – Self Storage | $0.0 | 0.0% | 0.0% |
| Los Angeles-Long Beach-Santa Ana, CA MSA | $2,109.7 | 4.2% | 1.1% |
| Los Angeles – Hotel | $162.0 | 3.2% | 1.7% |
| Los Angeles – Industrial | $0.0 | 0.0% | 0.0% |
| Los Angeles – Multifamily | $5.2 | 0.0% | 0.0% |
| Los Angeles – Office | $780.3 | 5.9% | 2.3% |
| Los Angeles – Other | $131.5 | 3.9% | 0.5% |
| Los Angeles – Retail | $1,023.2 | 15.6% | 0.0% |
| Los Angeles – Self Storage | $7.6 | 0.9% | 0.0% |
| Louisville/Jefferson County, KY-IN MSA | $30.3 | 1.1% | -1.1% |
| Louisville – Hotel | $0.0 | 0.0% | 0.0% |
| Louisville – Industrial | $0.0 | 0.0% | 0.0% |
| Louisville – Multifamily | $0.0 | 0.0% | 0.0% |
| Louisville – Office | $0.0 | 0.0% | 0.0% |
| Louisville – Other | $0.0 | 0.0% | 0.0% |
| Louisville – Retail | $30.3 | 6.1% | -7.7% |
| Louisville – Self Storage | $0.0 | 0.0% | 0.0% |
| Memphis, TN-AR-MS MSA | $80.3 | 3.8% | 0.6% |
| Memphis – Hotel | $28.3 | 12.8% | 6.8% |
| Memphis – Industrial | $0.0 | 0.0% | 0.0% |
| Memphis – Multifamily | $0.0 | 0.0% | 0.0% |
| Memphis – Office | $0.0 | 0.0% | 0.0% |
| Memphis – Other | $5.3 | 18.0% | 3.3% |
| Memphis – Retail | $46.8 | 12.3% | -4.1% |
| Memphis – Self Storage | $0.0 | 0.0% | 0.0% |
| Miami-Fort Lauderdale-Pompano Beach, FL MSA | $322.2 | 1.3% | 0.3% |
| Miami – Hotel | $70.5 | 1.3% | 0.6% |
| Miami – Industrial | $0.0 | 0.0% | 0.0% |
| Miami – Multifamily | $1.4 | 0.0% | 0.0% |
| Miami – Office | $4.1 | 0.1% | 0.0% |
| Miami – Other | $0.0 | 0.0% | 0.0% |
| Miami – Retail | $246.2 | 4.5% | 0.8% |
| Miami – Self Storage | $0.0 | 0.0% | 0.0% |
| Milwaukee-Waukesha-West Allis, WI MSA | $221.8 | 10.5% | 1.6% |
| Milwaukee – Hotel | $16.5 | 10.8% | 0.5% |
| Milwaukee – Industrial | $0.0 | 0.0% | 0.0% |
| Milwaukee – Multifamily | $0.0 | 0.0% | 0.0% |
| Milwaukee – Office | $99.9 | 16.6% | -1.1% |
| Milwaukee – Other | $0.0 | 0.0% | 0.0% |
| Milwaukee – Retail | $105.4 | 23.7% | 0.6% |
| Milwaukee – Self Storage | $0.0 | 0.0% | 0.0% |
| Minneapolis-St. Paul-Bloomington, MN-WI MSA | $1,919.3 | 25.2% | 2.5% |
| Minneapolis – Hotel | $265.1 | 43.8% | -0.7% |
| Minneapolis – Industrial | $0.0 | 0.0% | 0.0% |
| Minneapolis – Multifamily | $8.0 | 0.4% | 0.4% |
| Minneapolis – Office | $87.9 | 4.2% | -0.2% |
| Minneapolis – Other | $158.2 | 33.0% | 1.2% |
| Minneapolis – Retail | $1,400.0 | 73.7% | -0.4% |
| Minneapolis – Self Storage | $0.0 | 0.0% | 0.0% |
| Nashville-Davidson-Murfreesboro-Franklin, TN MSA | $64.6 | 1.3% | 0.2% |
| Nashville – Hotel | $51.5 | 3.5% | 0.1% |
| Nashville – Industrial | $0.0 | 0.0% | 0.0% |
| Nashville – Multifamily | $0.0 | 0.0% | 0.0% |
| Nashville – Office | $0.0 | 0.0% | 0.0% |
| Nashville – Other | $0.0 | 0.0% | 0.0% |
| Nashville – Retail | $13.0 | 1.7% | 0.0% |
| Nashville – Self Storage | $0.0 | 0.0% | 0.0% |
| New Orleans-Metairie-Kenner, LA MSA | $58.5 | 1.6% | -1.8% |
| New Orleans – Hotel | $0.0 | 0.0% | -5.2% |
| New Orleans – Industrial | $0.0 | 0.0% | 0.0% |
| New Orleans – Multifamily | $11.3 | 1.4% | 0.5% |
| New Orleans – Office | $27.0 | 4.9% | -0.1% |
| New Orleans – Other | $14.7 | 9.7% | 0.2% |
| New Orleans – Retail | $5.6 | 0.7% | -1.1% |
| New Orleans – Self Storage | $0.0 | 0.0% | 0.0% |
| New York-Northern New Jersey-Long Island, NY-NJ-PA MSA | $7,619.0 | 6.1% | 0.8% |
| New York City – Hotel | $1,001.8 | 24.4% | 4.2% |
| New York City – Industrial | $120.2 | 2.8% | -0.2% |
| New York City – Multifamily | $951.1 | 3.3% | 1.2% |
| New York City – Office | $1,324.8 | 2.8% | -0.1% |
| New York City – Other | $1,786.5 | 7.5% | 0.7% |
| New York City – Retail | $2,434.6 | 19.2% | 1.1% |
| New York City – Self Storage | $0.0 | 0.0% | 0.0% |
| Orlando-Kissimmee, FL MSA | $102.2 | 1.2% | 0.1% |
| Orlando – Hotel | $13.5 | 0.5% | -0.3% |
| Orlando – Industrial | $0.0 | 0.0% | 0.0% |
| Orlando – Multifamily | $0.0 | 0.0% | 0.0% |
| Orlando – Office | $60.4 | 11.1% | -2.2% |
| Orlando – Other | $0.0 | 0.0% | 0.0% |
| Orlando – Retail | $28.3 | 3.1% | -0.1% |
| Orlando – Self Storage | $0.0 | 0.0% | 0.0% |
| Philadelphia-Camden-Wilmington, PA-NJ-DE-MD MSA | $1,122.3 | 5.9% | 1.7% |
| Philadelphia – Hotel | $159.3 | 17.6% | 3.2% |
| Philadelphia – Industrial | $10.3 | 0.3% | 0.0% |
| Philadelphia – Multifamily | $107.4 | 1.5% | 1.1% |
| Philadelphia – Office | $424.6 | 10.8% | 3.1% |
| Philadelphia – Other | $389.0 | 29.5% | -1.5% |
| Philadelphia – Retail | $31.8 | 1.5% | 0.6% |
| Philadelphia – Self Storage | $0.0 | 0.0% | 0.0% |
| Phoenix-Mesa-Scottsdale, AZ MSA | $253.6 | 1.5% | 0.3% |
| Phoenix – Hotel | $63.0 | 3.7% | 1.8% |
| Phoenix – Industrial | $0.0 | 0.0% | 0.0% |
| Phoenix – Multifamily | $0.0 | 0.0% | 0.0% |
| Phoenix – Office | $48.1 | 2.1% | -0.3% |
| Phoenix – Other | $8.5 | 0.9% | 0.0% |
| Phoenix – Retail | $133.9 | 7.9% | 1.4% |
| Phoenix – Self Storage | $0.0 | 0.0% | 0.0% |
| Pittsburgh, PA MSA | $248.3 | 6.2% | 1.1% |
| Pittsburgh – Hotel | $29.9 | 15.3% | 2.6% |
| Pittsburgh – Industrial | $0.0 | 0.0% | 0.0% |
| Pittsburgh – Multifamily | $1.5 | 0.1% | 0.1% |
| Pittsburgh – Office | $103.9 | 9.8% | 0.6% |
| Pittsburgh – Other | $105.2 | 30.0% | 0.0% |
| Pittsburgh – Retail | $7.8 | 1.5% | 0.1% |
| Pittsburgh – Self Storage | $0.0 | 0.0% | 0.0% |
| Portland-Vancouver-Beaverton, OR-WA MSA | $315.6 | 4.3% | 0.2% |
| Portland – Hotel | $295.9 | 33.5% | 0.2% |
| Portland – Industrial | $0.0 | 0.0% | 0.0% |
| Portland – Multifamily | $0.0 | 0.0% | -0.9% |
| Portland – Office | $19.7 | 4.3% | -0.7% |
| Portland – Other | $0.0 | 0.0% | 0.0% |
| Portland – Retail | $0.0 | 0.0% | 0.0% |
| Portland – Self Storage | $0.0 | 0.0% | 0.0% |
| Raleigh-Cary, NC MSA | $32.4 | 1.0% | 0.1% |
| Raleigh – Hotel | $15.3 | 6.4% | 0.1% |
| Raleigh – Industrial | $0.0 | 0.0% | 0.0% |
| Raleigh – Multifamily | $0.0 | 0.0% | 0.0% |
| Raleigh – Office | $0.0 | 0.0% | 0.0% |
| Raleigh – Other | $6.6 | 2.9% | -0.7% |
| Raleigh – Retail | $10.6 | 3.8% | -0.1% |
| Raleigh – Self Storage | $0.0 | 0.0% | 0.0% |
| Richmond, VA MSA | $157.2 | 5.8% | 1.1% |
| Richmond – Hotel | $0.0 | 0.0% | 0.0% |
| Richmond – Industrial | $0.0 | 0.0% | 0.0% |
| Richmond – Multifamily | $0.0 | 0.0% | 0.0% |
| Richmond – Office | $0.0 | 0.0% | 0.0% |
| Richmond – Other | $12.8 | 8.8% | 0.0% |
| Richmond – Retail | $144.4 | 30.3% | -0.6% |
| Richmond – Self Storage | $0.0 | 0.0% | 0.0% |
| Riverside-San Bernardino-Ontario, CA MSA | $295.1 | 2.8% | -0.1% |
| Riverside – Hotel | $44.1 | 8.9% | -2.6% |
| Riverside – Industrial | $0.0 | 0.0% | 0.0% |
| Riverside – Multifamily | $1.4 | 0.1% | 0.1% |
| Riverside – Office | $0.0 | 0.0% | 0.0% |
| Riverside – Other | $0.0 | 0.0% | 0.0% |
| Riverside – Retail | $249.6 | 11.8% | -0.6% |
| Riverside – Self Storage | $0.0 | 0.0% | 0.0% |
| Sacramento-Arden-Arcade-Roseville, CA MSA | $16.9 | 0.4% | 0.1% |
| Sacramento – Hotel | $0.0 | 0.0% | 0.0% |
| Sacramento – Industrial | $0.0 | 0.0% | 0.0% |
| Sacramento – Multifamily | $0.0 | 0.0% | 0.0% |
| Sacramento – Office | $6.1 | 0.8% | 0.0% |
| Sacramento – Other | $10.9 | 3.7% | 0.8% |
| Sacramento – Retail | $0.0 | 0.0% | 0.0% |
| Sacramento – Self Storage | $0.0 | 0.0% | 0.0% |
| Salt Lake City, UT MSA | $12.7 | 0.3% | 0.1% |
| Salt Lake City – Hotel | $6.1 | 2.1% | 0.2% |
| Salt Lake City – Industrial | $0.0 | 0.0% | 0.0% |
| Salt Lake City – Multifamily | $0.0 | 0.0% | 0.0% |
| Salt Lake City – Office | $0.0 | 0.0% | 0.0% |
| Salt Lake City – Other | $0.0 | 0.0% | 0.0% |
| Salt Lake City – Retail | $6.6 | 1.0% | 0.5% |
| Salt Lake City – Self Storage | $0.0 | 0.0% | 0.0% |
| San Antonio, TX MSA | $188.3 | 4.0% | 2.0% |
| San Antonio – Hotel | $17.4 | 8.8% | 1.9% |
| San Antonio – Industrial | $0.0 | 0.0% | 0.0% |
| San Antonio – Multifamily | $0.0 | 0.0% | 0.0% |
| San Antonio – Office | $56.3 | 13.2% | 13.2% |
| San Antonio – Other | $0.0 | 0.0% | 0.0% |
| San Antonio – Retail | $114.6 | 15.3% | 0.5% |
| San Antonio – Self Storage | $0.0 | 0.0% | 0.0% |
| San Diego-Carlsbad-San Marcos, CA MSA | $63.6 | 0.7% | 0.3% |
| San Diego – Hotel | $56.6 | 3.4% | 1.4% |
| San Diego – Industrial | $0.0 | 0.0% | 0.0% |
| San Diego – Multifamily | $4.1 | 0.1% | 0.0% |
| San Diego – Office | $0.0 | 0.0% | 0.0% |
| San Diego – Other | $0.0 | 0.0% | 0.0% |
| San Diego – Retail | $2.9 | 0.2% | 0.0% |
| San Diego – Self Storage | $0.0 | 0.0% | 0.0% |
| San Francisco-Oakland-Fremont, CA MSA | $1,269.7 | 4.9% | 1.7% |
| San Francisco – Hotel | $209.4 | 7.0% | 3.6% |
| San Francisco – Industrial | $0.0 | 0.0% | 0.0% |
| San Francisco – Multifamily | $447.6 | 6.9% | 1.3% |
| San Francisco – Office | $437.8 | 4.1% | 2.1% |
| San Francisco – Other | $128.6 | 4.0% | 2.6% |
| San Francisco – Retail | $46.4 | 4.1% | -0.3% |
| San Francisco – Self Storage | $0.0 | 0.0% | 0.0% |
| San Jose-Sunnyvale-Santa Clara, CA MSA | $58.3 | 0.3% | 0.0% |
| San Jose – Hotel | $35.2 | 0.5% | 0.0% |
| San Jose – Industrial | $0.0 | 0.0% | 0.0% |
| San Jose – Multifamily | $0.0 | 0.0% | 0.0% |
| San Jose – Office | $23.1 | 0.3% | 0.0% |
| San Jose – Other | $0.0 | 0.0% | 0.0% |
| San Jose – Retail | $0.0 | 0.0% | 0.0% |
| San Jose – Self Storage | $0.0 | 0.0% | 0.0% |
| Seattle-Tacoma-Bellevue, WA MSA | $83.6 | 0.4% | 0.1% |
| Seattle – Hotel | $61.2 | 4.3% | 0.0% |
| Seattle – Industrial | $0.0 | 0.0% | 0.0% |
| Seattle – Multifamily | $0.0 | 0.0% | 0.0% |
| Seattle – Office | $0.0 | 0.0% | 0.0% |
| Seattle – Other | $22.4 | 1.5% | 1.5% |
| Seattle – Retail | $0.0 | 0.0% | 0.0% |
| Seattle – Self Storage | $0.0 | 0.0% | 0.0% |
| St. Louis, MO-IL MSA | $208.3 | 5.2% | 0.4% |
| St. Louis – Hotel | $1.7 | 0.5% | 0.0% |
| St. Louis – Industrial | $0.0 | 0.0% | 0.0% |
| St. Louis – Multifamily | $3.2 | 0.2% | 0.1% |
| St. Louis – Office | $0.0 | 0.0% | 0.0% |
| St. Louis – Other | $14.0 | 2.4% | -0.4% |
| St. Louis – Retail | $189.4 | 19.3% | -0.5% |
| St. Louis – Self Storage | $0.0 | 0.0% | 0.0% |
| Tampa-St. Petersburg-Clearwater, FL | $112.1 | 1.2% | 0.1% |
| Tampa – Hotel | $62.9 | 9.3% | 1.1% |
| Tampa – Industrial | $0.0 | 0.0% | 0.0% |
| Tampa – Multifamily | $1.2 | 0.0% | 0.0% |
| Tampa – Office | $19.6 | 2.6% | 0.0% |
| Tampa – Other | $0.0 | 0.0% | 0.0% |
| Tampa – Retail | $28.4 | 3.9% | -1.1% |
| Tampa – Self Storage | $0.0 | 0.0% | 0.0% |
| Tucson, AZ MSA | $156.5 | 5.2% | 0.7% |
| Tucson – Hotel | $0.0 | 0.0% | 0.0% |
| Tucson – Industrial | $0.0 | 0.0% | 0.0% |
| Tucson – Multifamily | $0.0 | 0.0% | 0.0% |
| Tucson – Office | $0.0 | 0.0% | 0.0% |
| Tucson – Other | $0.0 | 0.0% | 0.0% |
| Tucson – Retail | $156.5 | 19.8% | 0.9% |
| Tucson – Self Storage | $0.0 | 0.0% | 0.0% |
| Virginia Beach-Norfolk-Newport News, VA-NC MSA | $182.8 | 4.6% | 0.7% |
| Virginia Beach – Hotel | $14.8 | 3.4% | -1.5% |
| Virginia Beach – Industrial | $0.0 | 0.0% | 0.0% |
| Virginia Beach – Multifamily | $0.0 | 0.0% | 0.0% |
| Virginia Beach – Office | $0.0 | 0.0% | 0.0% |
| Virginia Beach – Other | $4.4 | 3.0% | -0.4% |
| Virginia Beach – Retail | $163.6 | 18.3% | -0.8% |
| Virginia Beach – Self Storage | $0.0 | 0.0% | 0.0% |
| Washington-Arlington-Alexandria, DC-VA-MD-WV MSA | $1,003.9 | 3.5% | 0.9% |
| Washington, DC – Hotel | $41.8 | 3.8% | 0.9% |
| Washington, DC – Industrial | $0.0 | 0.0% | 0.0% |
| Washington, DC – Multifamily | $0.0 | 0.0% | 0.0% |
| Washington, DC – Office | $789.0 | 10.0% | 1.5% |
| Washington, DC – Other | $38.6 | 2.8% | 0.1% |
| Washington, DC – Retail | $134.3 | 3.8% | -0.1% |
| Washington, DC – Self Storage | $0.0 | 0.0% | 0.0% |
| Grand Total | $28,090.0 | 4.3% | 0.8% |
About CRED iQ
CRED iQ is a commercial real estate data, analytics, and valuation platform providing actionable intelligence to CRE and capital markets investors. Subscribers use the platform to identify valuable leads for leasing, lending, refinancing, distressed debt, and acquisition opportunities.
The platform also offers a highly efficient valuation engine which can be leveraged across all property types and geographies. Our data platform is powered by over $2.0 trillion in transactions and data covering CRE, CMBS, CRE CLO, Single Asset Single Borrower (SASB), and all of GSE / Agency.
