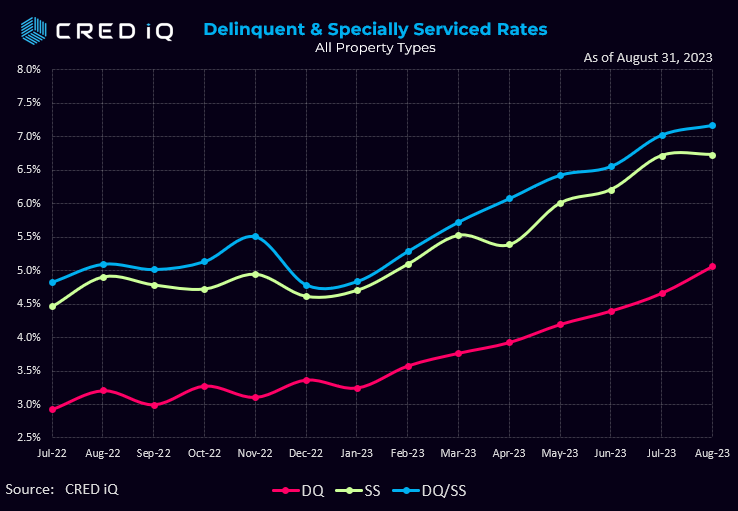
The CRED iQ CMBS delinquency rate has continued to rise, reaching 5.07% in August 2023. This represents a 40 basis point (0.40%) increase from a month prior, and an 177 basis point increase since January 2023. Notably, 62% of the newly delinquent loans, based on their outstanding balance, were a result of maturity defaults or refinancing challenges.

CRED iQ’s special servicing rate, equal to the percentage of CMBS loans that are with the special servicer (delinquent or non-delinquent), increased modestly month-over-month to 6.73%, from 6.72%. The special servicing rate has continued to climb YTD 2023. Aggregating the two indicators of distress – delinquency rate and special servicing rate – the overall distressed rate (DQ + SS%) rose to 7.17% – an increase of 14 basis points. Last month’s distressed rate was equal to 7.03%, which was 14 basis points lower that the July 2023 distressed rate. The month-over-month increase in the overall distressed rate mirrors increases in the delinquency and special servicing rates. Distressed rates generally track slightly higher than special servicing rates as most delinquent loans are also with the special servicer.
By property type, distress in the office sector continued to build in August 2023. The office distressed rate for August is 9.36%, which compared to 8% as of July 2023. The month-over-month surge of 136 basis points in office delinquency was equal to a 17% increase. The natural progression of long to intermediate-term rolling leases coupled with ongoing refinancing difficulties at loan maturity have caused the velocity of new delinquencies to accelerate during 2023.
An example of why office delinquency rates have gone up significantly month over month can be seen with 995 Market Street in San Francisco. This loan was part of the LSTR 2016-4 transaction and had a balance of $45 million. On July 21, 2023, it was transferred to Special Servicing, and currently, it’s 30-59 days behind in payments.
What’s important to note here is that the Special Servicer reports that the borrower hasn’t paid for July and has indicated they won’t make any more payments. Unfortunately, this situation is likely to continue as office vacancies increase, and Net Absorption (the rate at which office space is being occupied) continues to decline.
In August, Distressed rates for different types of properties showed the following changes:
- Retail Distressed rates decreased slightly from 10.74% in July to 10.66% in August, an 8 basis point drop.
- Multifamily Distressed rate increased slightly, rising by 31 basis points to reach 4.96% in August.
- Lodging Distressed rate improved slightly in August, dropping by 6 basis points to 7.69%. This improvement is due to increased business and leisure travel, which has now surpassed pre-pandemic levels.
CRED iQ’s CMBS distressed rate (DQ + SS%) by property type accounts for loans that qualify for either delinquent or special servicing subsets. This month, the overall distressed rate for CMBS increased to 6.56%. The increase was 13 basis points higher than May’s distressed rate (6.43%), equal to a 2% increase. A severely limited refinancing market for office properties and a ‘higher for longer’ interest rate environment continues to contribute to sustained increases in commercial real estate distress.It’s important to clarify that the delinquency rate is calculated as the percentage of all delinquent loans, whether specially serviced or non-specially serviced, in CRED iQ’s sample universe of $600+ billion in CMBS conduit and single asset single-borrower (SASB) loans
About CRED iQ
CRED iQ is a commercial real estate data, analytics, and valuation platform providing actionable intelligence to CRE and capital markets investors. Subscribers use the platform to identify valuable leads for leasing, lending, refinancing, distressed debt, and acquisition opportunities.
The platform also offers a highly efficient valuation engine which can be leveraged across all property types and geographies. Our data platform is powered by over $2.0 trillion in transactions and data covering CRE, CMBS, CRE CLO, Single Asset Single Borrower (SASB), and all of GSE / Agency.