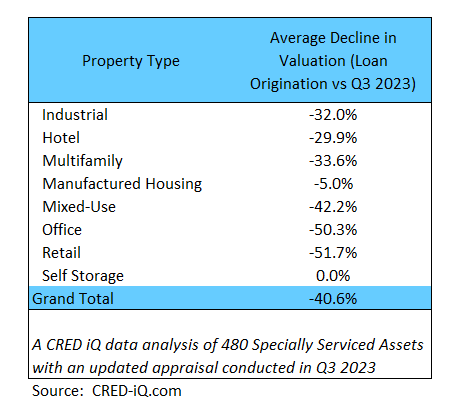
CRED iQ analyzed 480 properties that were re-appraised in 2023. The Top 25 Valuation declines all received an updated appraisal in Q3 2023. Each of these properties were either delinquent or with the special servicer.
In total, the average decline in value compared to the original valuation at issuance was 41.6% – a very slight overall increase of four basis points over our first half 2023 report.
Sector Perspectives
Notable changes appeared in the ranking by property type. Notably Industrial jumps from 6th place in first half report to 1st place in Q3.

- By property Type, office and retail had the highest percentage-based declines . Office averaged a 50.3% decline, while retail properties averaged 51.7% decline across the sample set of CRED iQ data.
- The office average decline is slightly up from our last analysis in July when office valuations declined 48.7% on average.
- Comparing Q2 2023 with our current analysis, the average multifamily valuation decline deteriorated this quarter from 22.0% to 33.6%. Likewise Industrial dropped from a 21.2% decline to a 32% decline in Q3
- Self-storage remains the strongest asset class with no specially serviced or delinquent loans reporting a decline in value this year.
Here are the most notable properties that made our Q3 list:
1740 Broadway, New York City
CRED iQ first alerted the industry of this distressed 604,000 square foot office tower in Manhattan back in March 2002 when it first defaulted. The property topped our list with a stunning valuation loss of $430 million, or 71.1% of its value. At origination, the collateral was valued at $605 million ($1,002/SF). Its latest appraisal posted a valuation of just $175 million ($290/SF).
229 West 43rd Street, New York City
This property topped our list of valuation drops in our first half 2023 report. A 248,457 square foot apartment/retail mixed use property lost $386 million in valuation since origination or 82.1%
Woodbridge Center: Woodbridge, New Jersey
Holding its grip on third place in our study is this 1.1 million square foot mall in NJ which lost 76.5% of its valuation, or $280 million.
Nema: San Francisco, California
This 754-unit apartment complex cracks the top 5 for the multifamily category—seeing its valuation at origination of $543.6 million decline by 48.7% to $279 million—a reduction of $264.6 million.
Park Place Mall: Tucson AZ
Our second of two malls in the top five, this 478,333 square foot retail property lost 72,2% of its value from its origination of $313 million to $87 million. On a price per square foot basis, the mall’s valuation is at $182/SF, a significant drop from $654/SF at loan origination in 2011.
As we stated in our first half report, the current market conditions are having a significant impact on the valuation of commercial real estate properties across all asset classes. Our overall valuation declines remained mostly flat compared to our first half report. The most notable developments in Q3 were at the property type level with Industrial and Multifamily seeing their sector loss percentages grow by ~ 11% each.
Please look for our year-end valuation report in December.