

As of October 2025, the multifamily sector continues to show resilience amid evolving economic conditions, with strong origination volumes in key metropolitan statistical areas (MSAs). Drawing from CRED iQ’s proprietary rankings—based on total multifamily units from loans originated in 2025, total loan amounts, and aggregate property values—this blog explores the leading markets for apartment investments. We also spotlight recent multifamily loan comparables (comps) to provide granular insights into loan terms, property valuations, financial performance, and underwriting metrics. This analysis underscores opportunities in high-demand urban and suburban markets, where investor interest remains robust despite rising interest rates.
Market Rankings: Where Multifamily Investment is Thriving
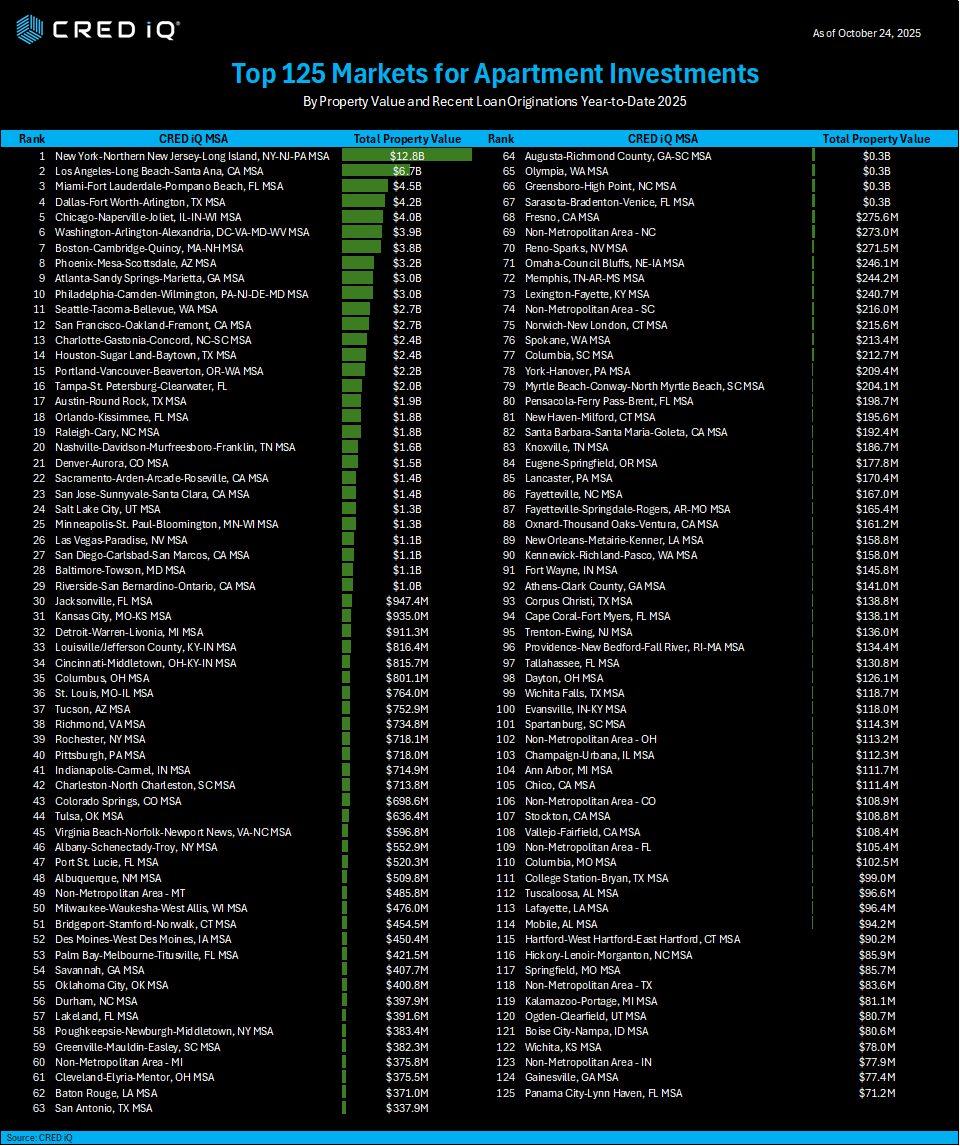
CRED iQ’s rankings highlight the MSAs with the highest activity in multifamily lending for 2025. These metrics reflect not just origination volume but also the scale of underlying assets, offering a proxy for market depth and investor confidence. The top-ranked markets are dominated by large coastal and Sun Belt cities, where population growth, job markets, and rental demand drive investment.
Key observations from these rankings:
- Coastal Dominance: New York and Los Angeles lead with massive scale, accounting for over $9 billion in combined originations and nearly 47,000 units. These markets benefit from dense populations and limited supply, supporting higher property values (e.g., New York’s aggregate value exceeds $12.8 billion).
- Sun Belt Surge: Texas and Florida MSAs (Dallas, Miami, Houston) feature prominently, driven by migration trends and economic expansion. Dallas ranks fourth with 26,765 units, reflecting robust development in affordable and mid-tier apartments.
- Midwest and West Coast Resilience: Chicago and Phoenix round out the top 10, with Phoenix’s lower property values per unit indicating opportunities in value-add investments.
- Overall Trends: Total loan originations across the top 25 MSAs exceed $50 billion, with an average LTV implied around 60-65% based on comps (discussed below). Smaller markets like Raleigh (rank 19) and Nashville (rank 20) show emerging potential, with property values growing due to tech and entertainment sectors.
These rankings suggest investors should prioritize markets with high unit counts and origination volumes for liquidity and diversification, while monitoring interest rate impacts on cap rates.
Recent Multifamily Loan Comps: Terms, Values, Financials, and Underwriting
To complement the market rankings, we examined recent Fannie Mae multifamily loan comps from 2025. These are primarily fixed-rate, interest-only or amortizing balloon loans, with terms ranging from 60-120 months. They highlight conservative underwriting amid higher rates, with average debt service coverage ratios (DSCR) of 1.4-1.7x and loan-to-value (LTV) ratios around 60-65%. Properties are often Class A/B multifamily assets built or renovated post-2000, with strong occupancy (90%+). Below, we highlight five representative comps, focusing on key metrics.
The Esplanade at Riverwalk, located in Riverside, California within the Riverside-San Bernardino-Ontario MSA ranked 29th, secured a $110.5 million fixed-rate loan at 5.23 percent with a paying rate of 4.38 percent, featuring a 60-month term as an interest-only balloon structure and a yield maintenance prepayment penalty for 54 months. The property is valued at $170 million as of 2024, encompassing 588 units constructed in 2004. Its financials include an underwriting net cash flow debt service coverage ratio of 1.51x, an implied underwriting net cash flow debt yield of 7.5 percent, and monthly debt service of approximately $498,000, alongside a preceding year effective gross income of $15.6 million, net cash flow of $8.8 million, and 95 percent occupancy. Underwriting for this Tier 2 acquisition loan reflects a 65 percent loan-to-value ratio, with green certification under Green Globes emphasizing sustainability, and conservative metrics that account for California’s high-cost market while supported by strong cash flows from its leasehold interest.
The Corners Apartments at Brier Creek in Durham, North Carolina, part of the Raleigh-Cary MSA ranked 19th, obtained a $35 million fixed-rate loan at 4.45 percent with a paying rate of 3.91 percent, structured as a 60-month interest-only balloon with yield maintenance for 54 months. Valued at $71.1 million, the property includes 298 units built in 2022. Financial details show an underwriting net cash flow debt service coverage ratio of 2.08x and monthly debt service of about $134,000, with year-to-date effective gross income of $5.8 million, net cash flow of $3.3 million, and occupancy at 91.5 percent. The underwriting classifies it as a Tier 4 refinance with a 49.3 percent loan-to-value ratio, where the drop-eligible tier indicates flexibility, and the high debt service coverage ratio points to robust performance in North Carolina’s growing market, complemented by low restricted units at 6.71 percent for 50-60 percent area median income.
WaterCrest at City Center in Lenexa, Kansas, within the Kansas City MSA ranked 31st, features a $44.8 million fixed-rate loan at 5.14 percent with a paying rate of 4.59 percent, set for an 84-month term as an interest-only balloon with yield maintenance for 78 months. The property holds a $72.4 million value, comprising 306 units from 2014. Its financials encompass an underwriting net cash flow debt service coverage ratio of 1.70x and monthly debt service around $198,000, with preceding year effective gross income of $6.5 million, net cash flow of $4.0 million, and 93.4 percent occupancy. Underwriting positions it as a Tier 3 refinance with a 61.9 percent loan-to-value ratio, incorporating partial tax increment financing relief, and the metrics demonstrate balanced risk supported by high occupancy that bolsters stability in the Midwest.
Axis 3700 in Plano, Texas, situated in the Dallas-Fort Worth-Arlington MSA ranked fourth, carries a $43 million fixed-rate loan at 5.13 percent with a paying rate of 4.33 percent, structured over an 84-month term as an interest-only balloon with yield maintenance for 78 months. Valued at $68.2 million, it includes 300 units built in 2015. The financial profile features an underwriting net cash flow debt service coverage ratio of 1.48x and monthly debt service of roughly $190,000, along with preceding year effective gross income of $6.0 million, net cash flow of $3.3 million, and occupancy at 89.4 percent. As a Tier 2 acquisition with a 63.1 percent loan-to-value ratio and green certification, the underwriting aligns with Texas’s top-four market ranking through strong metrics, although the slightly lower occupancy highlights leasing dynamics specific to the area.
The Elysian at Post in Las Vegas, Nevada, within the Las Vegas-Paradise MSA ranked 26th, secured a $67.4 million fixed-rate loan at 4.83 percent with a paying rate of 4.04 percent, featuring a 60-month term as an interest-only balloon and yield maintenance for 54 months. The property is valued at $121.6 million, with 384 units constructed in 2024. Financials include an underwriting net cash flow debt service coverage ratio of 1.61x and monthly debt service of about $280,000, plus preceding year effective gross income of $8.3 million, net cash flow of $5.3 million, and 90.9 percent occupancy. Underwriting for this Tier 2 acquisition comes with a 55.4 percent loan-to-value ratio, where the new construction in a mid-ranked market underscores growth potential buffered by a conservative loan-to-value against volatility.
Common themes across these comps include fixed-rate structures with yield maintenance penalties (typically 54-78 months), favoring long-term holds. DSCRs average 1.6x, ensuring coverage amid rate hikes, while LTVs (55-65%) reflect prudent leverage. Green certifications appear in 40% of samples, tying into ESG trends. Financials show solid NCF yields (7-10%), with occupancies above 90% underscoring demand.
Key Takeaways and Outlook
CRED iQ’s 2025 rankings affirm the strength of major MSAs like New York, Los Angeles, and Dallas for multifamily investments, where high volumes signal liquidity and value appreciation. Recent loan comps reveal a market favoring conservative underwriting—lower LTVs, strong DSCRs, and green features—to mitigate risks. Investors eyeing acquisitions or refinances should focus on Sun Belt growth areas, monitoring occupancy and expense ratios for sustained performance. For deeper dives into specific deals or markets, contact CRED iQ for customized analytics.
About CRED iQ
CRED iQ is a market data provider that offers a robust suite of data and software solutions tailored for commercial real estate and finance professionals.
With over $2.3 trillion of CRE loans, CRED iQ delivers instant access to a comprehensive range of financial data and analytics for millions of properties in every market. CRED iQ’s data and analytical capabilities are instrumental in helping investors, lenders and brokers make informed and strategic decisions critical to their business.
THE DATA, INFORMATION AND/OR RELATED MATERAL (“DELIVERABLES”) IS BEING OFFERED AS-IS/WHERE-AS CONDITION. CRED-IQ MAKES NO REPRESENTATION OR WARRANTY AS TO QUALITY OR ACCURACY OF SUCH DELIVERABLES BEING PURCHASED, WHETHER EXPRESS OR IMPLIED, EITHER IN FACT OR BY OPERATION OF LAW, STATUTE, OR OTHERWISE, AND CRED-IQ SPECIFICALLY DISCLAIMS ANY AND ALL IMPLIED OR STATUTORY WARRANTIES INCLUDING WARRANTIES OF MERCHANTABILITY AND OF FITNESS FOR A PARTICULAR PURPOSE, TECHNICAL PERFORMANCE, AND NON-INFRINGEMENT. WITHOUT LIMITING THE FOREGOING, YOU AS CUSTOMER ACKNOWLEDGE THAT YOU HAVE NOT AND ARE NOT RELYING UPON ANY IMPLIED WARRANTY OF MERCHANTABILITY OR OF FITNESS FOR A PARTICULAR PURPOSE OR OTHERWISE, OR UPON ANY REPRESENTATION OR WARRANTY WHATSOEVER AS TO THE DELIVERABLES IN ANY REGARDS WHATSOEVER, AND ACKNOWLEDGE THAT CRED-IQ MAKES NO, AND HEREBY DISCLAIMS ANY, REPRESENTATION, WARRANTY OR GUARANTEE THAT THE PURCHASE, USE OR COMMERCIALIZATION OF ANY DELIVERABLES WILL BE USEFUL TO YOU OR FREE FROM INTERFERENCE. BY ACCEPTANCE OF THE DELIVERABLES, YOU HEREBY RELEASE CRED-IQ AND ITS AFFILIATES AND AGENTS FROM ALL CLAIMS, DAMAGES AND LIABILITY ARISING HEREUNDER.
