Home Blog Page 11

Extend and Pretend: Loan Modifications See the Fastest Growth, Along with Foreclosures

0

Troubled Loan Workout Strategies: Continuing our Series

The CRED iQ research team zeroed in on workout strategies –exploring trends and resolutions for CRE securitized loans so far in 2024. This analysis included the workout strategies across CMBS, SBLL, CRE CLO and Freddie loans.  Building upon our September report, our analysis compared the special servicer’s workout strategies from January 2024 with October 2024.  Our previous report explored the period of January 2024 to August 2024. Our analysis compared workout strategies across $64.3 billion in loan balances (5,488 loans) in January of 2024 with $79.1 billion (6,169 loans) in October of 2024. 

Top Workout Categories

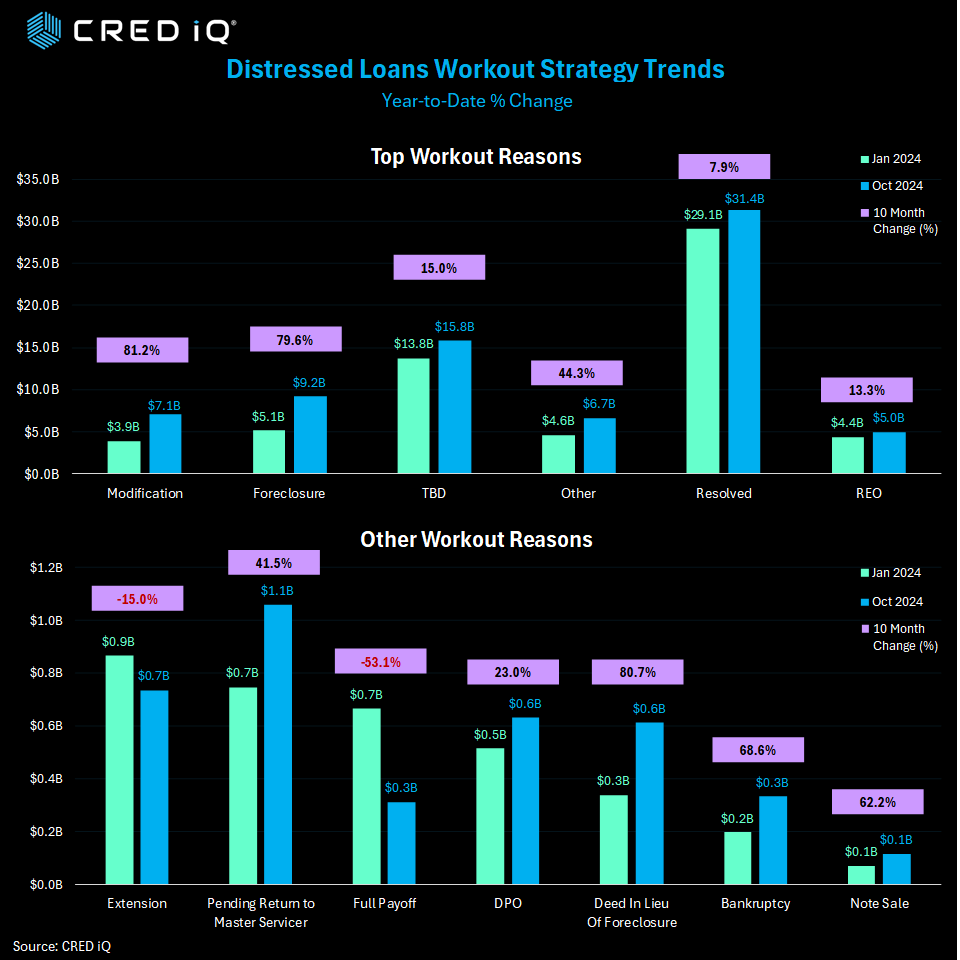
The top 4 workout strategies used by special servicers from this dataset includes:  1) Successful Resolution 2) Foreclosure and 3) Modification or 4) REO.

2024 YTD October, the so-called “extend and pretend” strategy reigns supreme, notching the fastest growth rate of all workout strategies.  Not surprisingly, loan modifications grew by 81.2% since January of this year. 

Foreclosures are not far behind, with growth in that category reaching 79.6% this year, for the second most common workout strategy.

Full resolution (“Resolved”) was by far, the largest category by multiples, reaching $31.4B in October and seeing a 2024 category growth rate of 7.9%.

Finally, REO, the fourth largest category crested over $5.0 billion in October, with a 13.3% growth rate vs. January (ranking third in growth rates across the major workout reasons). 

Other Workout Reasons

Perhaps most notable across all categories was the 53.1% drop in full payoffs in October, compared to January.  Just $312.1 million in loans saw full payoffs in October, versus $700 million in January.

Extensions also saw a decrease since January, albeit more modest at 15%.  

The fastest growing strategies in this secondary category of Other Workout Reasons, were Deed in Lieu of Foreclosure (80.7% increase), Bankruptcy (68.6% increase) and Note Sale (62.2% increase).

Notable Workout Example

Chelsea Gardens, a 474-unit multifamily property in the Atlanta market, is backed by a $37.1 million CRE CLO loan. The loan transferred to the special servicer in October 2024 due to non-monetary default and is expected to undergo foreclosure as the workout strategy.  The loan fell 90 days delinquent in November 2024. The loan is scheduled to mature in February 2025 with an extended maturity date of February 2026.

The Chelsea Garden was appraised for $44.2 million ($93,249/unit) at origination in December 2021. The value of the asset has increased to $55.1 million ($116,245/unit) in February 2024. The asset had a below breakeven DSCR of 0.65 and was 82.7% occupied as of August 2024. 

About CRED iQ

CRED iQ is a market data provider that offers a robust suite of data and software solutions tailored for commercial real estate and finance professionals.


With over $2.3 trillion of CRE loans, CRED iQ delivers instant access to a comprehensive range of financial data and analytics for millions of properties in every market. CRED iQ’s data and analytical capabilities are instrumental in helping investors, lenders and brokers make informed and strategic decisions critical to their business.

Announcing WFCM 2024-5C2

0

A CRED iQ Preliminary Analysis

DATA HEREIN PROVIDED TO CRED IQ IS FROM A PRELIMINARY PROSPECTUS AND MAY BE AMENDED OR SUPPLEMENTED PRIOR TO TIME OF SALE

Deal Overview

The WFCM 2024-5C2 CMBS deal is a new issuance securitization for the CMBS market, with a total pooled balance of approximately $720.0 million. The deal is jointly managed by prominent financial institutions including Wells Fargo, Citigroup, Goldman Sachs, JP Morgan, and UBS. The deal is collateralized by 27 loans and secured by 138 properties across a variety of sectors, including retail, hospitality, and mixed use. The strategic geographic distribution of these properties ensures balanced exposure across major markets. The deal’s weighted average loan-to-value (LTV) ratio of 56.8%, and the weighted average mortgage interest rate is 6.35%.

Key Metrics

The loan pool for WFCM 2024-5C2 is structured to include a mix of amortizing and interest-only loans, with 22.0% of the mortgage pool having scheduled amortization. The remainder of the pool (78.0%) consists of interest-only payments throughout the loan term, offering investors a steady income stream. The pool boasts a weighted average debt service coverage ratio (DSCR) of 1.87x. The weighted average net operating income (NOI) debt yield is 12.9%.

Geography & Property Types

A key strength of the WFCM 2024-5C2 CMBS deal is its diverse property type distribution, which enhances portfolio resilience. Retail properties, including anchored, super regional mall, and single tenant subtypes constitute 20.3% of the total balance, while hotel properties account for 17.2% of the balance. The geographic distribution of the properties across prime markets, including high-growth areas in New York City, Sacramento, and Detroit.

About CRED iQ

CRED iQ is a market data provider that offers a robust suite of data and software solutions tailored for commercial real estate and finance professionals.

With over $2.3 trillion of CRE loans, CRED iQ delivers instant access to a comprehensive range of financial data and analytics for millions of properties in every market. CRED iQ’s data and analytical capabilities are instrumental in helping investors, lenders and brokers make informed and strategic decisions critical to their business.

THE DATA, INFORMATION AND/OR RELATED MATERAL (“DELIVERABLES”) IS BEING OFFERED AS-IS/WHERE-AS CONDITION. CRED-IQ MAKES NO REPRESENTATION OR WARRANTY AS TO QUALITY OR ACCURACY OF SUCH DELIVERABLES BEING PURCHASED, WHETHER EXPRESS OR IMPLIED, EITHER IN FACT OR BY OPERATION OF LAW, STATUTE, OR OTHERWISE, AND CRED-IQ SPECIFICALLY DISCLAIMS ANY AND ALL IMPLIED OR STATUTORY WARRANTIES INCLUDING WARRANTIES OF MERCHANTABILITY AND OF FITNESS FOR A PARTICULAR PURPOSE, TECHNICAL PERFORMANCE, AND NON-INFRINGEMENT. WITHOUT LIMITING THE FOREGOING, YOU AS CUSTOMER ACKNOWLEDGE THAT YOU HAVE NOT AND ARE NOT RELYING UPON ANY IMPLIED WARRANTY OF MERCHANTABILITY OR OF FITNESS FOR A PARTICULAR PURPOSE OR OTHERWISE, OR UPON ANY REPRESENTATION OR WARRANTY WHATSOEVER AS TO THE DELIVERABLES  IN ANY REGARDS WHATSOEVER, AND ACKNOWLEDGE  THAT CRED-IQ MAKES NO, AND HEREBY DISCLAIMS ANY, REPRESENTATION, WARRANTY OR GUARANTEE THAT THE PURCHASE, USE OR COMMERCIALIZATION OF ANY DELIVERABLES WILL BE USEFUL TO YOU OR FREE FROM INTERFERENCE. BY ACCEPTANCE OF THE DELIVERABLES, YOU HEREBY RELEASE CRED-IQ AND ITS AFFILIATES AND AGENTS FROM ALL CLAIMS, DAMAGES AND LIABILITY ARISING HEREUNDER.

CRE CLO Distress Rate Trends Downwards to 12.1%

0

The CRED iQ research team focused upon  CRE CLO distress this week.  We wanted to explore how this marketplace has evolved since our previous report last month.  The CRED iQ Distress rate gave back 97 basis points (falling to 12.1% from 13.07%) during the month,  after adding  277 BP in our October print.  In comparison to the CMBS Distress Rate of 9.6%, the CRE CLO sector remains by 250 basis points. 

The CRED iQ distress rate includes any loan reported 30 days delinquent or worse, past their maturity, specially serviced, or a combination of these.  We also examined the most recent property-level net operating income figures and compared them to underwritten expectations.

Given the rapid surge in interest rates, these floating-rate loans have shown significant declines in debt-service-coverage-ratios (DSCR).  47.0% of the properties within the distressed CRE CLO sector have reported a lower DSCR (NCF) compared to their underwritten DSCR.  These numbers are based on the underwritten “as is” DSCRs and net operating income (NOI). 

CRED iQ’s analysis uncovers that 67.1% of all distressed CRE CLOs are operating below a 1.00 DSCR, up from 62.3% last month. NOI is a key variable in calculating a loan’s DSCR which determines the strength and creditworthiness of a given loan.

Segment Analysis

Office continues its leadership in distress across all property types logging a distress rate of 18.4%, remaining mostly flat to last month’s print. While high, the office segment is off its 2024 distress peak of 21.3% in February.

Multifamily distress increased 140 basis points to 15.1% in October, compared to 13.7% last month. Multifamily remains firmly entrenched as the second most distressed segment.

Retail saw its distress rate decrease significantly from 11.1% to 7.2% — dropping two slots to the fourth most distressed CRE CLO property type. The hotel segment also saw a decrease in their distress rate to 7.7% and landing just above retail as the third most distressed CRE CLO property type.

Industrial saw a slight uptick to 1.7%, representing a 60-basis point increase from last month. Self-storage continued to operate without distress in October. 

Payment Status

Looking across payment status, 31.4% of loans are performing matured, with another 32.4% non-performing matured, meaning 63.8% of the CRE CLO loans in our study are past their maturity dates –down slightly from 64.3% in last month’s report.

Analysis Scope & Methodology

CRED iQ consolidated all of the loan-level performance data for every outstanding CRE CLO loan to measure the underlying risks associated with these transitional assets. Our team examined $70.8  billion in active CRE CLO loans. Many of these loans were originated in 2021 at times where cap rates were low, valuations high, low interest rates, and are starting to run into maturity issues given the spike in rates.

Some of the largest issuers of CRE CLO debt over the past five years include MF1, Arbor, LoanCore, Benefit Street Partners, Bridge Investment Group, FS Rialto, and TPG. The vast majority of the $79.1 billion in CRE CLO loans are structured with floating rates with 3-year loan terms equipped with loan extension options if certain financial hurdles are met.

About CRED iQ

CRED iQ is a market data provider that offers a robust suite of data and software solutions tailored for commercial real estate and finance professionals.


With over $2.3 trillion of CRE loans, CRED iQ delivers instant access to a comprehensive range of financial data and analytics for millions of properties in every market. CRED iQ’s data and analytical capabilities are instrumental in helping investors, lenders and brokers make informed and strategic decisions critical to their business.

Announcing BMARK 2024-V11

0

A CRED iQ Preliminary Analysis

DATA HEREIN PROVIDED TO CRED IQ IS FROM A PRELIMINARY PROSPECTUS AND MAY BE AMENDED OR SUPPLEMENTED PRIOR TO TIME OF SALE

Deal Overview

The BMARK 2024-V11 CMBS deal is a new issuance securitization for the CMBS market, with a total pooled balance of approximately $1.04 billion. The deal is jointly managed by prominent financial institutions including Deutsche Bank, Goldman Sachs, BMO, Barclays, and Citigroup. The deal is collateralized by 26 loans and secured by 62 properties across a variety of sectors, including retail, office, and multifamily. The strategic geographic distribution of these properties ensures balanced exposure across major markets. The deal’s weighted average loan-to-value (LTV) ratio of 54.7%, and the weighted average mortgage interest rate is 6.39%.

Key Metrics

The loan pool for BMARK 2024-V11 is structured to solely include interest-only loans, offering investors a steady income stream. The pool boasts a weighted average debt service coverage ratio (DSCR) of 1.84x. The weighted average net operating income (NOI) debt yield is 12.7%.

Geography & Property Types

A key strength of the BMARK 2024-V11 CMBS deal is its diverse property type distribution, which enhances portfolio resilience. Multifamily properties, including high rise, garden and mid rise subtypes constitute 23.2% of the total balance, while hotel properties account for 17.9% of the balance. The geographic distribution of the properties across prime markets, including high-growth areas in New York City, Atlanta, and Miami.

About CRED iQ

CRED iQ is a market data provider that offers a robust suite of data and software solutions tailored for commercial real estate and finance professionals.

With over $2.3 trillion of CRE loans, CRED iQ delivers instant access to a comprehensive range of financial data and analytics for millions of properties in every market. CRED iQ’s data and analytical capabilities are instrumental in helping investors, lenders and brokers make informed and strategic decisions critical to their business.

THE DATA, INFORMATION AND/OR RELATED MATERAL (“DELIVERABLES”) IS BEING OFFERED AS-IS/WHERE-AS CONDITION. CRED-IQ MAKES NO REPRESENTATION OR WARRANTY AS TO QUALITY OR ACCURACY OF SUCH DELIVERABLES BEING PURCHASED, WHETHER EXPRESS OR IMPLIED, EITHER IN FACT OR BY OPERATION OF LAW, STATUTE, OR OTHERWISE, AND CRED-IQ SPECIFICALLY DISCLAIMS ANY AND ALL IMPLIED OR STATUTORY WARRANTIES INCLUDING WARRANTIES OF MERCHANTABILITY AND OF FITNESS FOR A PARTICULAR PURPOSE, TECHNICAL PERFORMANCE, AND NON-INFRINGEMENT. WITHOUT LIMITING THE FOREGOING, YOU AS CUSTOMER ACKNOWLEDGE THAT YOU HAVE NOT AND ARE NOT RELYING UPON ANY IMPLIED WARRANTY OF MERCHANTABILITY OR OF FITNESS FOR A PARTICULAR PURPOSE OR OTHERWISE, OR UPON ANY REPRESENTATION OR WARRANTY WHATSOEVER AS TO THE DELIVERABLES  IN ANY REGARDS WHATSOEVER, AND ACKNOWLEDGE  THAT CRED-IQ MAKES NO, AND HEREBY DISCLAIMS ANY, REPRESENTATION, WARRANTY OR GUARANTEE THAT THE PURCHASE, USE OR COMMERCIALIZATION OF ANY DELIVERABLES WILL BE USEFUL TO YOU OR FREE FROM INTERFERENCE. BY ACCEPTANCE OF THE DELIVERABLES, YOU HEREBY RELEASE CRED-IQ AND ITS AFFILIATES AND AGENTS FROM ALL CLAIMS, DAMAGES AND LIABILITY ARISING HEREUNDER.

Announcing BBCMS 2024-C30

0

A CRED iQ Preliminary Analysis

DATA HEREIN PROVIDED TO CRED IQ IS FROM A PRELIMINARY PROSPECTUS AND MAY BE AMENDED OR SUPPLEMENTED PRIOR TO TIME OF SALE

Deal Overview

The BBCMS 2024-C30 CMBS deal is a new issuance securitization for the CMBS market, with a total pooled balance of approximately $846.5 million. The deal is jointly managed by prominent financial institutions Barclays, BMO, Bank of America, Deutsche Bank, Goldman Sachs, KeyBanc, and Societe Generale. The deal is collateralized by 41 loans and secured by 67 properties across a variety of sectors, including retail, office, and multifamily. The strategic geographic distribution of these properties ensures balanced exposure across major markets. The deal’s weighted average loan-to-value (LTV) ratio of 54.7%, and the weighted average mortgage interest rate is 6.37%.

Key Metrics

The loan pool for BBCMS 2024-C30 is structured to include a mix of amortizing and interest-only loans, with 17.9% of the mortgage pool having scheduled amortization. The remainder of the pool (82.1%) consists of interest-only payments throughout the loan term, offering investors a steady income stream. The pool boasts a weighted average debt service coverage ratio (DSCR) of 1.89x. The weighted average net operating income (NOI) debt yield is 12.9%.

Geography & Property Types

A key strength of the BBCMS 2024-C30 CMBS deal is its diverse property type distribution, which enhances portfolio resilience. Retail properties, including super regional mall, anchored, outlet center, and unanchored subtypes constitute 39.1% of the total balance, while office properties account for 13.7% of the balance. The geographic distribution of the properties across prime markets, including high-growth areas in New York City, Los Angeles, and Minneapolis.

About CRED iQ

CRED iQ is a market data provider that offers a robust suite of data and software solutions tailored for commercial real estate and finance professionals.

With over $2.3 trillion of CRE loans, CRED iQ delivers instant access to a comprehensive range of financial data and analytics for millions of properties in every market. CRED iQ’s data and analytical capabilities are instrumental in helping investors, lenders and brokers make informed and strategic decisions critical to their business.

THE DATA, INFORMATION AND/OR RELATED MATERAL (“DELIVERABLES”) IS BEING OFFERED AS-IS/WHERE-AS CONDITION. CRED-IQ MAKES NO REPRESENTATION OR WARRANTY AS TO QUALITY OR ACCURACY OF SUCH DELIVERABLES BEING PURCHASED, WHETHER EXPRESS OR IMPLIED, EITHER IN FACT OR BY OPERATION OF LAW, STATUTE, OR OTHERWISE, AND CRED-IQ SPECIFICALLY DISCLAIMS ANY AND ALL IMPLIED OR STATUTORY WARRANTIES INCLUDING WARRANTIES OF MERCHANTABILITY AND OF FITNESS FOR A PARTICULAR PURPOSE, TECHNICAL PERFORMANCE, AND NON-INFRINGEMENT. WITHOUT LIMITING THE FOREGOING, YOU AS CUSTOMER ACKNOWLEDGE THAT YOU HAVE NOT AND ARE NOT RELYING UPON ANY IMPLIED WARRANTY OF MERCHANTABILITY OR OF FITNESS FOR A PARTICULAR PURPOSE OR OTHERWISE, OR UPON ANY REPRESENTATION OR WARRANTY WHATSOEVER AS TO THE DELIVERABLES  IN ANY REGARDS WHATSOEVER, AND ACKNOWLEDGE  THAT CRED-IQ MAKES NO, AND HEREBY DISCLAIMS ANY, REPRESENTATION, WARRANTY OR GUARANTEE THAT THE PURCHASE, USE OR COMMERCIALIZATION OF ANY DELIVERABLES WILL BE USEFUL TO YOU OR FREE FROM INTERFERENCE. BY ACCEPTANCE OF THE DELIVERABLES, YOU HEREBY RELEASE CRED-IQ AND ITS AFFILIATES AND AGENTS FROM ALL CLAIMS, DAMAGES AND LIABILITY ARISING HEREUNDER.

Announcing BMO 2024-C10

0

A CRED iQ Preliminary Analysis

DATA HEREIN PROVIDED TO CRED IQ IS FROM A PRELIMINARY PROSPECTUS AND MAY BE AMENDED OR SUPPLEMENTED PRIOR TO TIME OF SALE

Deal Overview

The BMO 2024-C10 CMBS deal is a new issuance securitization for the CMBS market, with a total pooled balance of approximately $724.0 million. The deal is jointly managed by prominent financial institutions BMO, Citigroup, Deutsche Bank, and Goldman Sachs. The deal is collateralized by 28 loans and secured by 65 properties across a variety of sectors, including retail, industrial, and multifamily. The strategic geographic distribution of these properties ensures balanced exposure across major markets. The deal’s weighted average loan-to-value (LTV) ratio of 55.4%, and the weighted average mortgage interest rate is 6.11%.

Key Metrics

The loan pool for BMO 2024-C10 is structured to include a mix of amortizing and interest-only loans, with 5.1% of the mortgage pool having scheduled amortization. The remainder of the pool (94.9%) consists of interest-only payments throughout the loan term, offering investors a steady income stream. The pool boasts a weighted average debt service coverage ratio (DSCR) of 2.02x. The weighted average net operating income (NOI) debt yield is 12.8%.

Geography & Property Types

A key strength of the BMO 2024-C10 CMBS deal is its diverse property type distribution, which enhances portfolio resilience. Retail properties, including super regional mall, anchored, and single tenant subtypes constitute 39.0% of the total balance, while industrial properties account for 32.5% of the balance. The geographic distribution of the properties across prime markets, including high-growth areas in New York City, Riverside, CA, and Houston.

About CRED iQ

CRED iQ is a market data provider that offers a robust suite of data and software solutions tailored for commercial real estate and finance professionals.

With over $2.3 trillion of CRE loans, CRED iQ delivers instant access to a comprehensive range of financial data and analytics for millions of properties in every market. CRED iQ’s data and analytical capabilities are instrumental in helping investors, lenders and brokers make informed and strategic decisions critical to their business.

THE DATA, INFORMATION AND/OR RELATED MATERAL (“DELIVERABLES”) IS BEING OFFERED AS-IS/WHERE-AS CONDITION. CRED-IQ MAKES NO REPRESENTATION OR WARRANTY AS TO QUALITY OR ACCURACY OF SUCH DELIVERABLES BEING PURCHASED, WHETHER EXPRESS OR IMPLIED, EITHER IN FACT OR BY OPERATION OF LAW, STATUTE, OR OTHERWISE, AND CRED-IQ SPECIFICALLY DISCLAIMS ANY AND ALL IMPLIED OR STATUTORY WARRANTIES INCLUDING WARRANTIES OF MERCHANTABILITY AND OF FITNESS FOR A PARTICULAR PURPOSE, TECHNICAL PERFORMANCE, AND NON-INFRINGEMENT. WITHOUT LIMITING THE FOREGOING, YOU AS CUSTOMER ACKNOWLEDGE THAT YOU HAVE NOT AND ARE NOT RELYING UPON ANY IMPLIED WARRANTY OF MERCHANTABILITY OR OF FITNESS FOR A PARTICULAR PURPOSE OR OTHERWISE, OR UPON ANY REPRESENTATION OR WARRANTY WHATSOEVER AS TO THE DELIVERABLES  IN ANY REGARDS WHATSOEVER, AND ACKNOWLEDGE  THAT CRED-IQ MAKES NO, AND HEREBY DISCLAIMS ANY, REPRESENTATION, WARRANTY OR GUARANTEE THAT THE PURCHASE, USE OR COMMERCIALIZATION OF ANY DELIVERABLES WILL BE USEFUL TO YOU OR FREE FROM INTERFERENCE. BY ACCEPTANCE OF THE DELIVERABLES, YOU HEREBY RELEASE CRED-IQ AND ITS AFFILIATES AND AGENTS FROM ALL CLAIMS, DAMAGES AND LIABILITY ARISING HEREUNDER.

Announcing BANK5 2024-5YR11

0

A CRED iQ Preliminary Analysis

DATA HEREIN PROVIDED TO CRED IQ IS FROM A PRELIMINARY PROSPECTUS AND MAY BE AMENDED OR SUPPLEMENTED PRIOR TO TIME OF SALE

Deal Overview

The BANK5 2024-5YR11 CMBS deal is a new issuance securitization for the CMBS market, with a total pooled balance of approximately $795.4 million. The deal is jointly managed by prominent financial institutions including Morgan Stanley, Bank of America, JP Morgan, and Wells Fargo. The deal is collateralized by 33 loans and secured by 77 properties across a variety of sectors, including retail, mixed-use, and multifamily. The strategic geographic distribution of these properties ensures balanced exposure across major markets. The deal’s weighted average loan-to-value (LTV) ratio of 58.0%, and the weighted average mortgage interest rate is 6.34%.

Key Metrics

The loan pool for BANK5 2024-5YR11 is solely structured with interest-only loans, offering investors a steady income stream. The pool boasts a weighted average debt service coverage ratio (DSCR) of 1.71x. The weighted average net operating income (NOI) debt yield is 11.5%.

Geography & Property Types

A key strength of the BANK5 2024-5YR11 CMBS deal is its diverse property type distribution, which enhances portfolio resilience. Retail properties, including anchored, super regional mall, showroom, and single tenant subtypes constitute 35.6% of the total balance, while mixed use properties account for 16.5% of the balance. The geographic distribution of the properties across prime markets, including high-growth areas in New York City, Riverside, CA, and Boston.

About CRED iQ

CRED iQ is a market data provider that offers a robust suite of data and software solutions tailored for commercial real estate and finance professionals.

With over $2.3 trillion of CRE loans, CRED iQ delivers instant access to a comprehensive range of financial data and analytics for millions of properties in every market. CRED iQ’s data and analytical capabilities are instrumental in helping investors, lenders and brokers make informed and strategic decisions critical to their business.

THE DATA, INFORMATION AND/OR RELATED MATERAL (“DELIVERABLES”) IS BEING OFFERED AS-IS/WHERE-AS CONDITION. CRED-IQ MAKES NO REPRESENTATION OR WARRANTY AS TO QUALITY OR ACCURACY OF SUCH DELIVERABLES BEING PURCHASED, WHETHER EXPRESS OR IMPLIED, EITHER IN FACT OR BY OPERATION OF LAW, STATUTE, OR OTHERWISE, AND CRED-IQ SPECIFICALLY DISCLAIMS ANY AND ALL IMPLIED OR STATUTORY WARRANTIES INCLUDING WARRANTIES OF MERCHANTABILITY AND OF FITNESS FOR A PARTICULAR PURPOSE, TECHNICAL PERFORMANCE, AND NON-INFRINGEMENT. WITHOUT LIMITING THE FOREGOING, YOU AS CUSTOMER ACKNOWLEDGE THAT YOU HAVE NOT AND ARE NOT RELYING UPON ANY IMPLIED WARRANTY OF MERCHANTABILITY OR OF FITNESS FOR A PARTICULAR PURPOSE OR OTHERWISE, OR UPON ANY REPRESENTATION OR WARRANTY WHATSOEVER AS TO THE DELIVERABLES  IN ANY REGARDS WHATSOEVER, AND ACKNOWLEDGE  THAT CRED-IQ MAKES NO, AND HEREBY DISCLAIMS ANY, REPRESENTATION, WARRANTY OR GUARANTEE THAT THE PURCHASE, USE OR COMMERCIALIZATION OF ANY DELIVERABLES WILL BE USEFUL TO YOU OR FREE FROM INTERFERENCE. BY ACCEPTANCE OF THE DELIVERABLES, YOU HEREBY RELEASE CRED-IQ AND ITS AFFILIATES AND AGENTS FROM ALL CLAIMS, DAMAGES AND LIABILITY ARISING HEREUNDER.

CRED iQ’s Distress Rates Climbs Higher for All of CMBS in October

0

The CRED iQ research team evaluated payment statuses reported for each loan (securitized by CMBS financing), along with special servicing status as part of our monthly distress update.  Five of the six major property types that CRED iQ tracks climbed higher in October. 

The overall CRED iQ distress rate inched up in October by 5 basis points to 9.6% which sets another consecutive record high. CRED iQ’s specially serviced rate added three basis points to 8.7%.   Following a flat print last month, our delinquency rate rose from 6.8% to 7.2% during October.  

Segment Review

Following a 108-basis point increase in our September print, the office segment distress rate came in flat in this report at 14.8%.  As reported last month, the office distress rate has nearly tripled in the last 18 months.  Office remains at the top of all segments with respect to distress rate. 

Retails remains in the number two slot, with 11.7% distress rate,  a slight increase from last month’s print of 11.4%

Right behind retail, multifamily has an 11.0% distress rate—shaving two basis points during October.   Multifamily has experienced the sharpest distress increase of all property types in 2024.  The January 2024 multifamily distress rate was 2.6%, yielding a stunning 840 basis point increase in the distress rate over the course of the year.

The hotel segment distress rate increased from 8.6% to 9.0% during October, the fourth highest amongst all property types. 

The two segments with the highest month-over-month distress rate increases are the same two property types with the lowest distress rates.  Self-storage jumped from 2.4% to 3.6% and Industrial added 60 basis points to 1.2%. Two large SBLL loans (CGCMT 2021-PRM2 and BX 2020-VKNG) backed by self-storage and industrial portfolios fell delinquent as they failed to payoff at their October maturity date. Consequently, the CRED iQ detailed loan statuses for both loans fell to performing matured from current in September. 

Payment Status

Looking at the distressed loan payment status, 18.2% of the loans are current.  Additionally, 0.3% of loans are attributed to late (but in the grace period) and 6.1% of loans were late (but less than 30 days DQ). When we combine these three metrics 24.6% of all loans were current / late within the grace period / less than 30 days delinquent (a reduction of 100 basis points from last month)

Non-Performing Matured decreased from 42.3% to 39.9% (a 240 basis points decrease).     Meanwhile, performing Matured increased from 14.5% in our September report to 16.7% (a 220-basis point increase).   90+ Days Delinquent shaved 1 basis points in October to 12.7%.

Analysis Methodology

It’s important to note that CRED iQ’s distress rate factors in all CMBS properties that are securitized in conduits and single-borrower large loan deal types.  CRED iQ tracks Freddie Mac, Fannie Mae, Ginnie Mae, and CRE CLO loan metrics in separate analyses.

CRED iQ’s distress rate aggregates the two indicators of distress – delinquency rate and specially serviced rate – yielding the distress rate. The index includes any loan with a payment status of 30+ days delinquent or worse, any loan actively with the special servicer, and includes non-performing and performing loans that have failed to pay off at maturity.

About CRED iQ

CRED iQ is a market data provider that offers a robust suite of data and software solutions tailored for commercial real estate and finance professionals.

With over $2.3 trillion of CRE loans, CRED iQ delivers instant access to a comprehensive range of financial data and analytics for millions of properties in every market. CRED iQ’s data and analytical capabilities are instrumental in helping investors, lenders and brokers make informed and strategic decisions critical to their business.

Diving Deep into Data Centers

0

This week the CRED iQ Research team focused upon the hottest property type in CRE, the data center ecosystem. Our readers have suggested a deeper dive into this rapidly evolving segment and we are pleased to answer that call. 

Fueled largely by the anticipated computing capacity required for artificial intelligence (“AI”), major investments are being made around the globe to develop  data center facilities and related infrastructure. 

Amazon has estimates capital investments approaching $100 billion over the next decade on AI-focused data centers, on top of the investments already made on eCommerce data centers. 

Last month, the BBC confirmed that Blackstone is making a $13 billion investment in a single data center complex in England. 

Our team closely examined all the latest data center originations in 2024 and we zeroed in on one of those to profile and delve deeper.  We wanted to understand the underlying metrics of a typical data center loan transaction in this marketplace along with signs for trends to come.   

Data Center Profile

A major data center complex located in Elk Grove Village, IL, just outside Chicago’s Ohare Airport.  Chicago is home to one of the world’s largest concentration of data centers with more than 747 MW of information technology capacity and 4.4 million square feet of space.

In the transaction, GI partners will acquire 75% of the borrower and contribute $202.5 million of new cash equity into a new joint venture.  Digital Realty Trust L.P. (DLR), who previously owned 100% of the borrower, will maintain a 25% stake. 

The asset was valued at $463 million, or $1,412/ per square foot or $17,277/per total kW capacity.   Underwritten NOI amounted to $96/SF and approximately $1,181/kW.  Tenants are paying between $88/SF and $157/SF in rent.  On a kW basis, tenants at the property are paying between $1,141/kW and $1,657/kW.  CRED iQ captures all data center activity and maintains ongoing financial and performance updates.

About CRED iQ

CRED iQ is a market data provider that offers a robust suite of data and software solutions tailored for commercial real estate and finance professionals.

With over $2.3 trillion of CRE loans, CRED iQ delivers instant access to a comprehensive range of financial data and analytics for millions of properties in every market. CRED iQ’s data and analytical capabilities are instrumental in helping investors, lenders and brokers make informed and strategic decisions critical to their business.

CMBS Underwriting Trends – October 2024

0

The CRED iQ research team focused upon the underwriting of the latest market transactions.  We wanted to understand they key loan metrics across this universe to get a real-time sense of the current environment and trending.      

CRED iQ analyzed underwriting metrics for the latest 8 new issue CMBS conduit deals issued since our previous report in July. 

We reviewed 499 properties associated with 304 new loans totaling just over $7 billion in loan originations. Our analysis examined interest rates, loan-to-values (“LTV”), debt yields, and CRED iQ cap rates.  We further broke down these statistics by property type.

The average interest rate across all loans and property types was 6.6%, average LTV was 54.9%, implied cap rates averaged 6.34% with debt yields averaging 14.0%.

Not surprisingly our analysis confirmed interest rate reductions across all property types  since our July report.   Reductions ranged from 1.8% in mixed-use to industrial’s reduction of 8.8%.

Apart from Industrial and Manufactured Housing, LTV levels notched decreases in all other property types.   Cap rates saw reductions in 5 of 8 property types. Debt yields were a mixed bag with surges in multifamily and self-storage.


Office

The office segment saw interest rates drop 42 basis points from 7.32 to 6.90%.  Debt yields increased from 12.09% to 13.19%.  LTV levels dropped from 59.2% to 55.4% while cap rates increased from 7.02% to 7.16% since our July analysis.

In total, 35 properties (of the 499 total in our analysis) were secured by office assets, comprising a total loan balance of $999.9 million. 

Multifamily

The multifamily sector’s average interest rate dropped from 6.70% to 6.55%, a 15-basis point change. Debt yields decreased from 10.38% to 9.93%.  LTV levels dropped from 62.5% to 53.7% while cap rates declined from 6.00% to 5.77% since our July report.

There were 122 properties secured by multifamily properties totaling $1.6 billion in new loan originations. 

Retail

Retail interest rates dropped from 6.87% to 6.58% on average in the last 3 months ago. However, average cap rates for the retail sector increase from 6.16% to 6.45%.  The average debt yield declined from 12.28% to 11.55% while average LTVs went from 57.3% to 56.7% since the July print.   

The retail segment had a total of $1.4 billion. In total, 60 properties were secured by retail properties.

About CRED iQ

CRED iQ is a market data provider that offers a robust suite of data and software solutions tailored for commercial real estate and finance professionals.


With over $2.3 trillion of CRE loans, CRED iQ delivers instant access to a comprehensive range of financial data and analytics for millions of properties in every market. CRED iQ’s data and analytical capabilities are instrumental in helping investors, lenders and brokers make informed and strategic decisions critical to their business.

2,085FollowersFollow
6SubscribersSubscribe