Troubled Loan Workout Strategies: A Special September Report
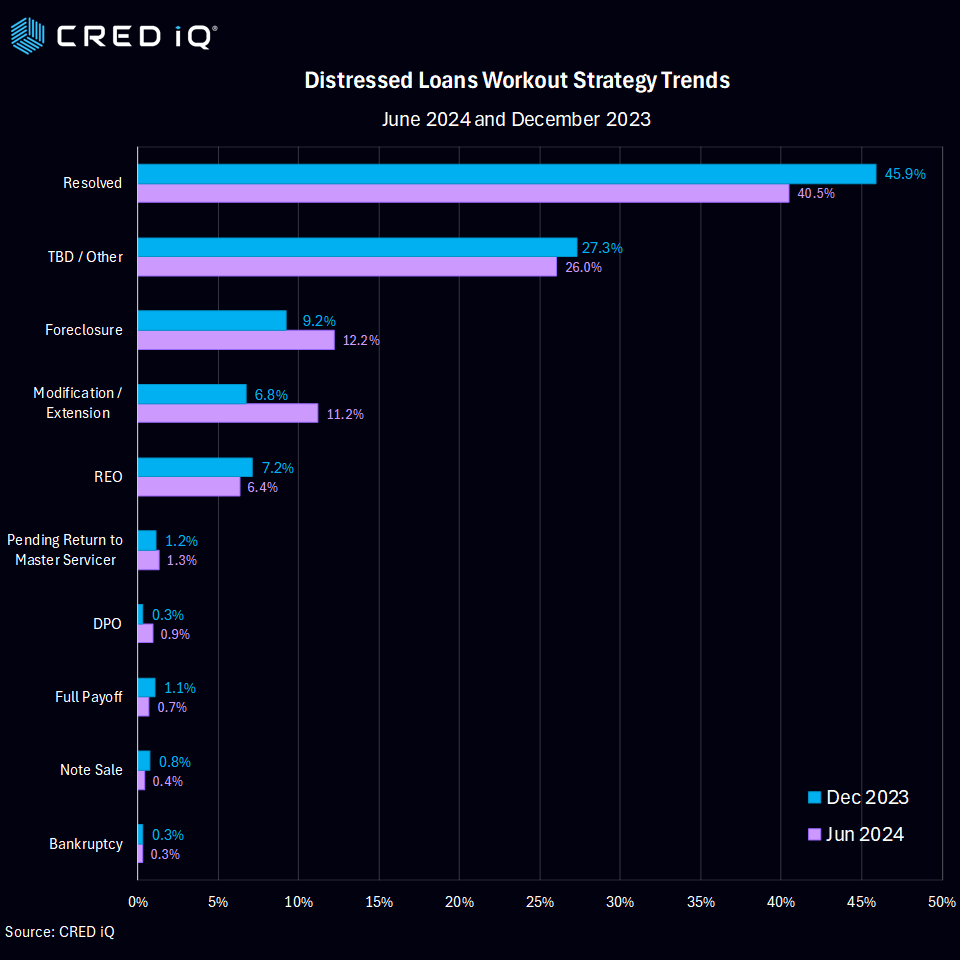
This week, our CRED iQ research team explored trends in workouts and resolutions for CRE securitized loans so far in 2024. This analysis included the workout strategies across CMBS, SBLL, CRE CLO and Freddie loans. Building upon our August report, our analysis compared the special servicer’s workout strategies from January 2024 with August 2024. Our previous report explored the period of December of 2023 to June 2024.
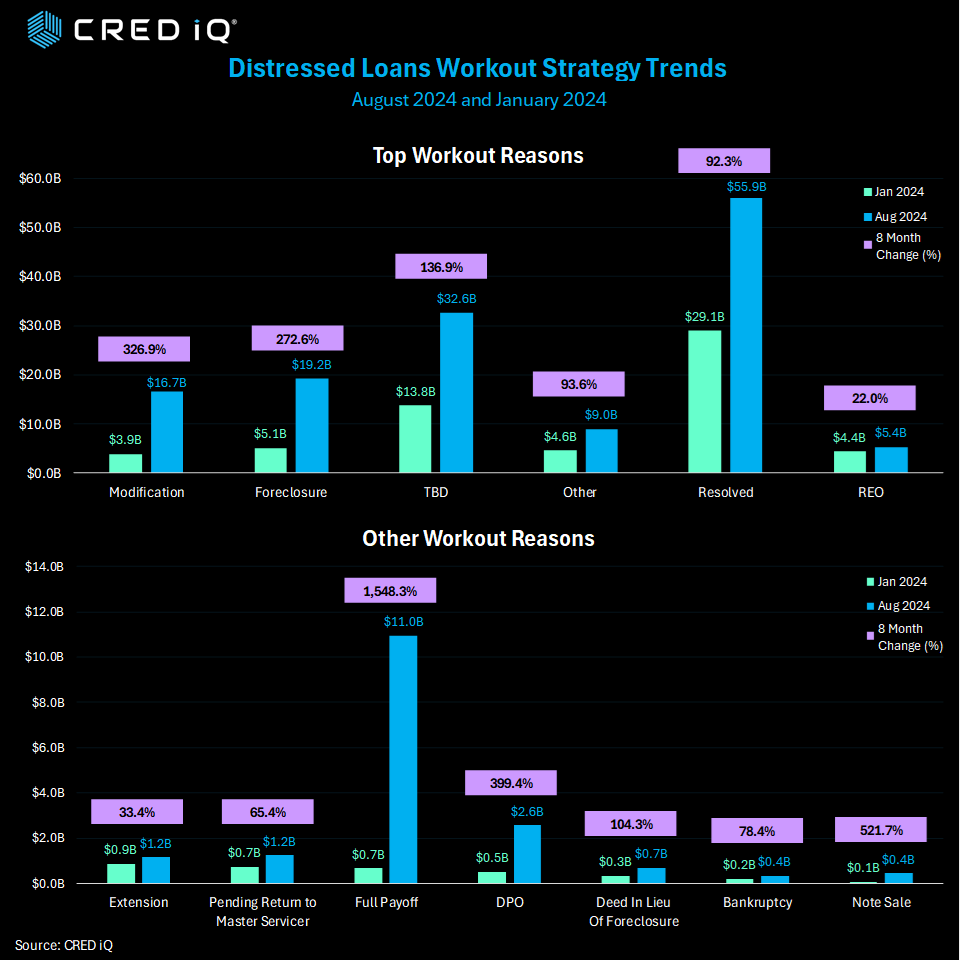
Our analysis compared workout strategies across $64.3 billion in loan balances (5,488 loans) in January of 2024 with $156.2 billion (6,351 loans) in August of 2024. The top 4 workout strategies used by special servicers from this dataset includes: 1) Successful Resolution 2) Foreclosure and 3) Modification or 4) or REO.
Perhaps the most striking metric is the January through August growth in full payoffs. From under a billion in January to $11.0 billion in August— full payoffs saw a massive 1,548.3% increase.
As we compare the January to the August data in other categories, maturity extensions and loan modifications, or the so called “extend and pretend” category continued to grow —rising 326.9% to $16.7 billion.
Foreclosures grew 272.6% in the period — reaching $19.2 billion in August.
After seeing a drop in REO in last month’s print (December 2023- June 2024 evaluation period), REO notched a 22% increase in this analysis, as July and August offset the previous drop.
Considering that resolved loans nearly doubled in the period (92.3%) to $55.9 billion while the full payoff category saw such explosive growth (1,548.3%) to $11.0 billion, there are positive trends represented in this analysis.
Notable Workout Example
The Coastland Center, a 468,926 SF regional mall in Naples, FL, is backed by a $96.0 million conduit loan. The loan transferred to the special servicer in July 2024 due to the upcoming August 2024 maturity date. Servicer commentary indicates a forbearance agreement was executed extending the maturity to May 2025.
Built in 1977 and renovated in 2007, the mall was appraised for $233.0 million ($508/sf) at origination in October 2012. The value of the asset has since decreased by 66.8% in February 2024 when it was appraised at $77.4 million ($169/SF). Coastland Center had a DSCR of 1.14 and was 96.0% occupied as of March 2024.
About CRED iQ
CRED iQ is a market data provider that offers a robust suite of data and software solutions tailored for commercial real estate and finance professionals.
With over $2.3 trillion of CRE loans, CRED iQ delivers instant access to a comprehensive range of financial data and analytics for millions of properties in every market. CRED iQ’s data and analytical capabilities are instrumental in helping investors, lenders and brokers make informed and strategic decisions critical to their business.