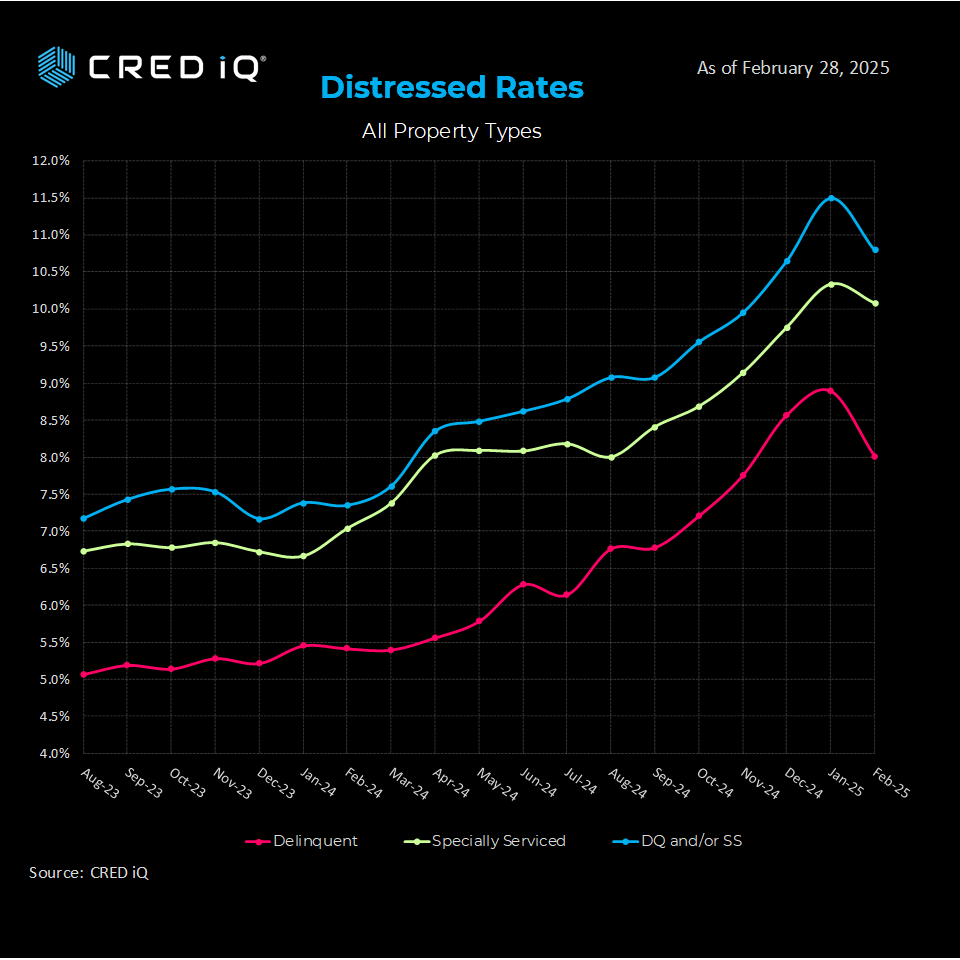
The CRED iQ research team evaluated payment statuses reported for each loan (securitized by CMBS financing), along with special servicing status as part of our monthly distress update.
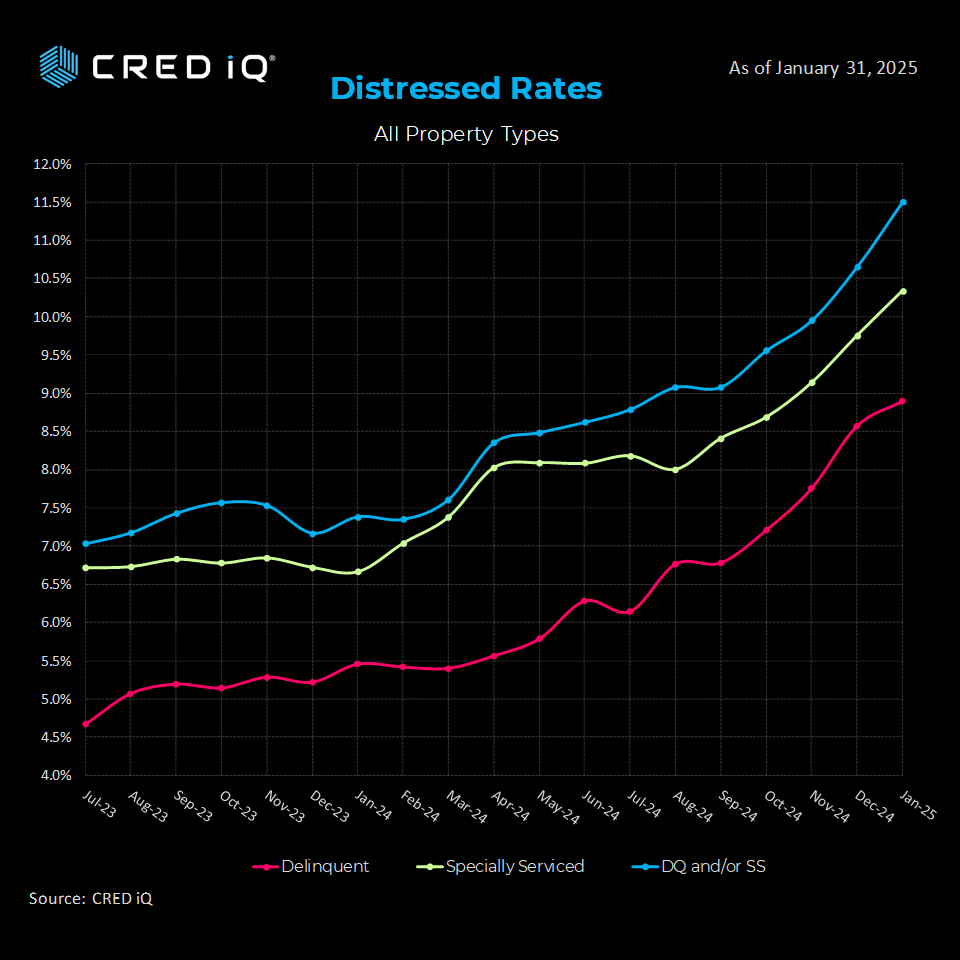
The CRED iQ overall distress rate fell by 70 basis points to 10.8%, breaking a streak of four record highs through last month’s print. CRED iQ’s other distress metrics also notched month-over-month reductions. The CRED iQ delinquency rate fell from from 8.9% in the January print to 8.0%. The CRED iQ special serving rate shaved 20 points this month and now stands at 10.1%. One year ago, delinquency and special servicing rates were 5.4% and 7.0% respectively.
Segment Review
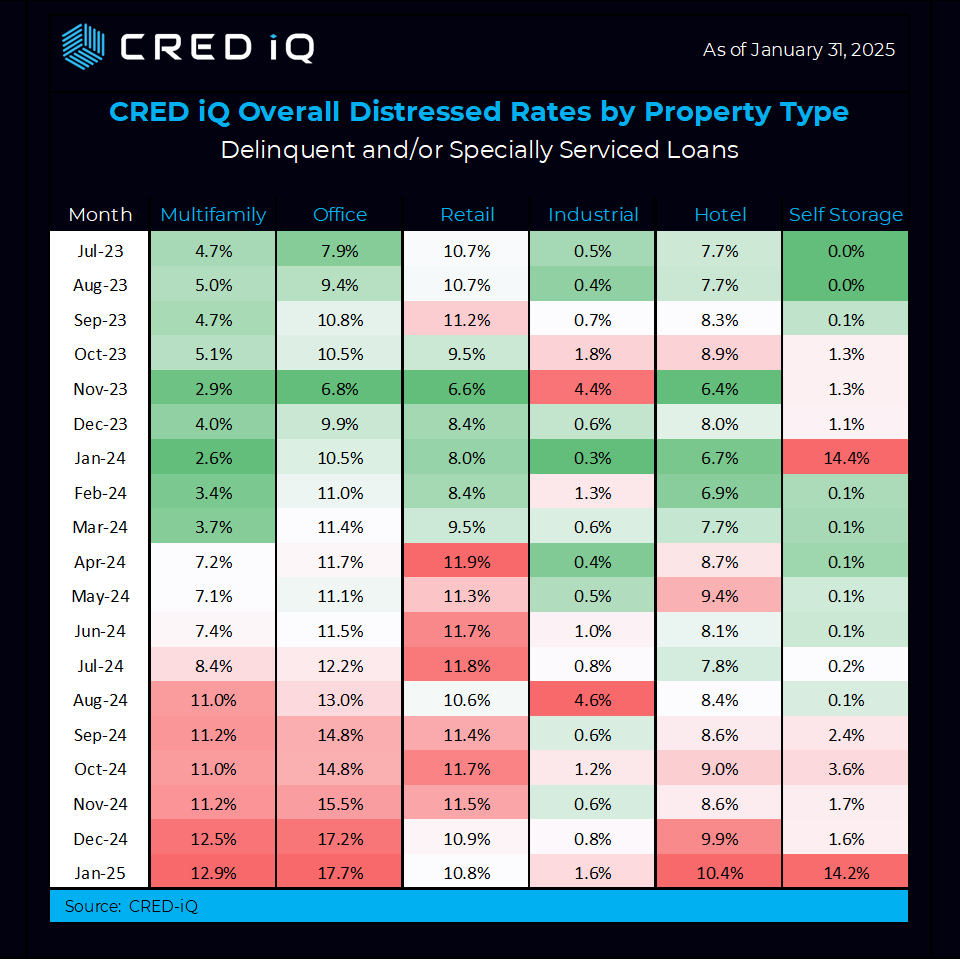
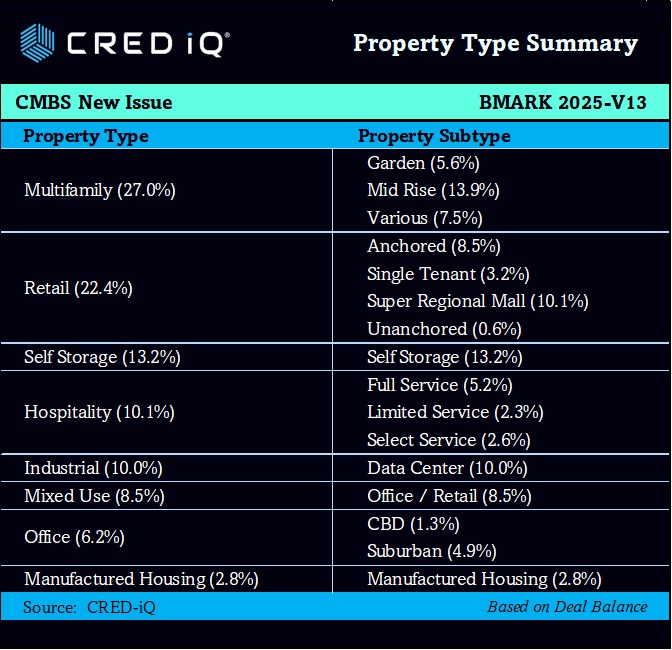
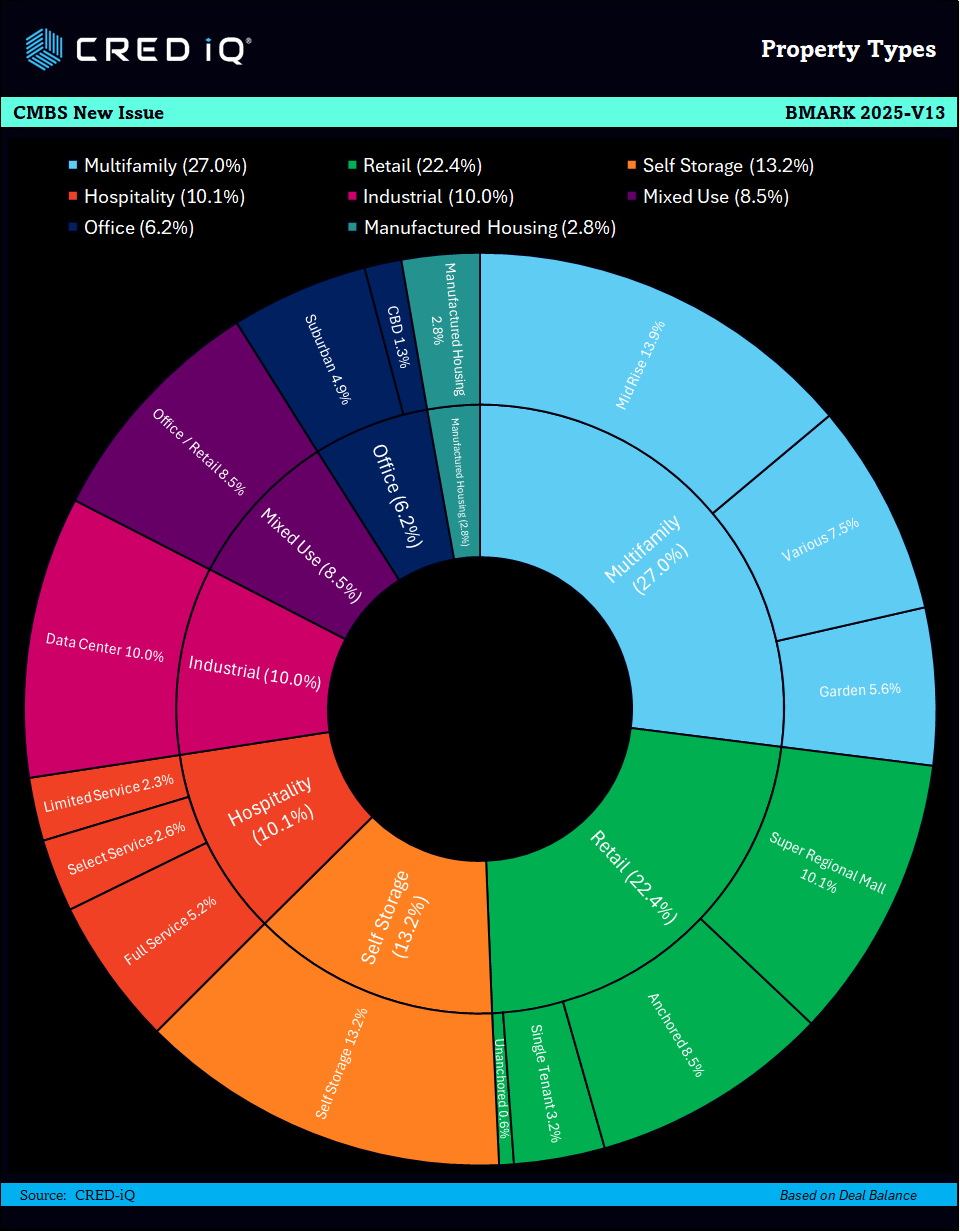
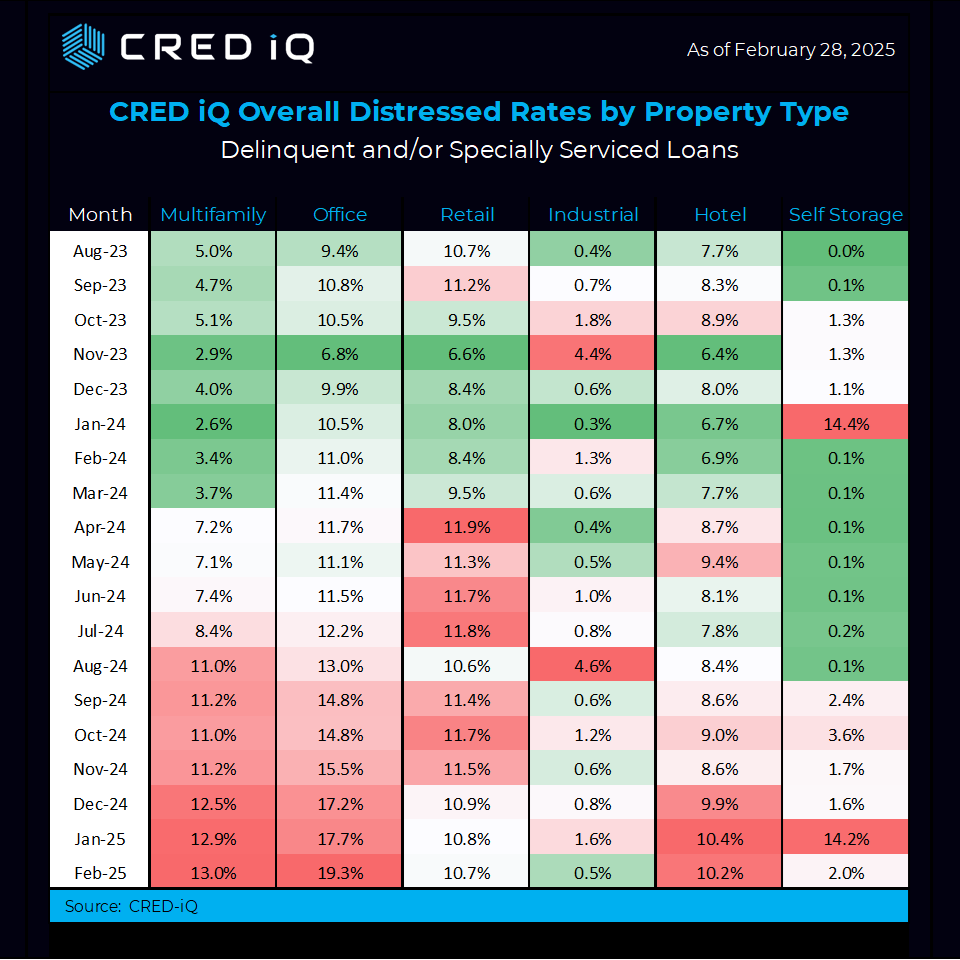
The office sector nearly matched December’s increase, which was the largest by far in 2024. Office missed that mark by only 10BP, tacking on 160 BP since last month to reach a record 19.3% distress rate. Office continues to bolster a commanding lead as the most distressed property type
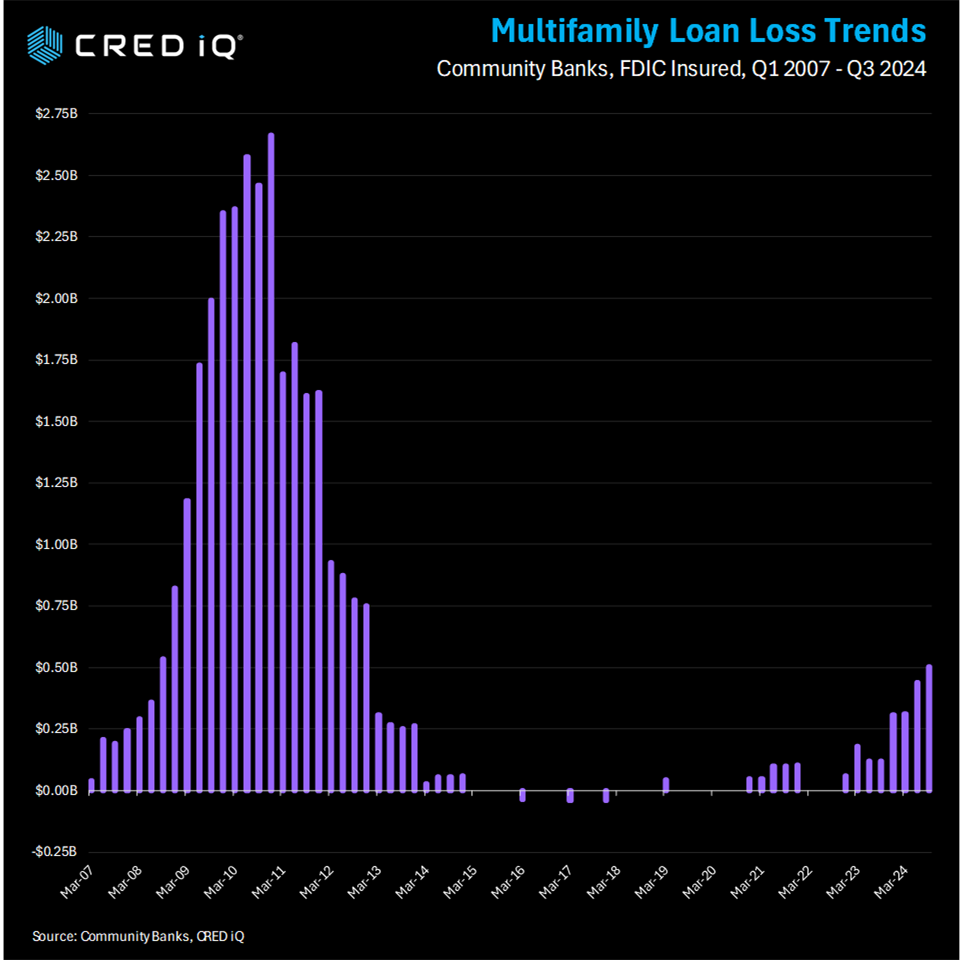
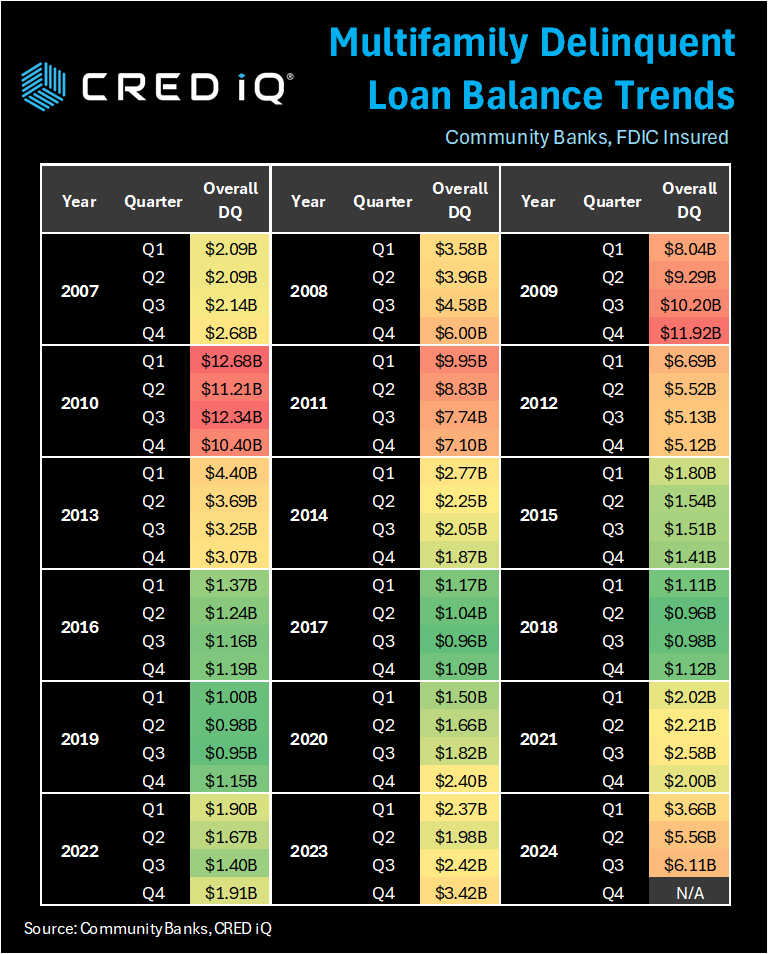
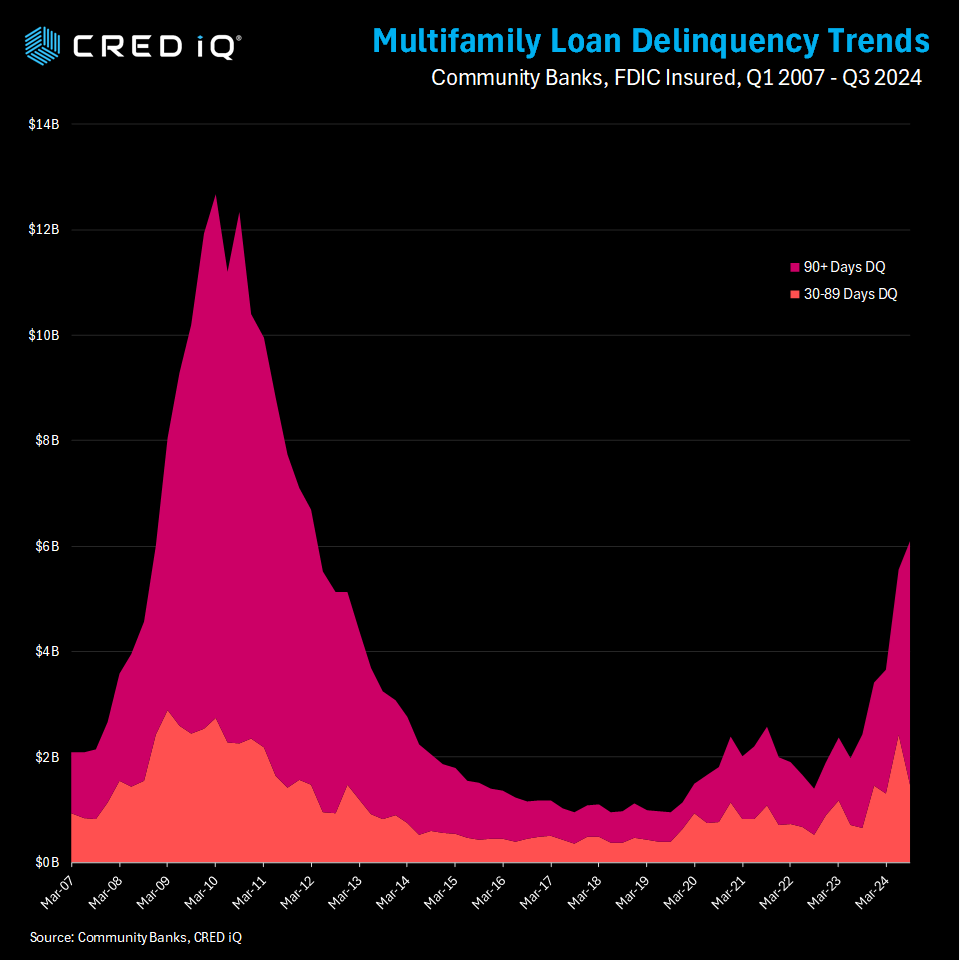
The multi-family segment’s overall distress rate continued to climb modestly in January (up 40 BP) and February added 10 basis points to 13.0%. Multifamily has earned a distant second place in the distressed property type rankings
The retail and hotel segments continue to battle for third while posting modest changes. Retail (10.7% –down 10 BP) holding on to third place and hotel (10.2% down 20 BP) is nipping at the heels. Retail has notched three successive months of modest distress rate decreases.
As predicted in our last report, the self-storage print of 14.2% was misleading and due to a 16 property ~$2B portfolio reaching maturity. The service commentary indicates the first of three one-year extension options is being exercised.
Accordingly, self storage normalized back down to 2.0% in this print. Industrial also normalized with a 110 basis point decrease to reach a familiar territory (sub 1%) at 0.5%.
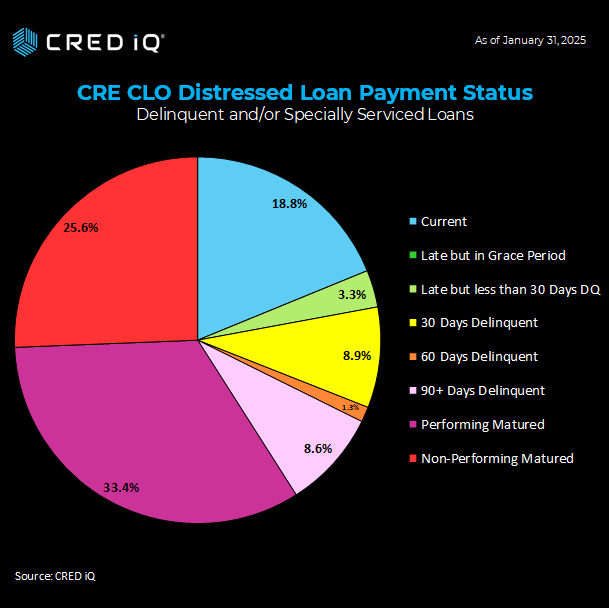
Payment Status
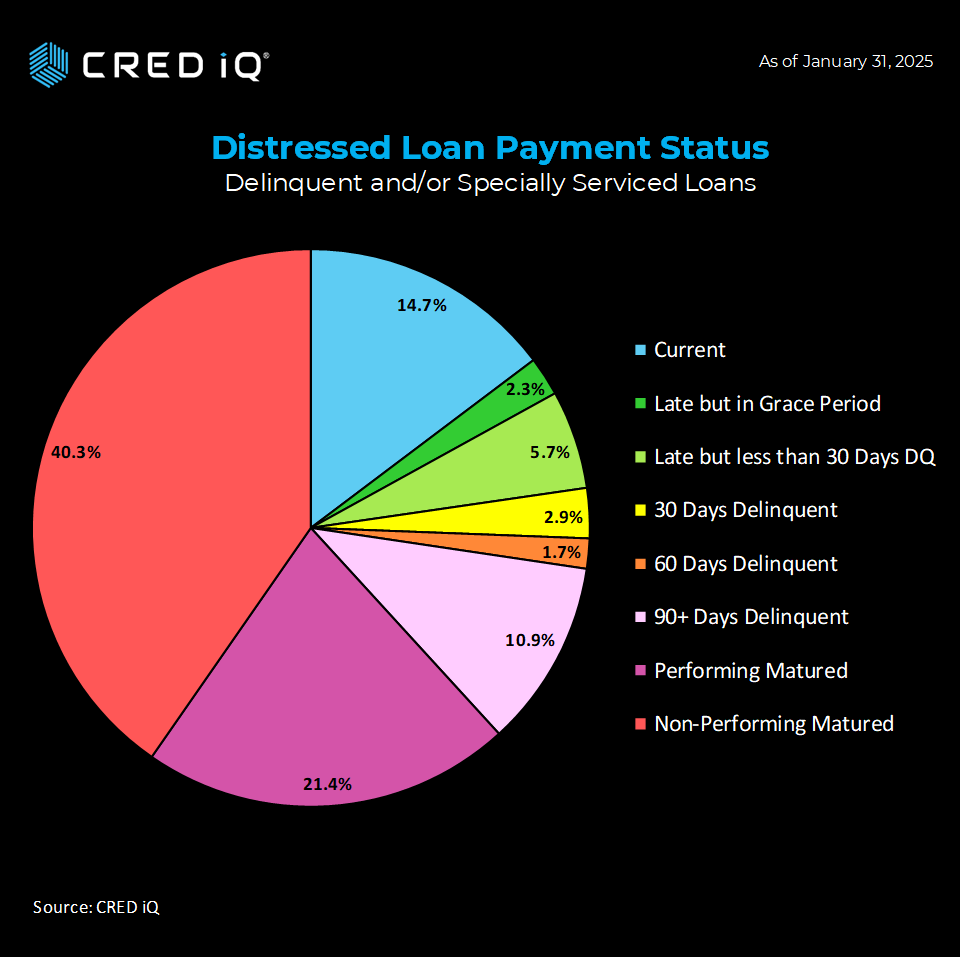
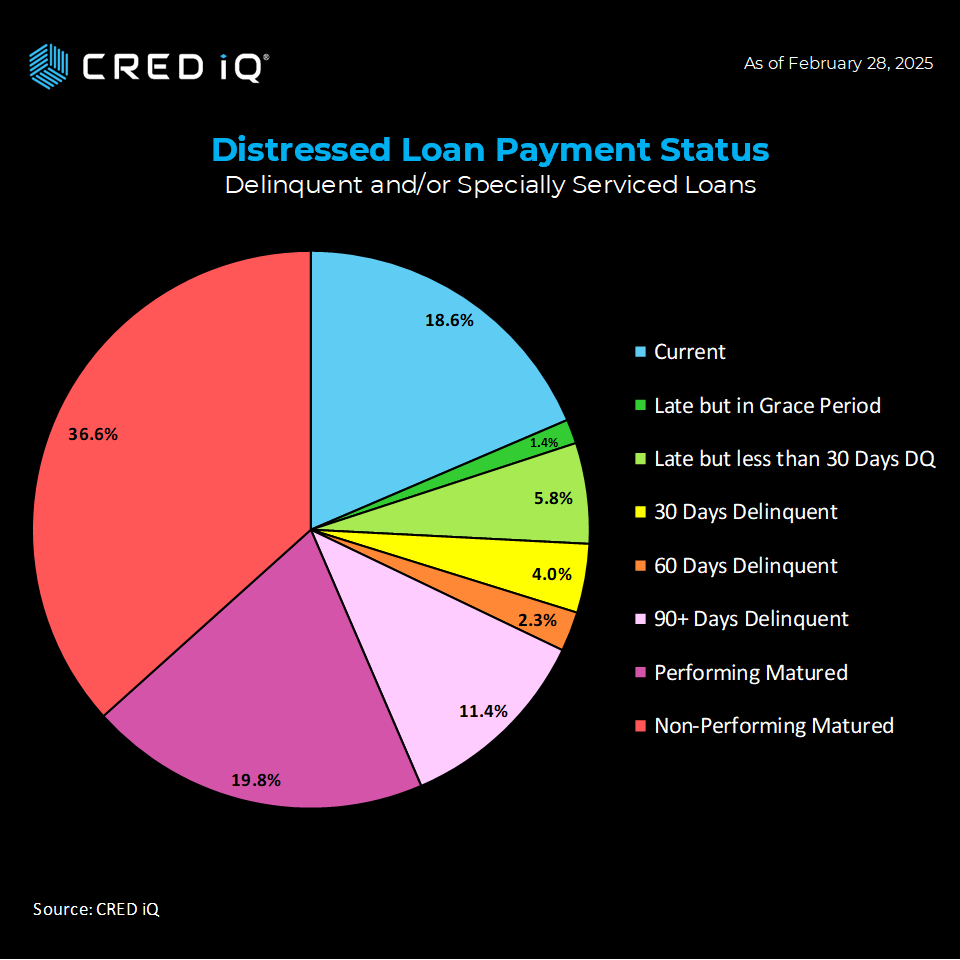
Our team explored payment status as well. From a month-over-month perspective, we highlight two key takeaways that are similarly sized
- The Non-Performing Matured category saw a decrease of 370 basis points to 36.6%
- The Current category saw an increase of 380 basis points to 18.6%
All other categories saw more modest changes since our previous print.
Combining current with late but in the grace period and late by last than 30 days delinquent, this ‘wider current’ metric continued to grow, logging a 25.8% print (a 310 basis point favorable swing).
Combining performing matured with non-performing matured, January saw a significant decrease from 61.7% to 56.4% in February.
Analysis Methodology
CRED iQ’s distress rate factors in all CMBS properties that are securitized in conduits and single-borrower large loan deal types. CRED iQ tracks Freddie Mac, Fannie Mae, Ginnie Mae, and CRE CLO loan metrics in separate analyses.
CRED iQ’s distress rate aggregates the two indicators of distress – delinquency rate and specially serviced rate – yielding the distress rate. The index includes any loan with a payment status of 30+ days delinquent or worse, any loan actively with the special servicer, and includes non-performing and performing loans that have failed to pay off at maturity.
About CRED iQ
CRED iQ is a market data provider that offers a robust suite of data and software solutions tailored for commercial real estate and finance professionals.
With over $2.3 trillion of CRE loans, CRED iQ delivers instant access to a comprehensive range of financial data and analytics for millions of properties in every market. CRED iQ’s data and analytical capabilities are instrumental in helping investors, lenders and brokers make informed and strategic decisions critical to their business.
THE DATA, INFORMATION AND/OR RELATED MATERAL (“DELIVERABLES”) IS BEING OFFERED AS-IS/WHERE-AS CONDITION. CRED-IQ MAKES NO REPRESENTATION OR WARRANTY AS TO QUALITY OR ACCURACY OF SUCH DELIVERABLES BEING PURCHASED, WHETHER EXPRESS OR IMPLIED, EITHER IN FACT OR BY OPERATION OF LAW, STATUTE, OR OTHERWISE, AND CRED-IQ SPECIFICALLY DISCLAIMS ANY AND ALL IMPLIED OR STATUTORY WARRANTIES INCLUDING WARRANTIES OF MERCHANTABILITY AND OF FITNESS FOR A PARTICULAR PURPOSE, TECHNICAL PERFORMANCE, AND NON-INFRINGEMENT. WITHOUT LIMITING THE FOREGOING, YOU AS CUSTOMER ACKNOWLEDGE THAT YOU HAVE NOT AND ARE NOT RELYING UPON ANY IMPLIED WARRANTY OF MERCHANTABILITY OR OF FITNESS FOR A PARTICULAR PURPOSE OR OTHERWISE, OR UPON ANY REPRESENTATION OR WARRANTY WHATSOEVER AS TO THE DELIVERABLES IN ANY REGARDS WHATSOEVER, AND ACKNOWLEDGE THAT CRED-IQ MAKES NO, AND HEREBY DISCLAIMS ANY, REPRESENTATION, WARRANTY OR GUARANTEE THAT THE PURCHASE, USE OR COMMERCIALIZATION OF ANY DELIVERABLES WILL BE USEFUL TO YOU OR FREE FROM INTERFERENCE. BY ACCEPTANCE OF THE DELIVERABLES, YOU HEREBY RELEASE CRED-IQ AND ITS AFFILIATES AND AGENTS FROM ALL CLAIMS, DAMAGES AND LIABILITY ARISING HEREUNDER.


")