")
As part of CRED iQ’s ongoing Top Originators Series, our research team has turned its focus to the Fannie Mae sector and the multifamily market for a comprehensive mid-year review. With discussions around a potential Fannie Mae public offering gaining momentum, the agency lending ecosystem is under the spotlight. Our analysis dives into the top originators, key metropolitan statistical areas (MSAs), and standout deals shaping the Fannie Mae landscape in 2025. Here’s what our data reveals.
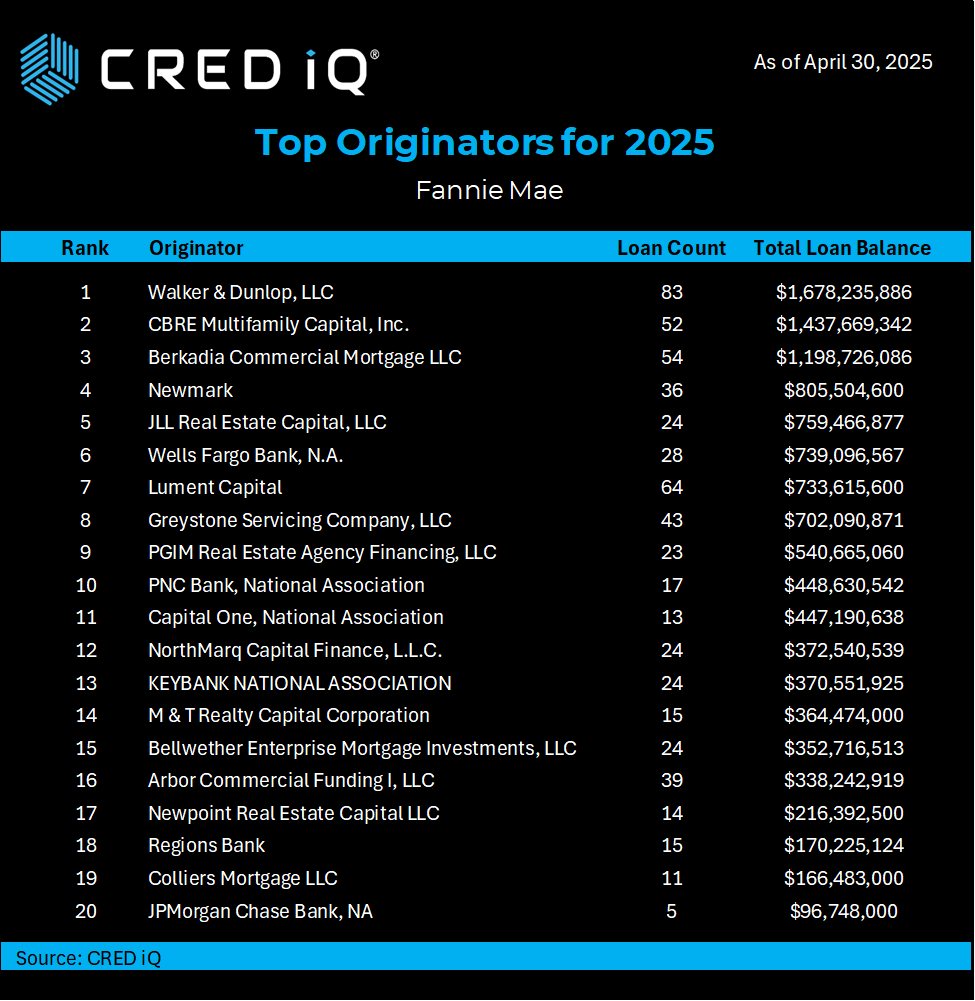
Top Fannie Mae Originators by Loan Balance
Leading the pack, Walker & Dunlop solidified its position as the top Fannie Mae underwriter, originating 83 loans with a total balance of $1.7 billion year-to-date (YTD). CBRE Multifamily Capital, Inc. secured second place with 52 loans amounting to $1.4 billion, followed closely by Berkadia Commercial Mortgage in third with 54 loans totaling $1.2 billion. Rounding out the top five, Newmark and JLL Real Estate Capital contributed $806 million and $759 million in new Fannie Mae loan balances, respectively. These figures underscore the competitive strength of these players in the multifamily financing space.
Top MSAs by Property Count and Loan Volume
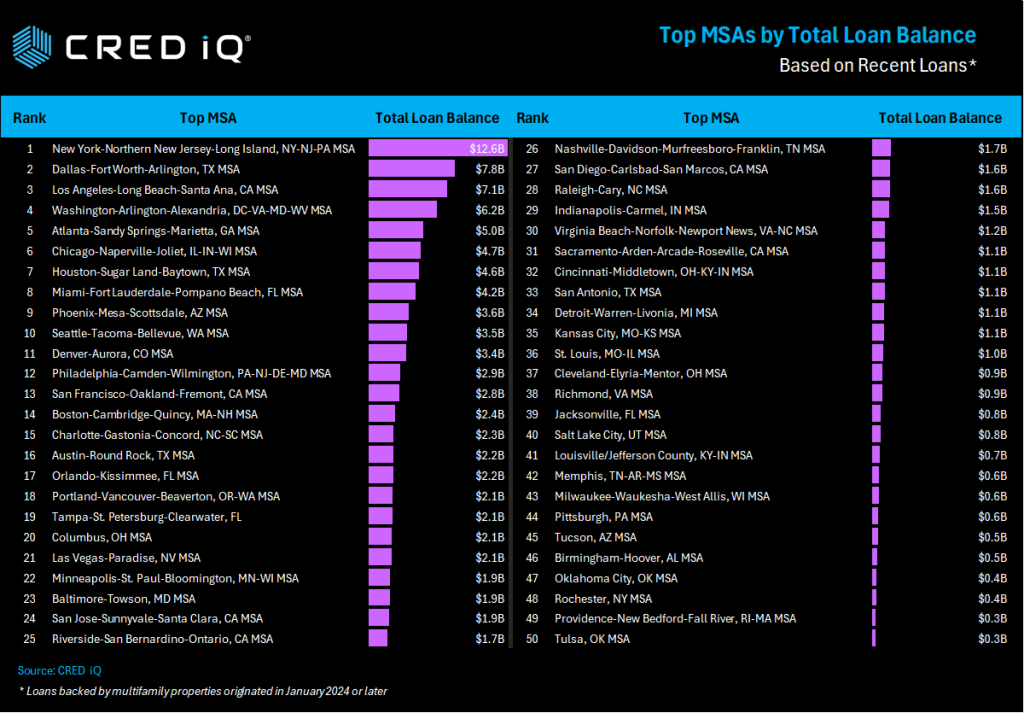
Our analysis ranks MSAs by property count to highlight activity in key markets, with loan balances providing additional context.
- Dallas emerged as the top MSA, leading with 95 properties and $452 million in new loan balances. Its high property count reflects robust multifamily activity in the region.
- Los Angeles secured second place with 55 properties and $606 million in loan balances, demonstrating consistent strength in both metrics.
- Chicago followed in third, with 48 properties and $482 million in loan volume, reinforcing its position as a Midwest multifamily hub.
- New York City metro, with 46 properties, ranked fourth in property count but led in loan balances at $707 million, highlighting the high-value nature of its deals.
- Madera, CA, rounded out the top five with 31 properties, though its loan balances were relatively modest compared to larger markets.
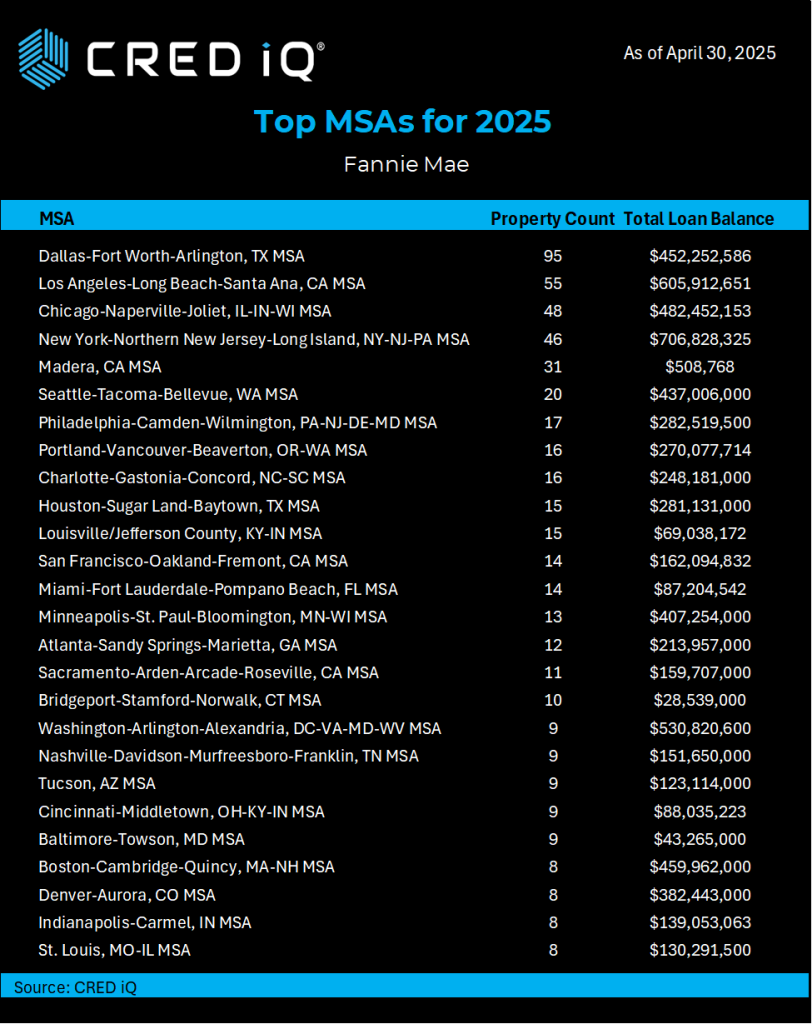
This data showcases the geographic diversity of Fannie Mae’s multifamily lending, with major urban centers driving both property volume and loan dollars.
Notable Fannie Mae Originations
Several high-profile multifamily deals stood out in our review:
- Altitude Apartments (Boston MSA): This 919-unit complex secured a $189 million, five-year, interest-only loan with a 5.34% interest rate. Valued at $292 million in February 2025, this property highlights Boston’s appeal for large-scale multifamily investments.
- Promenade 9 (Los Angeles MSA): A newly constructed 330-unit property, Promenade 9 is backed by a $114 million, 10-year, interest-only loan at a 5.55% interest rate. Valued at $176 million in March 2025, this deal underscores the strength of Los Angeles’ multifamily market.
Why It Matters
The Fannie Mae sector remains a cornerstone of multifamily financing, and the performance of top originators like Walker & Dunlop, CBRE, and Berkadia reflects the resilience and growth potential of this market. As discussions around a potential Fannie Mae public offering intensify, understanding the dynamics of origination activity and key markets becomes critical for commercial real estate professionals. Our data highlights the strength of major MSAs like Dallas, Los Angeles, and New York, while notable deals like Altitude Apartments and Promenade 9 illustrate the scale and sophistication of recent transactions.
At CRED iQ, we’re committed to delivering actionable insights to help you navigate the evolving commercial real estate landscape. Stay tuned for more updates in our Top Originators Series as we continue to track the trends shaping the industry.
For more data-driven insights, visit CRED iQ or contact our team for tailored analytics.


")
")