CRED iQ is excited to announce the addition of Nikki Kirk as Chief Client Officer. In this role, Kirk will oversee all client relationships and continue to build CRED iQ’s Client Success team. She will also play a critical role in strategic opportunities for the company.
“We are thrilled to welcome Nikki to CRED iQ as our client base continues to grow,” said Mike Haas, Founder and CEO of CRED iQ. “Her experience and leadership will be crucial to our future success. We are lucky to have her joining our senior team.”
Bringing a wealth of experience in the CRE ecosystem, with a notable focus on data and analytics, Nikki Kirk’s background includes positions at top companies such as CBRE, Gibson Dunn, and Colliers. Most recently, she served as Chief Strategy Officer at Parceled, a highly innovative Real Estate Data and Enablement business.
Chris Aronson, Chief Commercial Officer, added “Nikki and I worked together previously, and I quickly realized her ability to connect and collaborate with clients was truly exceptional. We look forward to her leadership as she plays a central role in shaping the future of CRED iQ.”
Kirk also expressed her excitement about joining the company, stating “I am delighted to join CRED iQ during this exciting period of growth. I look forward to working closely with the CRED iQ team and, most importantly, partnering with our clients to continue building an innovative product.”
Nikki Kirk will officially join the CRED iQ team on June 10th and will also be in attendance at the upcoming CREFC Annual Meeting in New York City, where she will have the opportunity to meet and greet clients.
About CRED iQ CRED iQ is an official market data provider for the commercial real estate and financial industries. The platform is powered by over $2.3 trillion of audited loan and transaction data that includes all property types and geographies.
CRE professionals leverage CRED iQ for a wide spectrum of use cases such as uncovering acquisition & lending opportunities, market analysis, underwriting, and risk management.
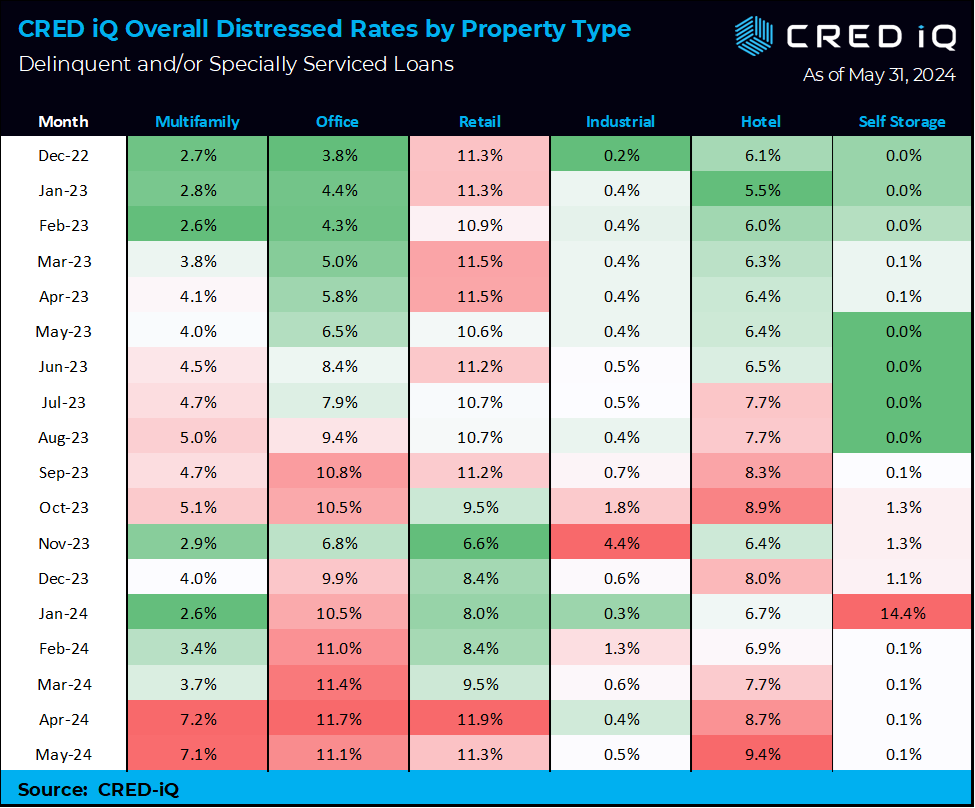
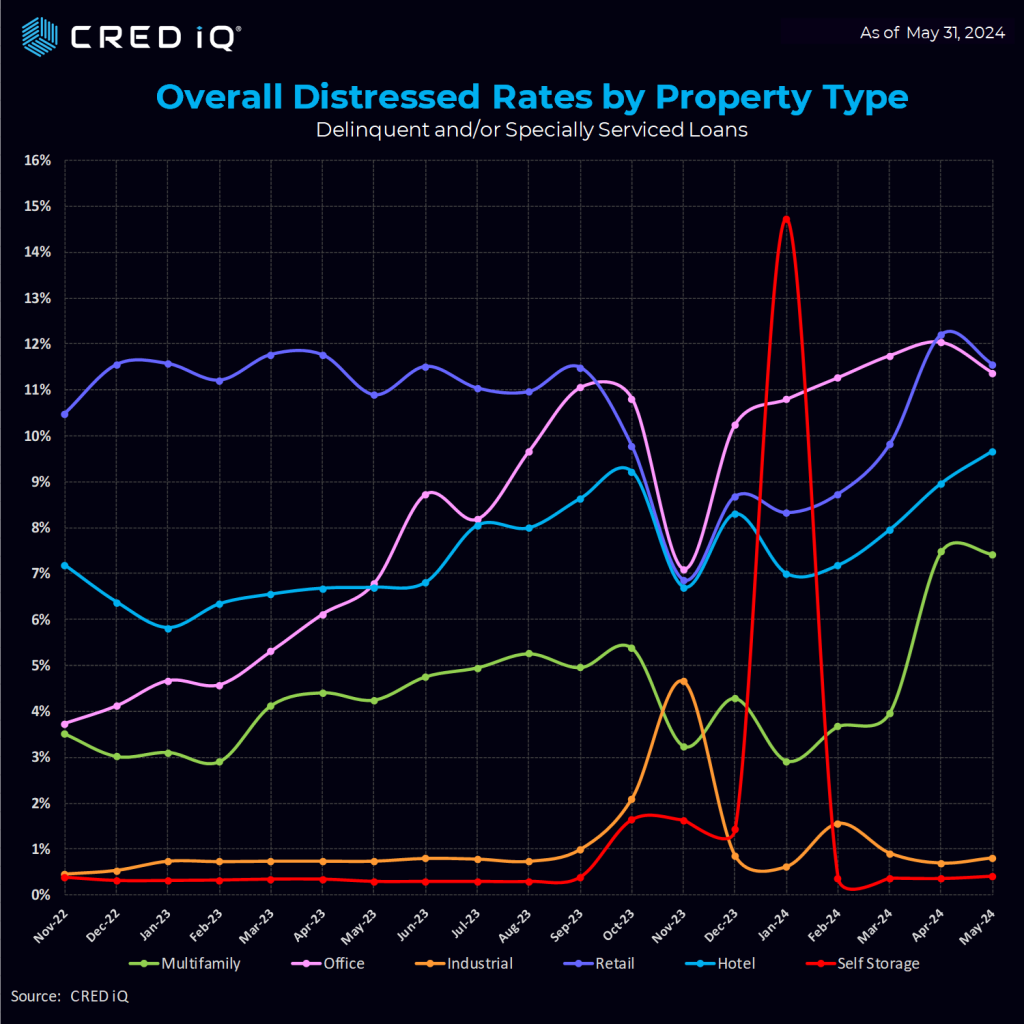
The CRED iQ distress rate inched up 14 basis points in May to 8.49%, setting a third straight record high. The CRED iQ team evaluated payment statuses reported for each loan, along with special servicing status as part of our monthly distress update. CRED iQ’s special servicing rate now stands at 8.09% and the CRED iQ delinquency rate is at 5.8% for this month.
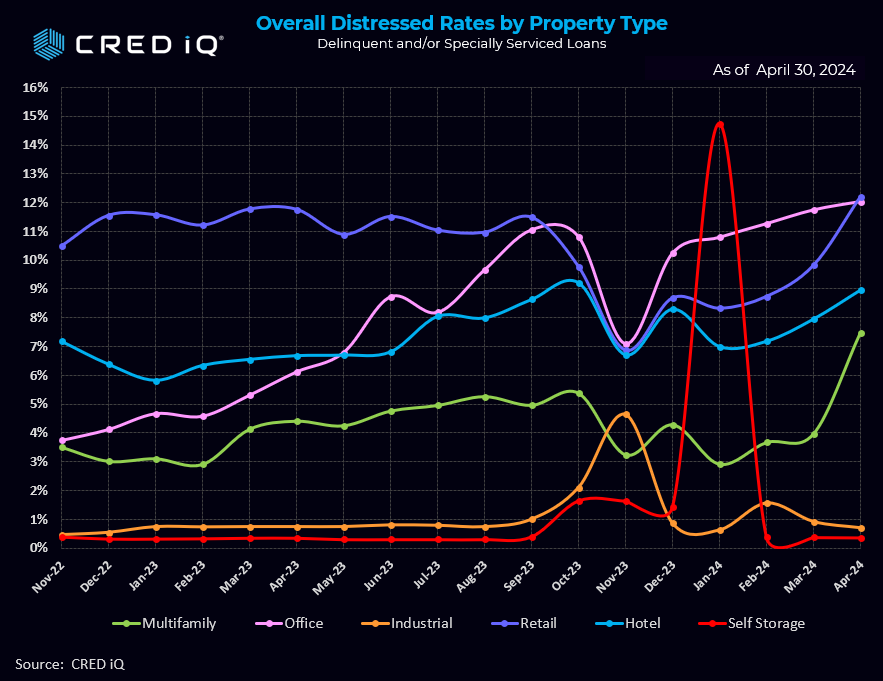
The sector with the largest increase in distress this month was from hotels. The hotel sector jumped from 8.7% to 9.4% in May. One example of a recent hotel default includes the Grand Wailea hotel, which is backed by a $510.5 million loan with an additional $289.5 million in mezzanine debt. This was the primary driver of the increased distressed rates in hotels this month. The loan fell delinquent (performing matured) as it failed to pay off at its May 2024 maturity date. Commentary indicates there are five, one-year maturity extension options. The 776-room, oceanfront, luxury resort is located on the south shore of Wailea, Maui. The asset was performing with a below breakeven DSCR of 0.93 and 49.9% occupancy as of year-end 2023.
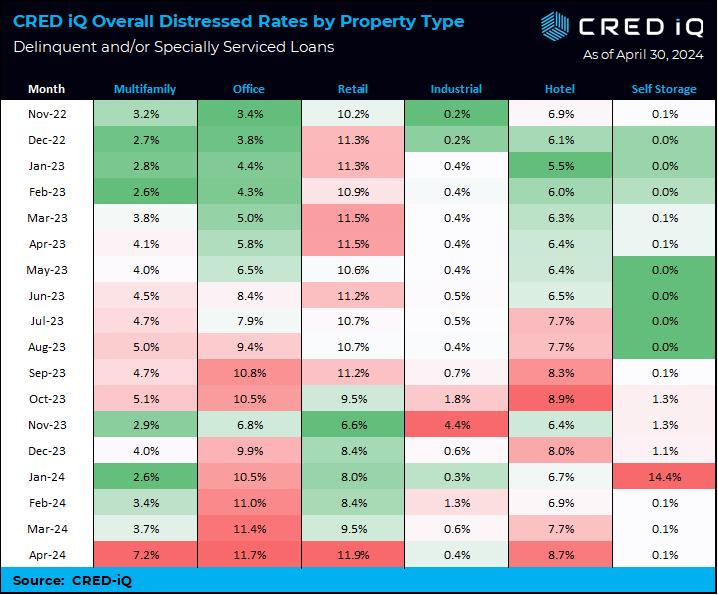
Retail regains its leadership position in May as the office segment shaved 6 basis points to 11.1% following five straight months of increases. Just two basis points separate the retail and office segments. Retail and office continue their duel for the highest level of distress.
Similarly, the retail segment a saw decrease in their distress rate of 6 basis points to 11.3% following an increase from 9.5% to 11.9% in the April print.
Industrial and self-storage continue their steady track records –both operating at sub 1% for all but one of the last 12 months.
Following a fairly dramatic distress rate increase in April, the Multifamily segment shaved one basis point to 7.1%. The April increase was largely attributable to a $1.75 billion loan ($561,000/unit) backed by Parkmerced, a 3,221-unit multifamily property in San Francisco. Imminent non-monetary default caused the loan to transfer to the special servicer with the looming maturity date of December 2024.
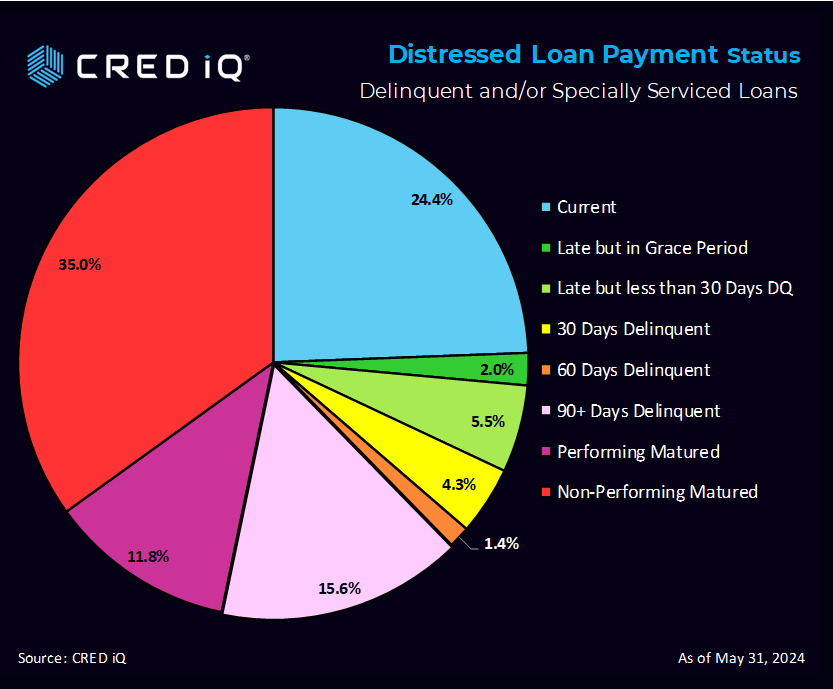
Looking at payment status, 24.4% of the loans are current, with an additional 2% and 5.5% attributable to Late (but in the grace period) and Late (but less than 30 days) respectively. Once again, the largest category was Non-Performing Matured at 35%, followed by 90+ Days Delinquent at 15.6% and Performing Matured at 11.8%.
CRED iQ’s distress rate aggregates the two indicators of distress – delinquency rate and specially serviced rate – yielding the distress rate The index includes any loan with a payment status of 30+ days or worse, any loan actively with the special servicer, and includes non-performing and performing loans that have failed to pay off at maturity.
It’s important to note that CRED iQ’s distress rate factors in all CMBS properties that are securitized in conduits and single-borrower large loan deal types. CRED iQ tracks Freddie Mac, Fannie Mae, Ginnie Mae, and CRE CLO loan metrics in separate analyses.
CRED iQ is an official market data provider for the Commercial Real Estate and financial industries. Powered by over $2.3 trillion in loan and transaction data that includes all property types and geographies.
CRE professionals leverage CRED iQ for a wide spectrum of use cases such as uncovering acquisition & lending opportunities, market analysis, underwriting, and risk management.
CRED iQ is an official market data provider that is powered by over $2.3 trillion of audited loan and transaction data that includes all property types and geographies.
CRE professionals leverage CRED iQ for a wide spectrum of use cases such as uncovering acquisition & lending opportunities, market analysis, underwriting, and risk management.
If you would like to learn more about CRED iQ’s products and services, please contact team@cred-iq.com or (215) 220-6776.
THE DATA, INFORMATION AND/OR RELATED MATERAL (“DELIVERABLES”) IS BEING SOLD IN AS-IS/WHERE-AS CONDITION. CRED-IQ MAKES NO REPRESENTATION OR WARRANTY AS TO QUALITY OR ACCURACY OF SUCH DELIVERABLES BEING PURCHASED, WHETHER EXPRESS OR IMPLIED, EITHER IN FACT OR BY OPERATION OF LAW, STATUTE, OR OTHERWISE, AND CRED-IQ SPECIFICALLY DISCLAIMS ANY AND ALL IMPLIED OR STATUTORY WARRANTIES INCLUDING WARRANTIES OF MERCHANTABILITY AND OF FITNESS FOR A PARTICULAR PURPOSE, TECHNICAL PERFORMANCE, AND NON-INFRINGEMENT. WITHOUT LIMITING THE FOREGOING, YOU AS CUSTOMER ACKNOWLEDGE THAT YOU HAVE NOT AND ARE NOT RELYING UPON ANY IMPLIED WARRANTY OF MERCHANTABILITY OR OF FITNESS FOR A PARTICULAR PURPOSE OR OTHERWISE, OR UPON ANY REPRESENTATION OR WARRANTY WHATSOEVER AS TO THE DELIVERABLES IN ANY REGARD WHATSOEVER, AND ACKNOWLEDGE THAT CRED-IQ MAKES NO, AND HEREBY DISCLAIMS ANY, REPRESENTATION, WARRANTY OR GUARANTEE THAT THE PURCHASE, USE OR COMMERCIALIZATION OF ANY DELIVERABLES WILL BE USEFUL TO YOU OR FREE FROM INTERFERENCE. BY ACCEPTANCE OF THE DELIVERABLES, YOU HEREBY RELEASE CRED-IQ AND ITS AFFILIATES AND AGENTS FROM ALL CLAIMS, DAMAGES AND LIABILITY ARISING HEREUNDER
Is 1740 Broadway an Anomaly, or an Indication of What is Ahead for SBLL?
This week, the CRED iQ research team conducted a thorough data analysis for the Single Borrower, Large Loan (“SBLL”) segment to better understand the asset, its exposure to market risks, and loan performance within this category that is under extreme volatility.
Our readers were surprised by last week’s reporting that AAA bond investors in 1740 Broadway, a loan backed by a 621,000-SF office building in New York City received less than three quarters of their original investment back earlier this month. This marks the first such loss of the post-crisis era (according to Barclays). Gross sales proceeds from the distressed sale of 1740 Broadway amounted to $179.5 million ($289/SF), which ended up being slightly above the most recent as-is appraised value of $175 million ($282/SF) and significantly below its updated stabilized appraised value $465 million ($749/SF). The asset originally appraised for $605 million ($1,002/SF) in December 2014, when the property was 98.3% occupied.
Special servicing workout fees, servicer advances, and other expenses totaled $62.3 million, which left only $117.2 million of net proceeds available to the Class-A investors, which had an unpaid principal balance of $157.5 million. This resulted in a $40.3 million loss (25.6% loss severity) to the A tranche and wiped out all subordinate tranches. CRED iQ and Commercial Observer first broke the news in March 2022 of the upcoming transfer of this loan to the special servicer as Blackstone signaled it was no longer interested in the property and would be handing the keys back. Despite common market knowledge of the degradation of value, 7% occupancy, and the unwillingness of Blackstone to invest in the stabilization of the building, the rating agencies maintained lofty ratings as recently as November 2023, where Morningstar DBRS / DBRS Morningstar had a high “A” rating and S&P had a “BB+” rating for the saftest Class A bonds, which were originally rated AAA.
Flawed Ratings by Morningstar/DBRS and S&P?
Are last week’s revelations an anomaly, or an indication of what is ahead for the AAA SBLL sector? Are these two rating agencies hesitant to downgrade their AAA rated classes since they have weak market share compared to Fitch & Moody’s? Are they still texting each other about key ratings decisions trying to stay off the record? Will the SEC fine them again? Only time will tell. Our analysis seeks to answer that fundamental question. We examined the overall health of current SBLL deals. Our team then looked at some of the issues that impacted 1740 Broadway – such as office sector exposure. CRED iQ provides real-time data and independent research with valuation and refinance models.
Office Exposure
Looking more deeply into the segment, we explored the office exposure within the SBLL category. Across the entire SBLL deal universe, 152 deals have office exposure. A total of 629 office buildings are currently financed via SBLL deal structures with a total allocated loan balance of $67.5 billion.
Current State of SBLL Loans
Across the SBLL landscape, our analysis found that ~15% of all loans are reporting a DSCR below 1.10. 13.5% of SBLL loans operate at sub-breakeven DSCR levels. A few examples from CRED iQ data uncovered the Willis Tower in Chicago, that recently reported a 0.28 DSCR with 90.7% occupancy and also 5 Bryant Park in NYC, that reported a 0.73 DSCR with 81.3% occupancy. Stay tuned for an analysis of office buildings in distress that have not received updated appraisals.
CRED iQ is a commercial real estate data, analytics, and valuation platform providing actionable intelligence to CRE and capital markets investors. Subscribers use the platform to identify valuable leads for leasing, lending, refinancing, distressed debt, and acquisition opportunities.
The platform also offers a highly efficient valuation engine which can be leveraged across all property types and geographies. Our data platform is powered by over $2.0 trillion in transactions and data covering CRE, CMBS, CRE CLO, Single Asset Single Borrower (SASB), and all of GSE / Agency.
Following on the heels of well publicized troubles in the office sector, increasing attention has been paid as of late to potential distress within the multifamily sector. Recent headlines have pointed to staggering change rates in distress for a previously obscure financial product, the CRE CLO securitization, which generally consists of floating rate bridge loans leveraging transitional properties. In plain language terms, they encumber riskier properties undergoing some form of a value-add sponsor business plan. Most of the general issues are already well known and have been discussed by market participants ad nausem so need not be repeated.
Issuers generally consist of private debt funds and listed commercial mortgage REITs. In that context, the CLO is effectively a fungible financing option; loans are originated and typically encumbered with repo leverage. Risk retention by the issuer generally falls in the 10-20% range. This is where the similarities end. CRE CLOs can be static or managed transactions; this distinction has notably produced disparate loss mitigation outcomes between two listed commercial mortgage REITs: Ready Capital (“Ready”) and Arbor Realty Trust. A fundamental misunderstanding of distinct structural loss mitigation levers has resulted in an erroneous assessment of near term outcomes and latency of any potential adverse credit events.
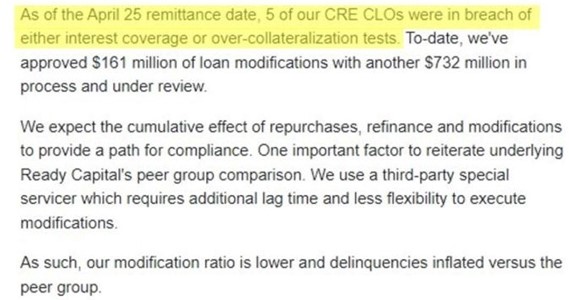
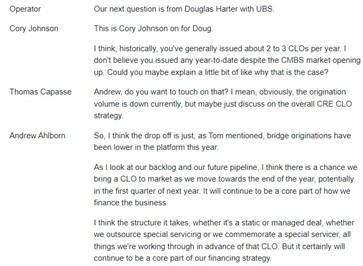
BofA Securitized Products Strategy team indicated in a CRE CLO memo dated May 8, 2024 as follows “Seven deals failed their IC/OC tests in April, which is five more than the two that failed in March. Deals from the RCMT shelf accounted for six of the seven deals that failed its IC or Par Value test.” Ready then indicated the following morning in their May 9 earnings call that as of the April 25 remittance date only five of their CRE CLOs were in breach of interest coverage or overcollateralization tests. I have been unable to reconcile this apparent discrepancy. Regardless, the catalyst for continuing distress in the Ready CLO book seems to be the static nature of their issuances. See below screenshot from Ready’s May 9 earnings call transcript.
In an actively managed CRE CLO, the collateral manager typically has discretion to buy and sell loans so as to minimize losses for pool investors. In effect, even though on a loan level basis the assets within the pool are likely below investment grade, through active management the credit quality of the issuance as a whole can in theory be improved over time. In contrast, Ready has stated on its recent earnings call that it has been hamstrung in loss mitigation efforts by a static CLO structure and that it needs a third party special servicer to affirm any modification requests as compliant with the servicing standard prior to modifications within CLO vehicles. I have had conversations with multiple insiders over the last several months who have indicated to me, in effect, that it is best practice for a collateral manager to avoid modifications within the structure as much as is reasonably practicable.
A CRE CLO SPV is an offshore tax entity not generally subject to US tax on net income. Modifications performed within the structure that are deemed “economically significant” (rate, term, recourse, lien subordination, cross collaterization etc) can be deemed a re-origination and engaging in US Trade or Business (SeeIRS Private Letter Ruling 9701006), which would in turn subject net income to US tax. Ready is in effect apprently hamstrung in modifying loans outside of the SPV and lacks the similar discretion to reinvest seasoned modified loans in CLOs relative to peers.
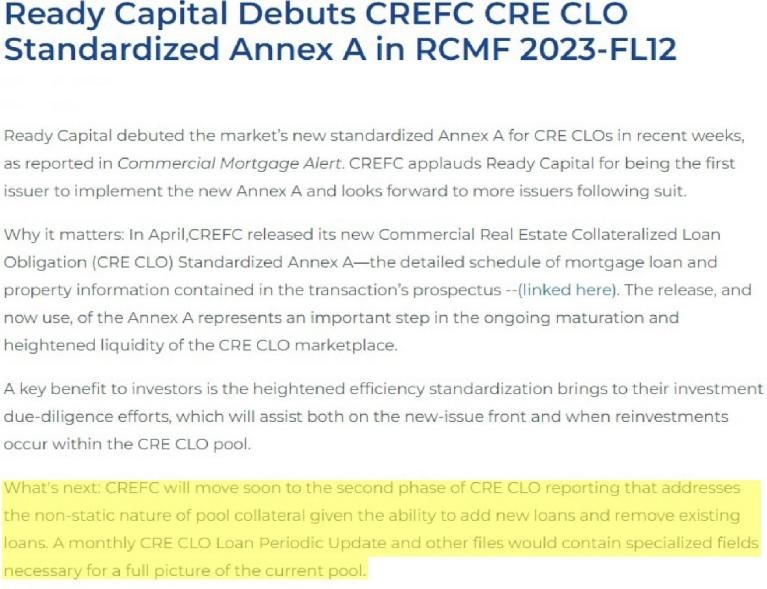
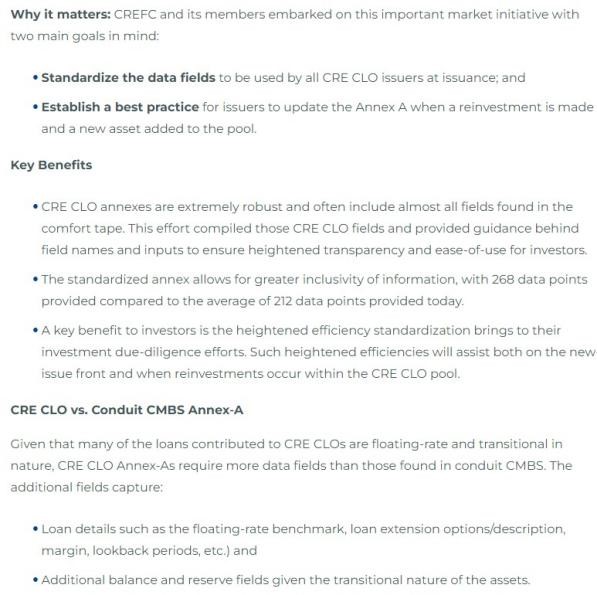
Ready rolled out its 12th CRE CLO, RCMF 2023–FL12, last June to some fanfare as it was the first issuance implementing the new CREFC Annex A data standard.
Notably, the second phase highlighted above has lagged in implementation across the board since CREFC press releases last spring. The new standard is particularly important at this moment in time for actively managed CLO issuances as the underlying loans are exchanged and/or modified and seasoned loans are reinvested. Having identified this need, the team at Cred IQ is currently working through generating a proprietary cohort of CRE CLO annexes which seek to normalize outstanding issuances to the new Annex A standard inclusive of relevant data fields.
Back to Ready’s twelfth issuance (noted above) which is the first to adhere to the new CREFC standard, inexplicably and consistent with Ready’s prior issuances, it is once again a statically managed CLO. There is a particular tinge of irony in this as Waterfall Asset Management is the external advisor to the publicly traded Ready Capital entity; Waterfall was a substantial player in the residential NPL market from 2009 onwards and their team has extensive loss mitigation and workout experience.
The extent of Arbor Realty Trust’s modifications is well known; the purpose of this article is not to debate the validity or terms of those modifications, as their existence is undeniable. Credit enhancement or lack thereof of Arbor CLO vehicles from reinvestments is likewise the subject of another article in which I intend to incorporate the new CRED iQ normalized reporting standard to discuss identifying potential preferred equity opportunities in the ARCREN actively managed shelf. That said, there an inherent latency to credit events for an actively managed CRE CLO relative to a static CRE CLO. To gripe and claim an active collateral manager is “extending and pretending” is simply demonstrative of lack of understanding of the structural levers in my view; it is not a bug but rather a feature.
Where now? The distressed debt opportunity from static CRE CLOs
Ready and affiliates have been particularly active over the years as loan sellers. Tellingly, Ready has specifically stated that it has $655 million in loans now marked as held for sale, of which approximately 40% are from its M&A bucket, namely acquisitions of Broadmark Realty Capital and Mosaic Real Estate Credit. Arbor, in comparison, has not proven to be a frequent loan seller. As alluded to, a potential Arbor opportunity set in the next several quarters may very well be pref equity of the soft variety behind an agency senior with recognition rights.
As to the situation at hand, of Ready’s $655 million of loans marked for sale approximately 70% are in some stage of delinquency. There is a certain value in tracking potential distress in advance of an anticipated loan sale; secondary market NPL sales typically occur relatively quickly and lack the prolonged due diligence periods characteristic of typical CRE investment sales. In addition, understanding the inherent changes that occur to a distressed asset over time assists with accurate loan level NPL underwriting and bid commentary to loan sellers. This is even more important when targeting a specific distressed loan acquisition which has not yet been offered on the secondary market. Additionally, nonperforming loan backleverage has also become increasingly interesting. Loan to acquisition cost varies widely but is typically in the 60% range +/- 10%. Terms range from SOFR +400 for a relatively low leverage note on note product to prime +200 with a 10.5% rate floor for note buyers seeking 75% leverage. Origination fees are typically one to two points for a two year term with extension option. NPL backleverage provides high yield at a relatively low LTV ratio against the underlying collateral with upside in the optionality to take over the workout process in the event of default.
For purposes of a sample use case of CRED iQ data to source such opportunities, let’s take a look at an issuance from the Ready shelf, 2022-FL8. In a surveillance update dated September 21, 2023, DBRS notes: Five loans, representing 14.6% of the current trust balance, encumber properties for which Tides Equities is the sponsor.
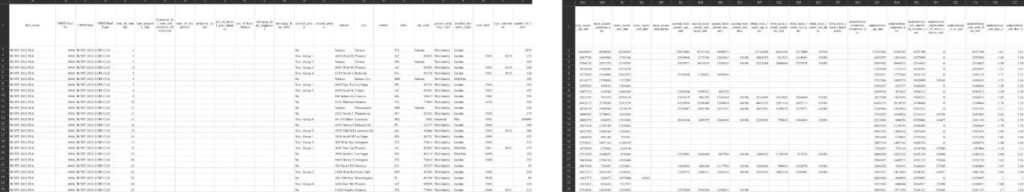
CRED iQ has provided me a draft of their soon to be released normalized Annex A cohort specific to the RCMT FL8 issuance which I have cropped in pertinent part:
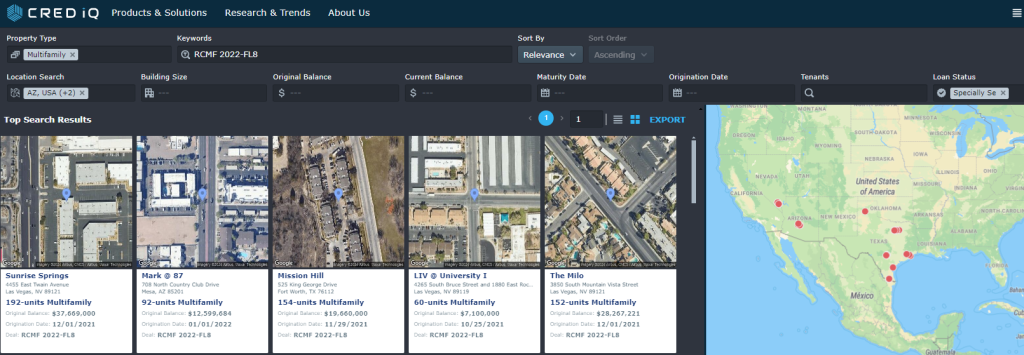
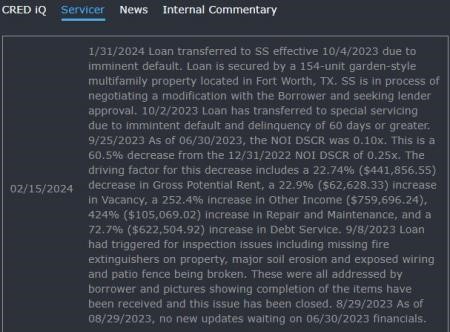
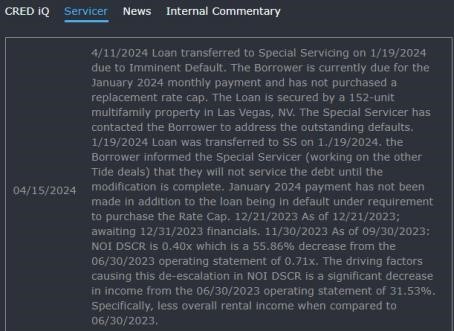
The five loans issued to Tides Equities within this pool encumber the following properties: 4620 W McDowell Rd, Phoenix AZ (“Tides on McDowell”), 2645 E Cactus Rd, Phoenix AZ (“Tides on East Cactus”), 4455 E Twain Ave, Las Vegas, NV (“Tides on Twain”), 3850 S Mountain Vista St, Las Vegas, NV (“Tides on Indios”), and 525 King George Dr, Fort Worth, TX (“Tides on Meadowbrook”). Utilizing the data from the Cred IQ normalized RCMT 2022-FL8 annex, we can then find loan level distress for Tides Equities properties using the platform’s property analytics interface. Tides properties in are multifamily in AZ, TX and NV so I limited my search accordingly.
Based upon the limitations of static CLO loss mitigation as described in the Ready Capital earnings call, I then filtered results to those loans specially serviced or 60 days+ delinquent. Please note that some of these properties have changed hands several times in recent years and the apartment complex name from the prior sponsor may still be reflected in results. However, based upon the property addresses, I can determine that Tides on Twain, Tides on Meadowbrook and Tides on Indios are either specially serviced or more than 60 days delinquent.
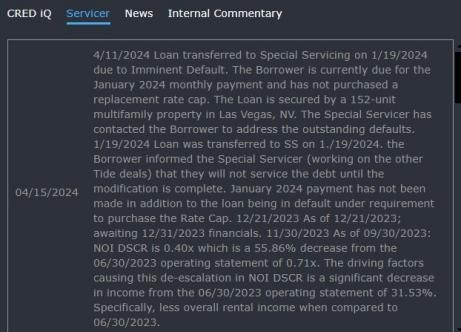
Below are the special servicer’s most recent notes from the CRED iQ platform for Tides on Twain, Tides on Meadowbrook, and Tides on Indios, respectively:
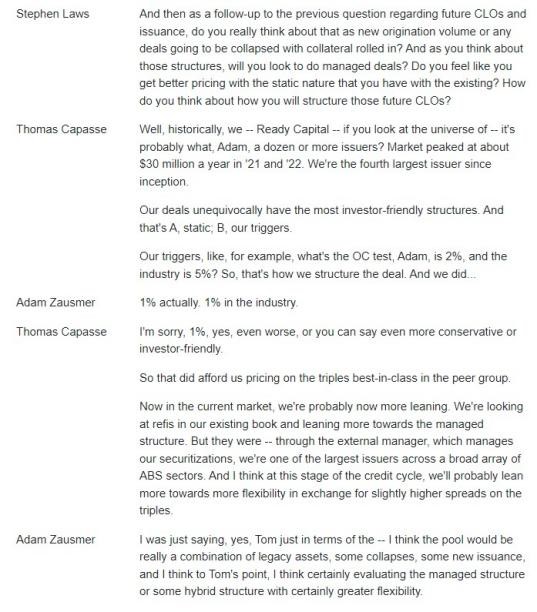
These particular Tides properties are encumbered by just some of the many troubled multifamily bridge loans that have recently entered the loss mitigation process. To gain further insight NPL sales and note on note backleverage out of Ready’s static CLO structures, below are several relevant exchanges from Ready’s earnings call:
Ready has expressed interest in bringing a new CLO to market by the end of 2024, tellingly of the actively managed variety. This is particularly relevant; assuming the market still has an appetite for new issue CRE CLOs it reflects a present opportunity for sourcing distress out current static CLO structures using CRED iQ analytics.
About the Author
Jordan Cailliarec
Jordan Cailliarec is a career distressed debt and special situations investor. After attending law school, he spent six years in the nonperforming loan space in the aftermath of the GFC including a stint managing the judicial state portfolio for a PE backed residential distressed debt platform. Subsequently, he has managed an UHNWI’s opportunistic real estate investments with a focus on lower middle market credit related positions and creative restructurings. In addition, he acquired and managed the disposition of a residential whole NPL portfolio sourced from a housing nonprofit in 2021. Disclosure: Jordan holds a long position in Arbor Realty Trust common stock. You can follow him on LinkedIn or reach him by email.
This week, the CRED iQ research team revisited our CRE CLO rankings analysis. Our research team explored aggregated data by issuer to uncover opportunities and risks within this hot sector. Our inaugural report was published on March 1st.
We wanted to understand the percentage breakdown of delinquency and overall distress within these major CRE CLO issuers’ portfolios, and then measure the scale of those portfolios and their associated rankings within the group. Some core measures of our study include:
Current Outstanding Deal Balance
Total Delinquency Rates
CRED iQ’s Overall Distressed Rates
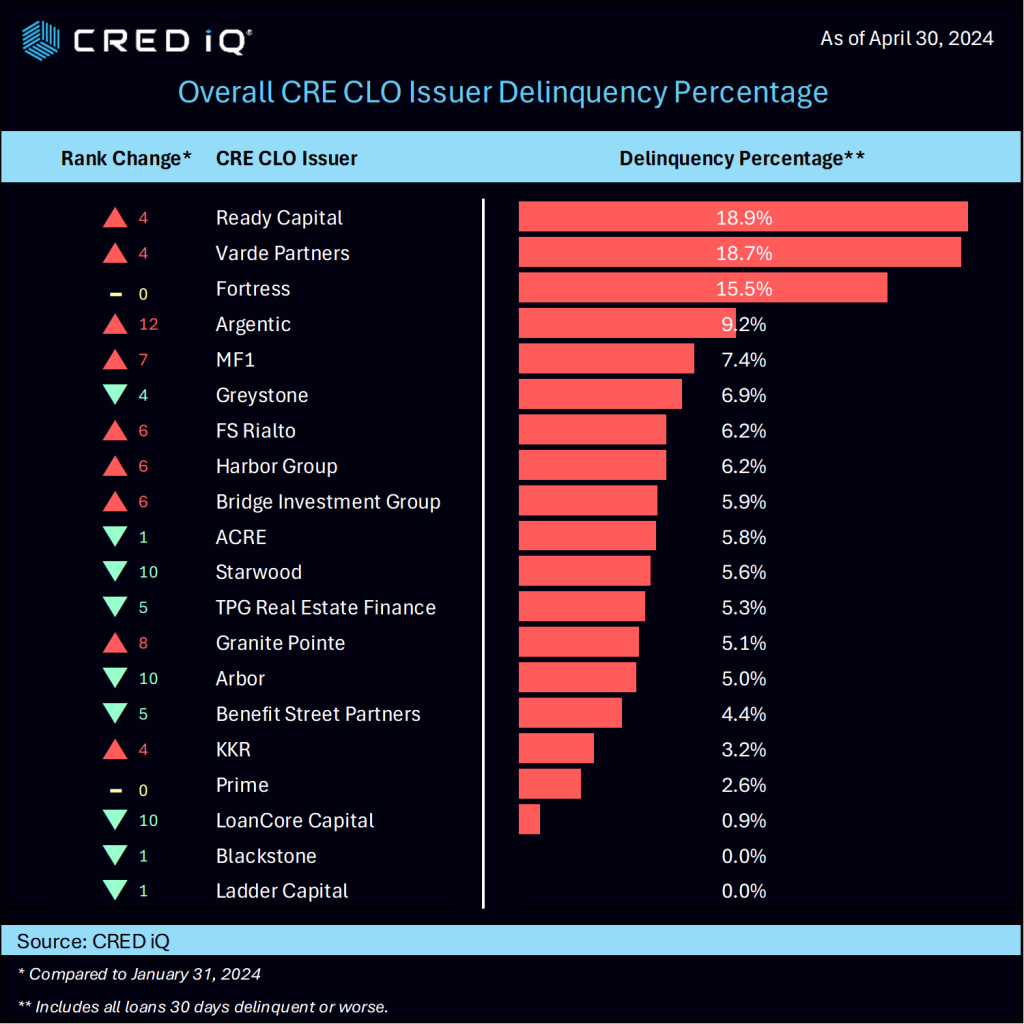
With updated April 30, 2024 remittance data, CRED iQ evaluated the Top 20 CRE CLO issuers and their performance. Nine of the 20 Issuers saw increased levels of delinquency, (including Ready Capital, Varde Partners, Argentic, and MF1) while another 9 (including Greystone, ACRE, Starwood, TPG, and Arbor) saw reduced delinquency percentages. Another two issuers remained flat over the period (Fortress and Prime).
Ready Capital and Varde Partners carried the highest overall delinquency percentages of all issuers at a whopping 18.9% and 18.7%, respectively. Fortress is not far behind at 15.5%. Ready Capital’s delinquency jumped from 7.9% to 18.9% since our original analysis from March 1st (January 2024 data). Varde Partners delinquency rate also surged from 6.2% to 18.7%. On the positive side, Ladder Capital and Blackstone logged delinquency percentages of 0% with LoanCore Capital at sub 1%.
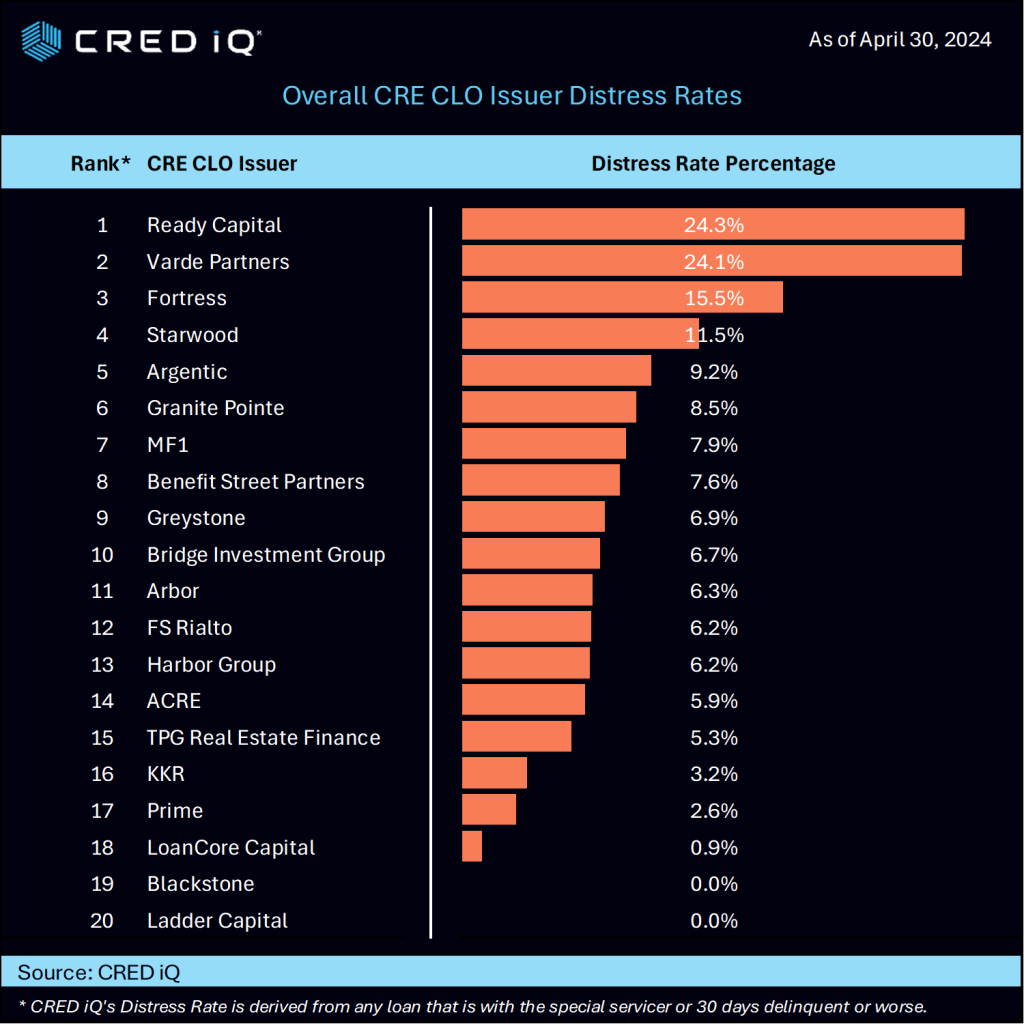
When factoring specially serviced loans, along with any loan that is 30 days past due or worse, CRED iQ calculates an overall distress rate. Ready Capital, Varde Partners, Fortress, Starwood, and Argentic have the highest rates of distress. The Overall Distress Ranking chart is below:
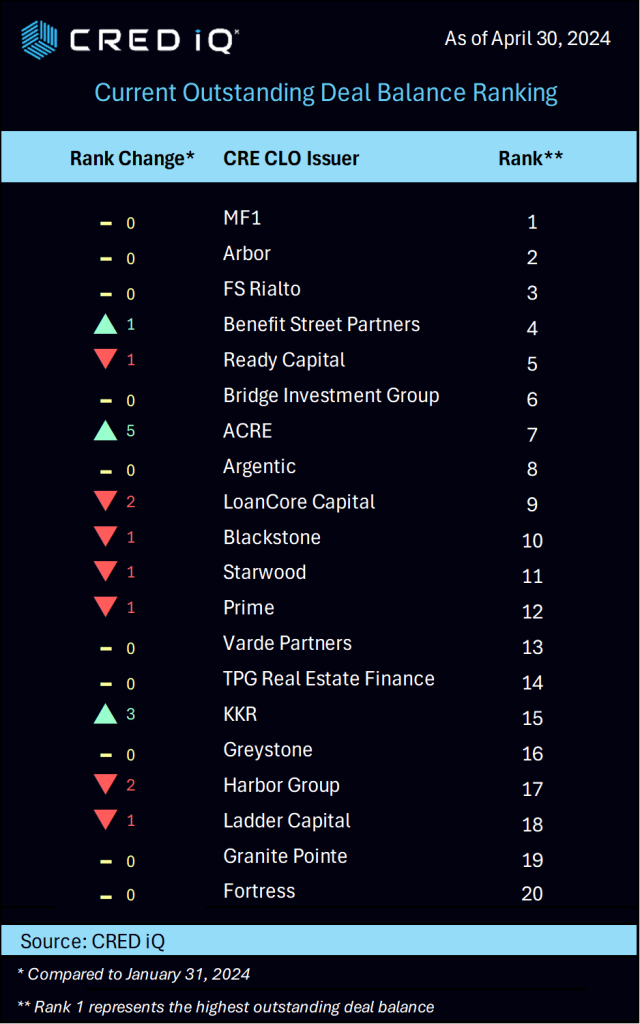
MF1 continued its reign as atop the current deal balance outstanding ranking with $11.4 billion, followed at a distance by Arbor, FS Rialto, Benefit Street Partners, and Ready Capital.
Here is the full list of Top 20 CRE CLO issuers:
Data Access
For access to property- and loan-level data, sign up for our free trial with the link below.
CRED iQ is a commercial real estate data, analytics, and valuation platform providing actionable intelligence to CRE and capital markets investors. Subscribers use the platform to identify valuable leads for leasing, lending, refinancing, distressed debt, and acquisition opportunities.
The platform also offers a highly efficient valuation engine which can be leveraged across all property types and geographies. Our data platform is powered by over $2.0 trillion in transactions and data covering CRE, CMBS, CRE CLO, Single Asset Single Borrower (SASB), and all of GSE / Agency.
The CRED iQ research team completed its monthly top-down evaluation of payment statuses reported for each loan, along with special servicing status. April saw CRED iQ’s Distress Rate reach a new all-time high of 8.35%.
CRED iQ’s distress rate for all property types increased from 7.61% to 8.35%, a 74 basis points jump in April. The April print broke the previous distress rate record from just a month earlier. The distress rate was significantly affected by one large loan which impacted the segment distress rate in a fairly dramatic fashion.
Multifamily saw a whopping increase distress rate increase – from 3.7% in the March print to 7.2% in April. The increase is mostly attributable to a $1.75 billion loan ($561,000/unit) backed by Parkmerced, a 3,221-unit multifamily property in San Francisco. Imminent non-monetary default caused the loan to transfer to the special servicer with the looming maturity date of December 2024. Furthermore, the assets have been underperforming with a below break-even DSCR of 0.47 and 83.5% occupancy. It’s important to note that CRED iQ’s distress rate factors in all CMBS properties that are securitized in conduits and single-borrower large loan deal types. CRED iQ tracks Freddie Mac, Fannie Mae, Ginnie Mae, and CRE CLO loan metrics in separate analyses.
Parkmerced consists of a mixture of townhouse and tower apartment units spanning 152 acres. Approximately 17% of the units were leased by students at origination in 2019, as the property is across the street from San Francisco State University. Parkmerced was underwritten for $2.1B ($655,076/unit) in September 2019.
Retail’s third consecutive distress rate increase earned them the number two slot, while relinquishing their leadership position from the March report. The retail segment distress rate increased from 9.5% in March to 11.9%, achieving a record level for the segment.
The hotel segment notched the third highest month-over-month increase – gaining a full percentage point from 7.7% to 8.7%. Meanwhile, the office segment logged its fifth consecutive monthly increase by a modest 3 basis points, landing just behind retail at 11.7%.
Meanwhile, the industrial and self-storage segments continued their virtually non-existent, sub-1% distress rates
CRED iQ’s distress rate aggregates the two indicators of distress – delinquency rate and specially serviced rate – yielding the distress rate The index includes any loan with a payment status of 30+ days or worse, any loan actively with the special servicer, and includes non-performing and performing loans that have failed to pay off at maturity.
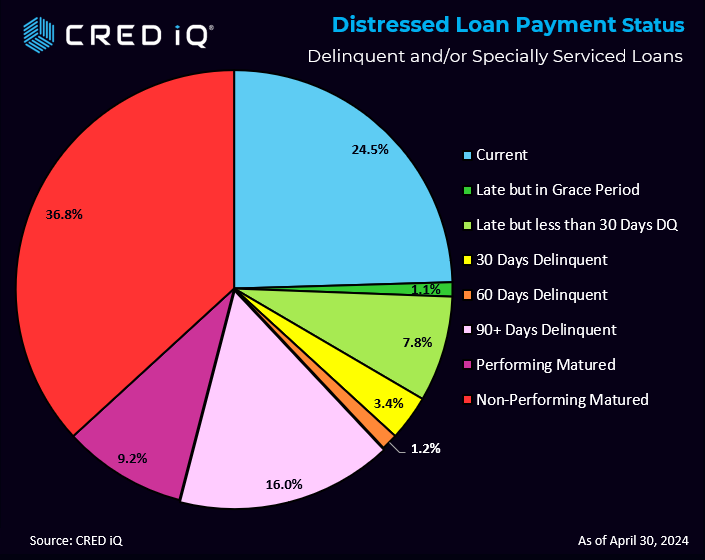
Distressed Loan Payment Status
Nearly one third of loans of the distressed loans are current or within the grace period. The largest category was non-performing, matured at 36.8%. The closely watched performing matured category represents 9.2% of the loans.
CRED iQ is a commercial real estate data, analytics, and valuation platform providing actionable intelligence to CRE and capital markets investors. Subscribers use the platform to identify valuable leads for leasing, lending, refinancing, distressed debt, and acquisition opportunities.
The platform also offers a highly efficient valuation engine which can be leveraged across all property types and geographies. Our data platform is powered by over $2.0 trillion in transactions and data covering CRE, CMBS, CRE CLO, Single Asset Single Borrower (SASB), and all of GSE / Agency.
CRED iQ’s research team has fielded multiple requests to explore the CRE CLO ecosystem from a wide array of perspectives. We are most grateful for these suggestions. This week we decided to extend the horizon a bit as the marketplace approaches a milestone in the watchlist category. What can we draw from the latest data and trending?
We sub-divided the CRE CLO from two perspectives: 1) Loans that have been added to the servicer watchlist. 2) The triggers that caused the watchlist designation.
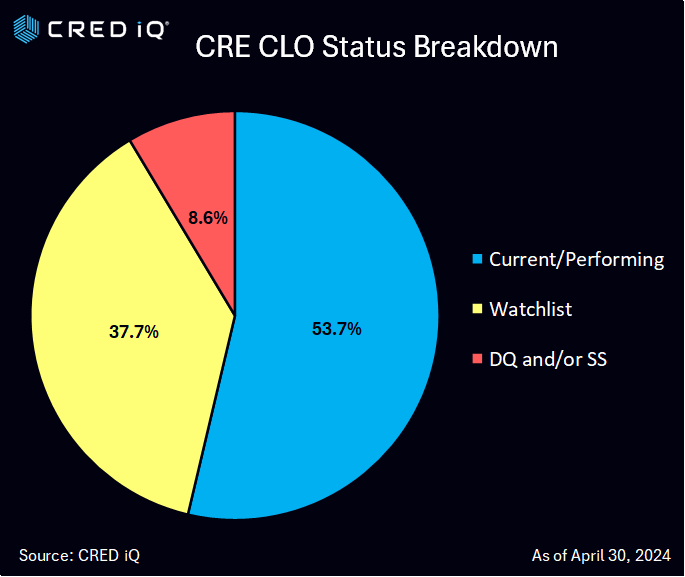
CRED iQ’s latest loan-level analysis as of April 30, 2024 indicated that 38.6% of CRE CLO loans are currently on the servicer’s watchlist. This is in addition to CRED iQ’s overall distress rate of 8.6% for CRE CLO loans that are either delinquent or with the special servicer. Combining these two figures (37.7% watchlist and 8.6% delinquent/specially serviced), CRED iQ calculates 46.3% of these loans are in some level of trouble.
An important early bellwether, the watchlist percentage continues to climb to historic levels. As 8.6% of the CRE CLO loans are currently in special servicing and/or delinquent – revealing a wide gap which could imply that the special serving & delinquency percentages is likely to grow.
Some of the largest issuers of CRE CLO debt over the past five years include MF1, Arbor, LoanCore, Benefit Street Partners, Bridge Investment Group, FS Rialto, and TPG. CRED iQ consolidated all of the loan-level performance data for every outstanding CRE CLO loan to measure the underlying risks associated with these transitional assets. Many of these loans were originated in 2021 at times where cap rates were low, valuations high, low interest rates, and are starting to run into maturity issues given the spike in rates.
Looking across the causes that drive the distress rating, Floating DSR Triggers dominate the reason for the distressed classification. Pending Maturity or ARD represented the largest single category reported.
Outstanding CRE CLO loans amount to approximately $75 billion in loans as of April 30, 2024. The vast majority of these CRE CLO loans are structured with floating rate loans with 3-year loan terms equipped with loan extension options if certain financial hurdles are met.
One such example is the Desert Gardens, a 307-unit multifamily property located in Glendale, AZ within the market of Phoenix. The garden-style property is backed by a $40.0 million ($130,354/unit) loan that was added to the servicer’s watchlist this month due to decreased occupancy. The asset was 84% occupied and performing with a below break-even DSCR of 0.21 as of year-end 2023. The garden-style property was built in 1984 and is undergoing renovations. The prospectus reveals renovation plans included all 307 units, common space areas, and the exterior.
Servicer commentary indicates the borrower is interested in extending the June 2024 maturity date of the loan. At the time of origination, the loan had two, one-year extension options implying a fully extended maturity date of June 2026. The loan was originated with a 3.500% interest rate on a $48.0 million ($156,352/unit) appraisal in 2021. The current interest rate has increased to 8.82% from 3.55% at origination.
CRED iQ is a commercial real estate data, analytics, and valuation platform providing actionable intelligence to CRE and capital markets investors. Subscribers use the platform to identify valuable leads for leasing, lending, refinancing, distressed debt, and acquisition opportunities.
The platform also offers a highly efficient valuation engine which can be leveraged across all property types and geographies. Our data platform is powered by over $2.0 trillion in transactions and data covering CRE, CMBS, CRE CLO, Single Asset Single Borrower (SASB), and all of GSE / Agency.
CRED iQ analyzed recent loans issued this year and compared them to loans from a decade earlier. Our analysis compared underwriting of the same asset for two different loans during two different commercial real estate cycles. One was in 2011 that was fresh out of the great financial crisis of 2008/2009 and the most recent loan was issued in December 2023.
This week’s Tale has special significance when we look closely at today’s CMBS marketplace. The latest new issuances this year feature a a predominance of refinancing transactions. Refinancing accounted for 79% of the loan activity across 2024 new issuances thus far, with recapitalization taking on another 7.5%. Only a relatively modest 12.9% of the underlying loans represented acquisitions. Refinance & Recapitalizations totaled approximately $5.6 billion while acquisition volume was only $827 million.
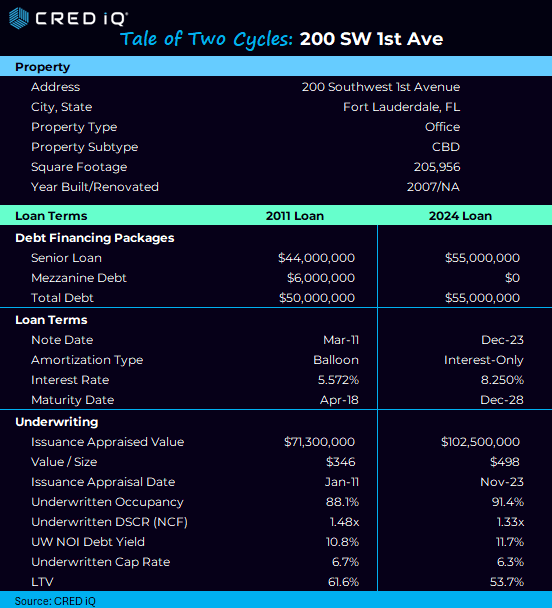
200 Southwest 1st Avenue is a 17-story, Class-A office tower containing 205,956 SF in downtown Fort Lauderdale. The property was built in 2007. The tower which is often referred to as the Auto Nation building originated at high occupancy rates of 88.1% and 91.4% in 2011 and 2024 respectively.
2011 Loan
In January of 2011 the loan was originated with a 5.572% interest rate on an appraised value of $71,300,000 ($346/SF) and an underwritten cap rate of 6.7% and a LTV of 61.6%. The balloon structure carried maturity date of April of 2018 and included mezzanine debt of $6,000,000. Average rents based on the 2011 rent roll were $19.81, which is significantly lower than today’s average rent of $28.03, a 41.5% increase.
2024 Loan
In December of 2023 an interest-only loan was originated at an 8.250% interest rate with a 5-year term. The issuance appraised value was $102,500,000 ($498/SF). The Underwritten Cap Rate was 6.3% with an LTV of 53.7% and a maturity date of December 2028. Underwritten DSCR was 1.33x compared to the 2011 underwriting of 1.48x. The newer loan’s interest rate is 270 basis points higher than the 2011 loan.
Understanding how loans are refinancing are key to forecasting in this new market…for most borrowers and investors, it is indeed a tale of two cycles.