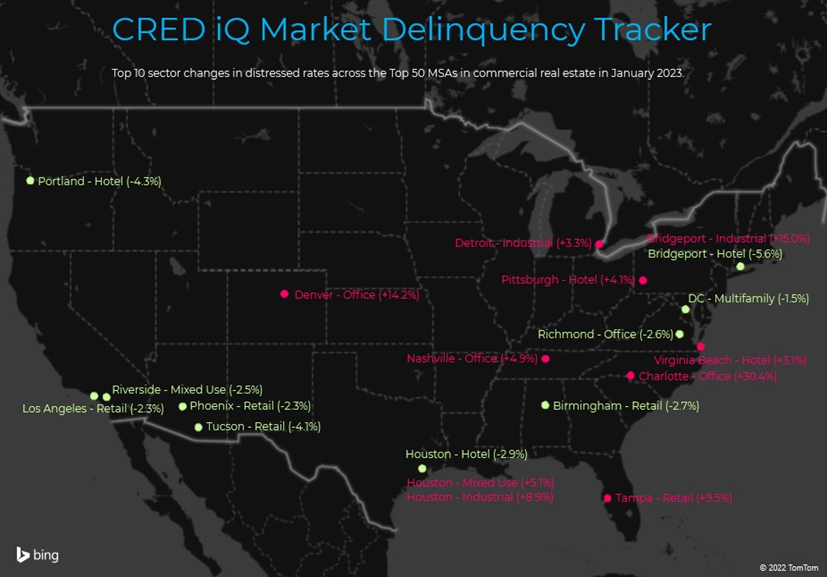
CRED iQ monitors distressed rates and market performance for nearly 400 MSAs across the United States, covering over $900 billion in outstanding commercial real estate (CRE) debt. Distressed rates (DQ + SS%) include loans that are specially serviced, delinquent, or a combination of both. Distressed rates and month-over-month changes for data reported as of January 2023 are presented below for the 50 largest MSAs, broken out by property type for a granular view of distress by market-sector.
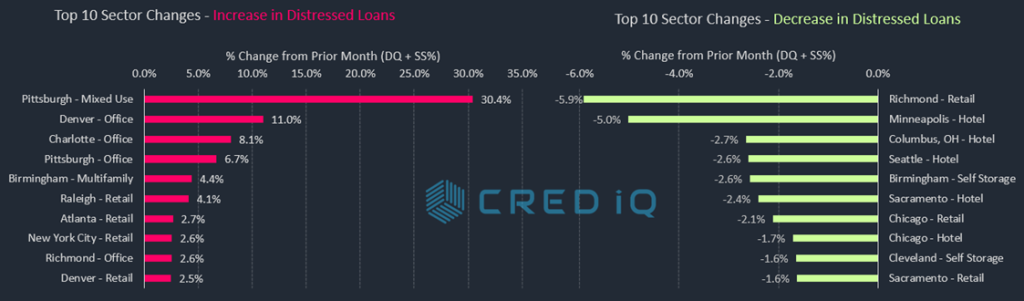
Of the 50 largest MSAs tracked by CRED iQ, 27 of those markets exhibited month-over-month declines in the percentage of distressed CRE loans. The average decline among the 27 markets with lower distressed rates was -0.2%. Notable markets with decreased levels of distress this month included Portland (-2.2%), Washington, DC (-0.8%) and Birmingham, AL (-0.7%).
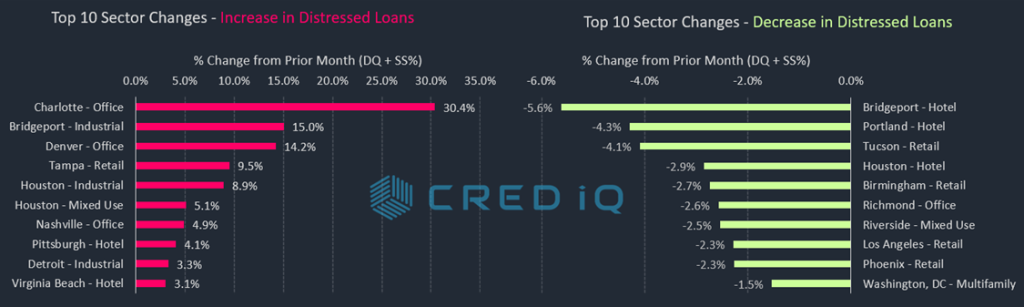
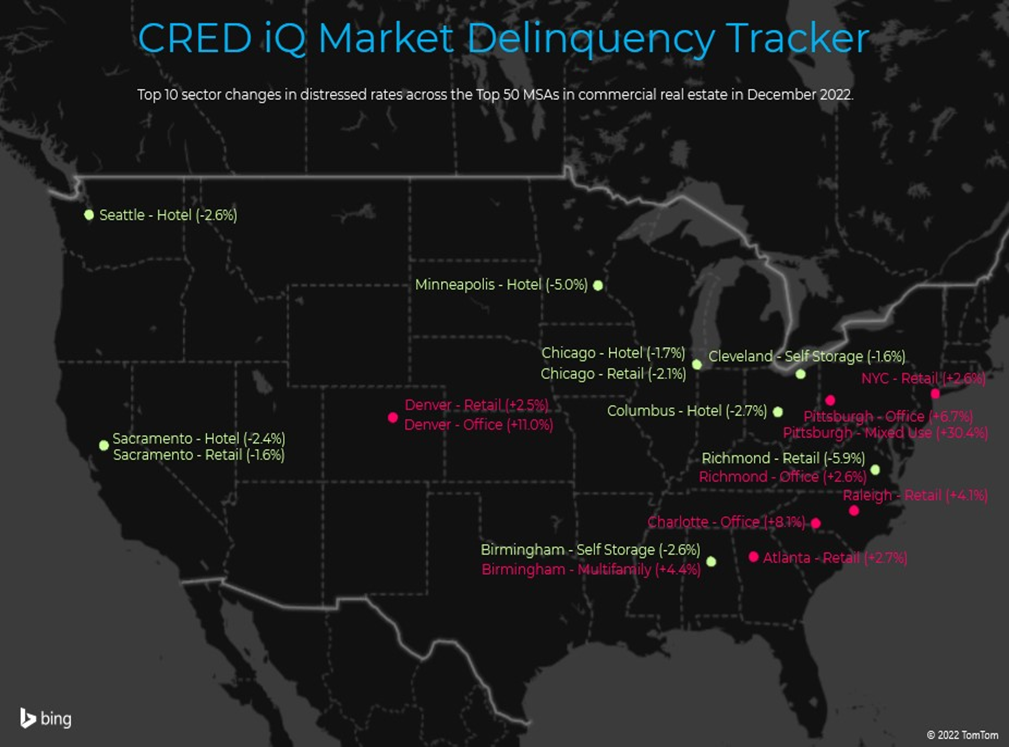
There were 23 markets with month-over-month increases in the percentage of distressed CRE loans. The average increase for these markets was +0.4%. The Charlotte MSA had the highest increase in overall distress this month (+3.7%), which was driven by adverse developments in the office sector. The Denver MSA additionally had a notable increase in distress (+1.9%) driven primarily by the office sector.
For a more granular analysis of the Top 50 markets, CRED iQ further delineated individual markets’ distressed rates by property type for a comprehensive view by market-sector. For a second consecutive month, deterioration in the office sector was a primary factor in increases in distress by market-sector. Metrics continue to worsen for the Denver office market. Last month’s Market Delinquency Tracker detailed the special servicing transfer of the $243.6 million Republic Plaza office loan. More recently, a $277.1 senior mortgage secured by Wells Fargo Center transferred to special servicing. These two credit developments pushed CRED iQ’s Denver office distressed rate to 14.2%, which compares to 7.3% just two months ago as of November 2022. Aside from Denver, the Charlotte office market exhibited a swiftly elevated increase in distress after a $160 million mortgage secured by 301 South College Street transferred to special servicing and a $120 million loan secured by Charlotte Plaza defaulted at maturity.
Another market-sector that was impacted by increased distress was the Tampa retail market. A $72.4 million loan secured by The Shops at Wiregrass, a 729,324-SF lifestyle center became 30 days delinquent as of January 2023. The property was 80% occupied as of September and has been adversely impacted by in-line tenant turnover since 2020.
Several hotel and retail markets continued to improve in January 2023. Three of the five largest percentage declines in distressed rates across market-sectors this month were lodging markets. Four of the 10 largest percentage declines were in retail markets. The Portland lodging market exhibited one of the sharpest declines in distress following a modification of a $51.9 million mortgage secured by the 205-key Westin Portland. The loan had been with the special servicer since June 2020 due to pandemic-related distress but returned to the master servicer in December 2022.
The Minneapolis MSA has the highest overall distressed rate at 20.4%, which was slightly higher than the previous month. Cleveland (10.7%), Birmingham (10.4%), Hartford (8.9%), and Milwaukee (8.7%) comprise the remaining markets with the highest rates of distress. For the second consecutive month, the Sacramento MSA (0.1%) is the market with the lowest percentage of distress among the Top 50 MSAs.
For the full Market DelinQuency Tracker Report, download here:
| MSA – Property Type | DQ/SS (millions) | DS/SS (%) | Monthly Change |
| Allentown-Bethlehem-Easton, PA-NJ MSA | $77.5 | 2.4% | 0.0% |
| Allentown – Hotel | $0.4 | 1.0% | -0.9% |
| Allentown – Industrial | $0.0 | 0.0% | 0.0% |
| Allentown – Multifamily | $0.0 | 0.0% | 0.0% |
| Allentown – Office | $58.2 | 17.9% | 0.0% |
| Allentown – Other | $0.0 | 0.0% | 0.0% |
| Allentown – Retail | $19.0 | 5.1% | 0.0% |
| Allentown – Self Storage | $0.0 | 0.0% | 0.0% |
| Atlanta – Atlanta-Sandy Springs-Marietta, GA MSA | $525.6 | 1.9% | 0.0% |
| Atlanta – Hotel | $82.1 | 3.2% | -0.1% |
| Atlanta – Industrial | $0.0 | 0.0% | 0.0% |
| Atlanta – Multifamily | $0.0 | 0.0% | 0.0% |
| Atlanta – Office | $63.9 | 3.0% | 0.4% |
| Atlanta – Other | $0.0 | 0.0% | 0.0% |
| Atlanta – Retail | $379.7 | 17.4% | -1.4% |
| Atlanta – Self Storage | $0.0 | 0.0% | 0.0% |
| Austin – Austin-Round Rock, TX MSA | $109.8 | 1.2% | 0.0% |
| Austin – Hotel | $50.3 | 5.6% | -1.0% |
| Austin – Industrial | $0.0 | 0.0% | 0.0% |
| Austin – Multifamily | $0.0 | 0.0% | 0.0% |
| Austin – Office | $0.0 | 0.0% | 0.0% |
| Austin – Other | $4.1 | 1.3% | 0.1% |
| Austin – Retail | $55.4 | 7.1% | 0.7% |
| Austin – Self Storage | $0.0 | 0.0% | 0.0% |
| Baltimore – Baltimore-Towson, MD MSA | $356.0 | 3.7% | -0.2% |
| Baltimore – Hotel | $43.8 | 9.1% | -0.4% |
| Baltimore – Industrial | $0.0 | 0.0% | 0.0% |
| Baltimore – Multifamily | $3.8 | 0.1% | 0.0% |
| Baltimore – Office | $46.6 | 5.5% | 0.3% |
| Baltimore – Other | $11.5 | 6.2% | 1.3% |
| Baltimore – Retail | $250.3 | 22.8% | 0.3% |
| Baltimore – Self Storage | $0.0 | 0.0% | 0.0% |
| Birmingham – Birmingham-Hoover, AL MSA | $321.8 | 10.4% | -0.7% |
| Birmingham – Hotel | $0.0 | 0.0% | 0.0% |
| Birmingham – Industrial | $0.0 | 0.0% | 0.0% |
| Birmingham – Multifamily | $63.2 | 4.5% | 0.0% |
| Birmingham – Office | $94.5 | 18.9% | 0.6% |
| Birmingham – Other | $0.0 | 0.0% | 0.0% |
| Birmingham – Retail | $164.2 | 23.0% | -2.7% |
| Birmingham – Self Storage | $0.0 | 0.0% | 0.0% |
| Boston – Boston-Cambridge-Quincy, MA-NH MSA | $123.1 | 0.6% | 0.0% |
| Boston – Hotel | $19.3 | 1.2% | 0.0% |
| Boston – Industrial | $0.0 | 0.0% | 0.0% |
| Boston – Multifamily | $0.0 | 0.0% | 0.0% |
| Boston – Office | $14.5 | 0.2% | 0.0% |
| Boston – Other | $0.0 | 0.0% | 0.0% |
| Boston – Retail | $89.3 | 5.1% | -0.4% |
| Boston – Self Storage | $0.0 | 0.0% | 0.0% |
| Bridgeport – Bridgeport-Stamford-Norwalk, CT MSA | $199.3 | 4.8% | -0.2% |
| Bridgeport – Hotel | $38.0 | 24.3% | -5.6% |
| Bridgeport – Industrial | $17.8 | 15.0% | 15.0% |
| Bridgeport – Multifamily | $0.0 | 0.0% | 0.0% |
| Bridgeport – Office | $133.6 | 11.1% | -2.9% |
| Bridgeport – Other | $9.8 | 3.3% | 0.8% |
| Bridgeport – Retail | $0.0 | 0.0% | 0.0% |
| Bridgeport – Self Storage | $0.0 | 0.0% | 0.0% |
| Charlotte – Charlotte-Gastonia-Concord, NC-SC MSA | $573.3 | 7.4% | 3.7% |
| Charlotte – Hotel | $35.3 | 4.0% | -0.3% |
| Charlotte – Industrial | $0.0 | 0.0% | 0.0% |
| Charlotte – Multifamily | $0.0 | 0.0% | 0.0% |
| Charlotte – Office | $355.1 | 38.4% | 30.4% |
| Charlotte – Other | $99.5 | 31.1% | -0.3% |
| Charlotte – Retail | $83.5 | 9.1% | -1.1% |
| Charlotte – Self Storage | $0.0 | 0.0% | 0.0% |
| Chicago – Chicago-Naperville-Joliet, IL-IN-WI MSA | $2,384.2 | 7.8% | 0.5% |
| Chicago – Hotel | $747.4 | 31.0% | 0.2% |
| Chicago – Industrial | $0.0 | 0.0% | 0.0% |
| Chicago – Multifamily | $53.8 | 0.6% | 0.0% |
| Chicago – Office | $1,121.7 | 12.5% | 1.0% |
| Chicago – Other | $208.4 | 8.2% | 0.0% |
| Chicago – Retail | $252.8 | 7.9% | 0.9% |
| Chicago – Self Storage | $0.0 | 0.0% | 0.0% |
| Cincinnati – Cincinnati-Middletown, OH-KY-IN MSA | $137.2 | 3.6% | 0.0% |
| Cincinnati – Hotel | $86.9 | 30.0% | 0.0% |
| Cincinnati – Industrial | $0.0 | 0.0% | 0.0% |
| Cincinnati – Multifamily | $0.0 | 0.0% | 0.0% |
| Cincinnati – Office | $0.0 | 0.0% | 0.0% |
| Cincinnati – Other | $6.8 | 2.6% | 0.0% |
| Cincinnati – Retail | $43.5 | 7.9% | 0.0% |
| Cincinnati – Self Storage | $0.0 | 0.0% | 0.0% |
| Cleveland – Cleveland-Elyria-Mentor, OH MSA | $450.2 | 10.7% | 0.4% |
| Cleveland – Hotel | $84.8 | 46.4% | 0.0% |
| Cleveland – Industrial | $0.0 | 0.0% | 0.0% |
| Cleveland – Multifamily | $0.0 | 0.0% | -0.1% |
| Cleveland – Office | $185.2 | 21.3% | 2.5% |
| Cleveland – Other | $172.5 | 42.9% | 0.0% |
| Cleveland – Retail | $7.7 | 1.1% | 0.0% |
| Cleveland – Self Storage | $0.0 | 0.0% | 0.0% |
| Columbus, OH – Columbus, OH MSA | $158.4 | 2.3% | 0.0% |
| Columbus, OH – Hotel | $19.4 | 6.8% | -0.2% |
| Columbus, OH – Industrial | $0.0 | 0.0% | 0.0% |
| Columbus, OH – Multifamily | $0.0 | 0.0% | 0.0% |
| Columbus, OH – Office | $31.0 | 4.8% | -0.1% |
| Columbus, OH – Other | $0.0 | 0.0% | 0.0% |
| Columbus, OH – Retail | $107.9 | 13.1% | -1.4% |
| Columbus, OH – Self Storage | $0.0 | 0.0% | 0.0% |
| Dallas – Dallas-Fort Worth-Arlington, TX MSA | $228.2 | 0.7% | -0.1% |
| Dallas – Hotel | $76.2 | 2.2% | -0.1% |
| Dallas – Industrial | $0.0 | 0.0% | -0.1% |
| Dallas – Multifamily | $8.5 | 0.0% | 0.0% |
| Dallas – Office | $101.0 | 3.2% | -0.3% |
| Dallas – Other | $4.9 | 0.2% | 0.0% |
| Dallas – Retail | $37.7 | 1.8% | -1.5% |
| Dallas – Self Storage | $0.0 | 0.0% | 0.0% |
| Denver – Denver-Aurora, CO MSA | $820.2 | 5.2% | 1.9% |
| Denver – Hotel | $31.6 | 4.1% | 1.5% |
| Denver – Industrial | $0.0 | 0.0% | 0.0% |
| Denver – Multifamily | $0.0 | 0.0% | 0.0% |
| Denver – Office | $675.9 | 32.4% | 14.2% |
| Denver – Other | $66.4 | 7.0% | 0.1% |
| Denver – Retail | $46.2 | 3.4% | -0.1% |
| Denver – Self Storage | $0.0 | 0.0% | 0.0% |
| Detroit – Detroit-Warren-Livonia, MI MSA | $265.5 | 2.5% | 0.3% |
| Detroit – Hotel | $84.0 | 11.4% | -0.4% |
| Detroit – Industrial | $20.4 | 3.3% | 3.3% |
| Detroit – Multifamily | $0.0 | 0.0% | 0.0% |
| Detroit – Office | $18.2 | 0.8% | 0.6% |
| Detroit – Other | $0.0 | 0.0% | 0.0% |
| Detroit – Retail | $142.8 | 9.5% | -0.6% |
| Detroit – Self Storage | $0.0 | 0.0% | 0.0% |
| Hartford – Hartford-West Hartford-East Hartford, CT MSA | $237.9 | 8.9% | -0.1% |
| Hartford – Hotel | $56.7 | 42.3% | -1.0% |
| Hartford – Industrial | $0.0 | 0.0% | 0.0% |
| Hartford – Multifamily | $0.0 | 0.0% | 0.0% |
| Hartford – Office | $25.1 | 9.2% | 0.0% |
| Hartford – Other | $0.0 | 0.0% | 0.0% |
| Hartford – Retail | $156.1 | 47.9% | 1.2% |
| Hartford – Self Storage | $0.0 | 0.0% | 0.0% |
| Houston – Houston-Sugar Land-Baytown, TX MSA | $1,177.3 | 4.4% | -0.1% |
| Houston – Hotel | $463.6 | 44.9% | -2.9% |
| Houston – Industrial | $58.8 | 8.9% | 8.9% |
| Houston – Multifamily | $12.1 | 0.1% | -0.1% |
| Houston – Office | $505.4 | 14.4% | 1.4% |
| Houston – Other | $32.4 | 5.1% | 5.1% |
| Houston – Retail | $105.0 | 2.1% | -1.4% |
| Houston – Self Storage | $0.0 | 0.0% | 0.0% |
| Indianapolis – Indianapolis-Carmel, IN MSA | $175.8 | 2.9% | 0.2% |
| Indianapolis – Hotel | $110.2 | 17.2% | 0.0% |
| Indianapolis – Industrial | $0.0 | 0.0% | 0.0% |
| Indianapolis – Multifamily | $0.0 | 0.0% | 0.0% |
| Indianapolis – Office | $60.1 | 10.3% | 0.0% |
| Indianapolis – Other | $0.0 | 0.0% | 0.0% |
| Indianapolis – Retail | $5.6 | 1.6% | -0.1% |
| Indianapolis – Self Storage | $0.0 | 0.0% | 0.0% |
| Jacksonville – Jacksonville, FL MSA | $111.9 | 2.0% | -0.1% |
| Jacksonville – Hotel | $0.0 | 0.0% | 0.0% |
| Jacksonville – Industrial | $0.0 | 0.0% | 0.0% |
| Jacksonville – Multifamily | $0.0 | 0.0% | 0.0% |
| Jacksonville – Office | $0.0 | 0.0% | 0.0% |
| Jacksonville – Other | $0.0 | 0.0% | 0.0% |
| Jacksonville – Retail | $111.9 | 28.6% | 0.0% |
| Jacksonville – Self Storage | $0.0 | 0.0% | 0.0% |
| Kansas City – Kansas City, MO-KS MSA | $81.2 | 1.4% | 0.1% |
| Kansas City – Hotel | $28.9 | 11.4% | -1.0% |
| Kansas City – Industrial | $0.0 | 0.0% | 0.0% |
| Kansas City – Multifamily | $3.8 | 0.1% | 0.1% |
| Kansas City – Office | $0.0 | 0.0% | 0.0% |
| Kansas City – Other | $0.0 | 0.0% | 0.0% |
| Kansas City – Retail | $48.4 | 8.4% | 0.4% |
| Kansas City – Self Storage | $0.0 | 0.0% | 0.0% |
| Las Vegas – Las Vegas-Paradise, NV MSA | $258.4 | 1.2% | -0.1% |
| Las Vegas – Hotel | $0.0 | 0.0% | 0.0% |
| Las Vegas – Industrial | $0.0 | 0.0% | 0.0% |
| Las Vegas – Multifamily | $0.0 | 0.0% | 0.0% |
| Las Vegas – Office | $0.0 | 0.0% | -0.5% |
| Las Vegas – Other | $0.0 | 0.0% | 0.0% |
| Las Vegas – Retail | $258.4 | 6.6% | 0.2% |
| Las Vegas – Self Storage | $0.0 | 0.0% | 0.0% |
| Los Angeles – Los Angeles-Long Beach-Santa Ana, CA MSA | $1,009.2 | 1.8% | 0.2% |
| Los Angeles – Hotel | $84.3 | 1.4% | -1.3% |
| Los Angeles – Industrial | $0.0 | 0.0% | 0.0% |
| Los Angeles – Multifamily | $270.0 | 1.2% | 1.2% |
| Los Angeles – Office | $34.3 | 0.3% | -0.3% |
| Los Angeles – Other | $56.5 | 1.6% | 0.0% |
| Los Angeles – Retail | $564.2 | 6.8% | -2.3% |
| Los Angeles – Self Storage | $0.0 | 0.0% | 0.0% |
| Louisville – Louisville/Jefferson County, KY-IN MSA | $70.4 | 2.3% | 0.0% |
| Louisville – Hotel | $0.0 | 0.0% | 0.0% |
| Louisville – Industrial | $0.0 | 0.0% | 0.0% |
| Louisville – Multifamily | $0.0 | 0.0% | 0.0% |
| Louisville – Office | $0.0 | 0.0% | 0.0% |
| Louisville – Other | $0.0 | 0.0% | 0.0% |
| Louisville – Retail | $70.4 | 14.3% | -0.4% |
| Louisville – Self Storage | $0.0 | 0.0% | 0.0% |
| Memphis – Memphis, TN-AR-MS MSA | $72.9 | 3.0% | 0.0% |
| Memphis – Hotel | $12.4 | 5.4% | -0.6% |
| Memphis – Industrial | $0.0 | 0.0% | 0.0% |
| Memphis – Multifamily | $0.0 | 0.0% | 0.0% |
| Memphis – Office | $0.0 | 0.0% | 0.0% |
| Memphis – Other | $0.0 | 0.0% | 0.0% |
| Memphis – Retail | $60.6 | 16.7% | 0.0% |
| Memphis – Self Storage | $0.0 | 0.0% | 0.0% |
| Miami – Miami-Fort Lauderdale-Pompano Beach, FL MSA | $267.7 | 1.0% | 0.0% |
| Miami – Hotel | $40.5 | 0.8% | 0.0% |
| Miami – Industrial | $0.0 | 0.0% | -0.4% |
| Miami – Multifamily | $0.0 | 0.0% | 0.0% |
| Miami – Office | $4.0 | 0.2% | 0.0% |
| Miami – Other | $0.0 | 0.0% | 0.0% |
| Miami – Retail | $223.1 | 4.1% | 0.2% |
| Miami – Self Storage | $0.0 | 0.0% | 0.0% |
| Milwaukee – Milwaukee-Waukesha-West Allis, WI MSA | $219.8 | 8.7% | 0.1% |
| Milwaukee – Hotel | $16.6 | 10.3% | 0.0% |
| Milwaukee – Industrial | $0.0 | 0.0% | 0.0% |
| Milwaukee – Multifamily | $0.0 | 0.0% | 0.0% |
| Milwaukee – Office | $96.8 | 17.7% | 0.8% |
| Milwaukee – Other | $0.2 | 0.2% | 0.0% |
| Milwaukee – Retail | $106.1 | 23.0% | -0.6% |
| Milwaukee – Self Storage | $0.0 | 0.0% | 0.0% |
| Minneapolis – Minneapolis-St. Paul-Bloomington, MN-WI MSA | $1,728.9 | 20.4% | 0.1% |
| Minneapolis – Hotel | $239.7 | 39.0% | 0.3% |
| Minneapolis – Industrial | $0.0 | 0.0% | 0.0% |
| Minneapolis – Multifamily | $20.5 | 0.7% | 0.7% |
| Minneapolis – Office | $64.6 | 3.2% | -0.1% |
| Minneapolis – Other | $4.1 | 0.8% | -0.2% |
| Minneapolis – Retail | $1,400.0 | 74.2% | -2.9% |
| Minneapolis – Self Storage | $0.0 | 0.0% | 0.0% |
| Nashville – Nashville-Davidson-Murfreesboro-Franklin, TN MSA | $88.5 | 1.4% | 0.5% |
| Nashville – Hotel | $51.9 | 3.6% | 0.0% |
| Nashville – Industrial | $0.0 | 0.0% | 0.0% |
| Nashville – Multifamily | $0.0 | 0.0% | 0.0% |
| Nashville – Office | $23.5 | 4.9% | 4.9% |
| Nashville – Other | $0.0 | 0.0% | 0.0% |
| Nashville – Retail | $13.1 | 1.8% | 0.5% |
| Nashville – Self Storage | $0.0 | 0.0% | 0.0% |
| New Orleans – New Orleans-Metairie-Kenner, LA MSA | $132.1 | 3.7% | 0.0% |
| New Orleans – Hotel | $59.9 | 5.1% | -0.1% |
| New Orleans – Industrial | $0.0 | 0.0% | 0.0% |
| New Orleans – Multifamily | $8.3 | 0.9% | 0.0% |
| New Orleans – Office | $27.1 | 5.5% | 0.5% |
| New Orleans – Other | $14.7 | 9.5% | 0.0% |
| New Orleans – Retail | $22.0 | 3.2% | 0.2% |
| New Orleans – Self Storage | $0.0 | 0.0% | 0.0% |
| New York City – New York-Northern New Jersey-Long Island, NY-NJ-PA MSA | $6,843.7 | 5.0% | 0.0% |
| New York City – Hotel | $907.4 | 23.2% | -1.4% |
| New York City – Industrial | $98.7 | 2.3% | -0.1% |
| New York City – Multifamily | $261.5 | 0.7% | 0.1% |
| New York City – Office | $1,921.6 | 3.8% | 0.8% |
| New York City – Other | $1,563.7 | 6.3% | -1.3% |
| New York City – Retail | $2,090.8 | 15.2% | -0.8% |
| New York City – Self Storage | $0.0 | 0.0% | 0.0% |
| Orlando – Orlando-Kissimmee, FL MSA | $114.0 | 1.1% | -0.2% |
| Orlando – Hotel | $27.9 | 1.0% | -0.9% |
| Orlando – Industrial | $0.0 | 0.0% | 0.0% |
| Orlando – Multifamily | $0.0 | 0.0% | 0.0% |
| Orlando – Office | $57.7 | 13.5% | 0.5% |
| Orlando – Other | $0.0 | 0.0% | 0.0% |
| Orlando – Retail | $28.5 | 3.1% | 0.0% |
| Orlando – Self Storage | $0.0 | 0.0% | 0.0% |
| Philadelphia – Philadelphia-Camden-Wilmington, PA-NJ-DE-MD MSA | $832.6 | 3.9% | 0.2% |
| Philadelphia – Hotel | $98.9 | 10.7% | 3.0% |
| Philadelphia – Industrial | $10.4 | 0.3% | 0.0% |
| Philadelphia – Multifamily | $41.2 | 0.4% | -0.4% |
| Philadelphia – Office | $285.0 | 6.7% | 1.2% |
| Philadelphia – Other | $378.0 | 30.6% | 0.6% |
| Philadelphia – Retail | $19.2 | 0.9% | 0.0% |
| Philadelphia – Self Storage | $0.0 | 0.0% | 0.0% |
| Phoenix – Phoenix-Mesa-Scottsdale, AZ MSA | $222.5 | 1.1% | -0.1% |
| Phoenix – Hotel | $32.0 | 1.9% | -0.1% |
| Phoenix – Industrial | $0.0 | 0.0% | 0.0% |
| Phoenix – Multifamily | $0.0 | 0.0% | 0.0% |
| Phoenix – Office | $55.8 | 2.5% | -0.1% |
| Phoenix – Other | $0.0 | 0.0% | 0.0% |
| Phoenix – Retail | $134.7 | 6.1% | -2.3% |
| Phoenix – Self Storage | $0.0 | 0.0% | 0.0% |
| Pittsburgh – Pittsburgh, PA MSA | $256.2 | 5.5% | 0.3% |
| Pittsburgh – Hotel | $26.7 | 12.8% | 4.1% |
| Pittsburgh – Industrial | $0.0 | 0.0% | 0.0% |
| Pittsburgh – Multifamily | $0.1 | 0.0% | 0.0% |
| Pittsburgh – Office | $104.5 | 10.0% | 0.4% |
| Pittsburgh – Other | $117.1 | 33.1% | 0.0% |
| Pittsburgh – Retail | $7.8 | 1.3% | 0.0% |
| Pittsburgh – Self Storage | $0.0 | 0.0% | 0.0% |
| Portland – Portland-Vancouver-Beaverton, OR-WA MSA | $532.5 | 6.0% | -2.2% |
| Portland – Hotel | $296.3 | 34.0% | -4.3% |
| Portland – Industrial | $0.0 | 0.0% | 0.0% |
| Portland – Multifamily | $0.0 | 0.0% | -0.2% |
| Portland – Office | $25.3 | 5.4% | 2.3% |
| Portland – Other | $0.0 | 0.0% | 0.0% |
| Portland – Retail | $211.0 | 43.0% | 0.2% |
| Portland – Self Storage | $0.0 | 0.0% | 0.0% |
| Raleigh – Raleigh-Cary, NC MSA | $25.9 | 0.7% | 0.0% |
| Raleigh – Hotel | $15.3 | 6.6% | -0.6% |
| Raleigh – Industrial | $0.0 | 0.0% | 0.0% |
| Raleigh – Multifamily | $0.0 | 0.0% | 0.0% |
| Raleigh – Office | $0.0 | 0.0% | 0.0% |
| Raleigh – Other | $0.0 | 0.0% | 0.0% |
| Raleigh – Retail | $10.6 | 3.9% | -0.2% |
| Raleigh – Self Storage | $0.0 | 0.0% | 0.0% |
| Richmond – Richmond, VA MSA | $158.5 | 4.8% | -0.4% |
| Richmond – Hotel | $0.0 | 0.0% | 0.0% |
| Richmond – Industrial | $0.0 | 0.0% | 0.0% |
| Richmond – Multifamily | $0.0 | 0.0% | 0.0% |
| Richmond – Office | $0.0 | 0.0% | -2.6% |
| Richmond – Other | $12.9 | 8.9% | 0.0% |
| Richmond – Retail | $145.7 | 30.7% | -1.5% |
| Richmond – Self Storage | $0.0 | 0.0% | 0.0% |
| Riverside – Riverside-San Bernardino-Ontario, CA MSA | $311.5 | 3.0% | 0.2% |
| Riverside – Hotel | $51.3 | 11.2% | -0.2% |
| Riverside – Industrial | $0.0 | 0.0% | 0.0% |
| Riverside – Multifamily | $0.0 | 0.0% | 0.0% |
| Riverside – Office | $0.0 | 0.0% | 0.0% |
| Riverside – Other | $0.0 | 0.0% | -2.5% |
| Riverside – Retail | $260.3 | 12.9% | 1.5% |
| Riverside – Self Storage | $0.0 | 0.0% | 0.0% |
| Sacramento – Sacramento-Arden-Arcade-Roseville, CA MSA | $6.1 | 0.1% | 0.0% |
| Sacramento – Hotel | $0.0 | 0.0% | 0.0% |
| Sacramento – Industrial | $0.0 | 0.0% | 0.0% |
| Sacramento – Multifamily | $0.0 | 0.0% | 0.0% |
| Sacramento – Office | $6.1 | 0.8% | 0.0% |
| Sacramento – Other | $0.0 | 0.0% | 0.0% |
| Sacramento – Retail | $0.0 | 0.0% | 0.0% |
| Sacramento – Self Storage | $0.0 | 0.0% | 0.0% |
| Salt Lake City – Salt Lake City, UT MSA | $6.1 | 0.1% | 0.0% |
| Salt Lake City – Hotel | $6.1 | 2.1% | -0.1% |
| Salt Lake City – Industrial | $0.0 | 0.0% | 0.0% |
| Salt Lake City – Multifamily | $0.0 | 0.0% | 0.0% |
| Salt Lake City – Office | $0.0 | 0.0% | 0.0% |
| Salt Lake City – Other | $0.0 | 0.0% | 0.0% |
| Salt Lake City – Retail | $0.0 | 0.0% | 0.0% |
| Salt Lake City – Self Storage | $0.0 | 0.0% | 0.0% |
| San Antonio – San Antonio, TX MSA | $140.1 | 2.1% | 0.0% |
| San Antonio – Hotel | $16.7 | 6.2% | -0.1% |
| San Antonio – Industrial | $0.0 | 0.0% | 0.0% |
| San Antonio – Multifamily | $7.9 | 0.2% | 0.0% |
| San Antonio – Office | $0.0 | 0.0% | 0.0% |
| San Antonio – Other | $0.0 | 0.0% | 0.0% |
| San Antonio – Retail | $115.5 | 14.7% | 0.5% |
| San Antonio – Self Storage | $0.0 | 0.0% | 0.0% |
| San Diego – San Diego-Carlsbad-San Marcos, CA MSA | $46.4 | 0.4% | -0.1% |
| San Diego – Hotel | $39.4 | 3.3% | -0.1% |
| San Diego – Industrial | $0.0 | 0.0% | 0.0% |
| San Diego – Multifamily | $4.2 | 0.1% | 0.0% |
| San Diego – Office | $0.0 | 0.0% | 0.0% |
| San Diego – Other | $0.0 | 0.0% | -1.3% |
| San Diego – Retail | $2.9 | 0.2% | 0.0% |
| San Diego – Self Storage | $0.0 | 0.0% | 0.0% |
| San Francisco – San Francisco-Oakland-Fremont, CA MSA | $733.0 | 2.7% | 0.0% |
| San Francisco – Hotel | $100.7 | 2.5% | -1.0% |
| San Francisco – Industrial | $0.0 | 0.0% | 0.0% |
| San Francisco – Multifamily | $459.5 | 5.8% | 0.0% |
| San Francisco – Office | $86.8 | 0.9% | 0.6% |
| San Francisco – Other | $38.6 | 1.4% | -0.6% |
| San Francisco – Retail | $47.4 | 4.3% | 0.2% |
| San Francisco – Self Storage | $0.0 | 0.0% | 0.0% |
| San Jose – San Jose-Sunnyvale-Santa Clara, CA MSA | $59.0 | 0.3% | 0.0% |
| San Jose – Hotel | $35.5 | 0.5% | 0.0% |
| San Jose – Industrial | $0.0 | 0.0% | 0.0% |
| San Jose – Multifamily | $0.0 | 0.0% | 0.0% |
| San Jose – Office | $23.5 | 0.3% | 0.0% |
| San Jose – Other | $0.0 | 0.0% | 0.0% |
| San Jose – Retail | $0.0 | 0.0% | 0.0% |
| San Jose – Self Storage | $0.0 | 0.0% | 0.0% |
| Seattle – Seattle-Tacoma-Bellevue, WA MSA | $61.5 | 0.3% | 0.1% |
| Seattle – Hotel | $61.5 | 4.4% | 1.8% |
| Seattle – Industrial | $0.0 | 0.0% | 0.0% |
| Seattle – Multifamily | $0.0 | 0.0% | 0.0% |
| Seattle – Office | $0.0 | 0.0% | 0.0% |
| Seattle – Other | $0.0 | 0.0% | 0.0% |
| Seattle – Retail | $0.0 | 0.0% | 0.0% |
| Seattle – Self Storage | $0.0 | 0.0% | 0.0% |
| St. Louis – St. Louis, MO-IL MSA | $215.1 | 5.1% | 0.0% |
| St. Louis – Hotel | $1.7 | 0.6% | 0.1% |
| St. Louis – Industrial | $0.0 | 0.0% | 0.0% |
| St. Louis – Multifamily | $3.2 | 0.2% | 0.0% |
| St. Louis – Office | $0.0 | 0.0% | 0.0% |
| St. Louis – Other | $19.5 | 3.9% | 0.0% |
| St. Louis – Retail | $190.7 | 20.7% | 0.1% |
| St. Louis – Self Storage | $0.0 | 0.0% | 0.0% |
| Tampa – Tampa-St. Petersburg-Clearwater, FL | $192.5 | 2.0% | 0.7% |
| Tampa – Hotel | $59.0 | 8.2% | -0.3% |
| Tampa – Industrial | $0.0 | 0.0% | 0.0% |
| Tampa – Multifamily | $0.0 | 0.0% | 0.0% |
| Tampa – Office | $23.3 | 3.1% | -0.3% |
| Tampa – Other | $0.0 | 0.0% | 0.0% |
| Tampa – Retail | $110.2 | 14.6% | 9.5% |
| Tampa – Self Storage | $0.0 | 0.0% | 0.0% |
| Tucson – Tucson, AZ MSA | $157.7 | 4.3% | -0.4% |
| Tucson – Hotel | $0.0 | 0.0% | 0.0% |
| Tucson – Industrial | $0.0 | 0.0% | 0.0% |
| Tucson – Multifamily | $0.0 | 0.0% | 0.0% |
| Tucson – Office | $0.0 | 0.0% | 0.0% |
| Tucson – Other | $0.0 | 0.0% | 0.0% |
| Tucson – Retail | $157.7 | 15.3% | -4.1% |
| Tucson – Self Storage | $0.0 | 0.0% | 0.0% |
| Virginia Beach – Virginia Beach-Norfolk-Newport News, VA-NC MSA | $177.3 | 3.6% | 0.2% |
| Virginia Beach – Hotel | $13.6 | 3.1% | 3.1% |
| Virginia Beach – Industrial | $0.0 | 0.0% | 0.0% |
| Virginia Beach – Multifamily | $0.0 | 0.0% | 0.0% |
| Virginia Beach – Office | $0.0 | 0.0% | 0.0% |
| Virginia Beach – Other | $0.0 | 0.0% | 0.0% |
| Virginia Beach – Retail | $163.7 | 18.9% | -1.2% |
| Virginia Beach – Self Storage | $0.0 | 0.0% | 0.0% |
| Washington, DC – Washington-Arlington-Alexandria, DC-VA-MD-WV MSA | $606.5 | 1.8% | -0.8% |
| Washington, DC – Hotel | $35.7 | 3.1% | -0.2% |
| Washington, DC – Industrial | $0.0 | 0.0% | 0.0% |
| Washington, DC – Multifamily | $0.0 | 0.0% | -1.5% |
| Washington, DC – Office | $463.5 | 6.1% | 0.0% |
| Washington, DC – Other | $32.9 | 2.1% | -0.1% |
| Washington, DC – Retail | $74.3 | 2.2% | -0.1% |
| Washington, DC – Self Storage | $0.0 | 0.0% | 0.0% |
| Grand Total | $24,060.9 | 3.2% | 0.1% |
About CRED iQ
CRED iQ is a commercial real estate data, analytics, and valuation platform providing actionable intelligence to CRE and capital markets investors. Subscribers to CRED iQ use the platform to identify valuable leads for leasing, lending, refinancing, distressed debt, and acquisition opportunities. Our data platform is powered by over $2.0 trillion of CMBS, CRE CLO, SBLL, Ginnie Mae, FHA/HUD, and Freddie Mac loan and property data.