
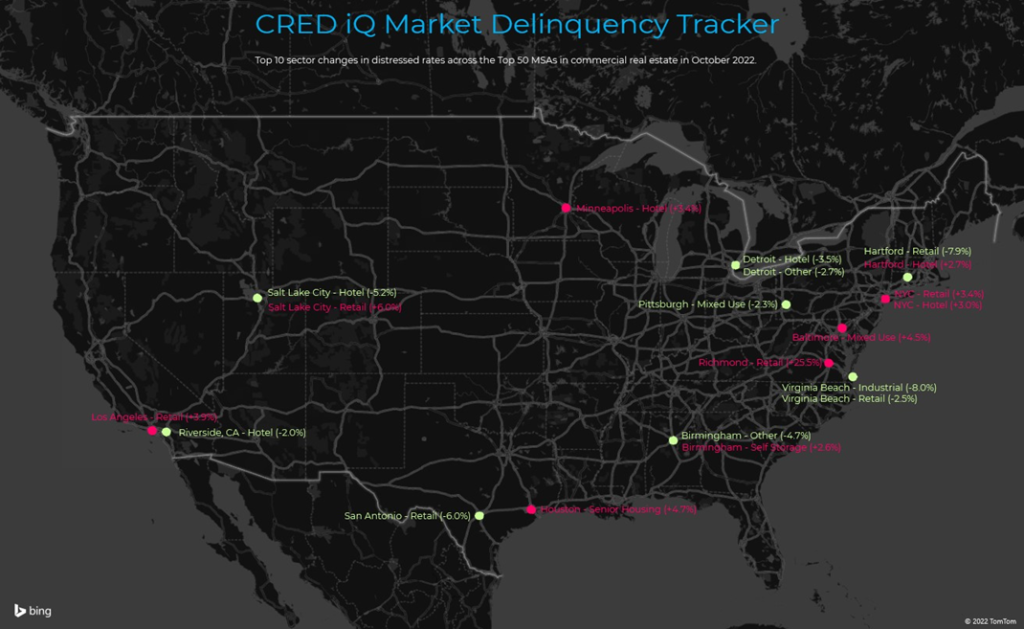
CRED iQ monitors distressed rates and market performance for nearly 400 MSAs across the United States, covering over $900 billion in outstanding commercial real estate (CRE) debt. Distressed rates (DQ + SS%) include loans that are specially serviced, delinquent, or a combination of both. Distressed rates and month-over-month changes for data reported as of October 2022 are presented below for the 50 largest MSAs, broken out by property type for a granular view of distress by market-sector.
Of the 50 largest MSAs tracked by CRED iQ, there were 27 markets that exhibited month-over-month decreases in the percentage of distressed CRE loans within the CMBS universe. Total markets with month-over-month improvements in distressed rates outnumbered markets with distressed rate increases. Notable markets with improvements in distress included Portland, OR (-1.65%), Kansas City, MO (-1.23%), and Cleveland (-1.05%). The Richmond, VA market (+2.93%) exhibited the largest percentage increase in distressed commercial real estate loans during October 2022.
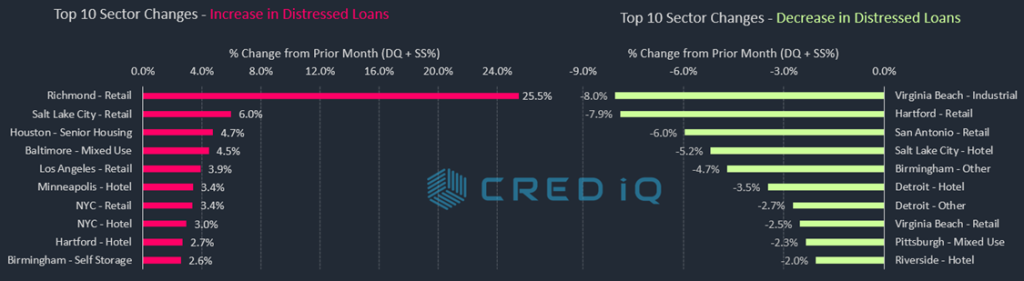
For a more granular analysis of the Top 50 markets, CRED iQ further delineated individual market distressed rates by property type for a comprehensive view by market-sector. In the case of higher CRE distress for in the Richmond market relative to last month, the adverse developments can be traced to the retail market. In particular, a $92.4 million mortgage secured by Chesterfield Towne Center transferred to special servicing in September 2022 before it defaulted at maturity in October 2022. Collateral for the loan includes over 1 million sf of retail space between a regional mall and adjacent freestanding retail suites. The regional mall features traditional anchor boxes such as Macy’s, JCPenney, and At Home, as well as a vacant former Sears. A maturity extension is a viable option for the loan, but conveyance of the property remains within the range of outcomes.
The retail property type was associated with four of the 10 sharpest percentage increases in distressed rates across market-sectors during October 2022. In addition to Richmond, retail markets for Salt Lake City (+6.0%), Los Angeles (+3.9%), and New York City (3.4%) had percentage increases in distressed rates this month.
Market-sectors with month-over-month improvements in distressed rates varied by property type. Hotel, Retail, Industrial, Mixed-Use, and Other/Specialty Use were represented across Top 10 market-sector declines in distressed rates. The Virginia Beach industrial market (-8.0%) exhibited the highest percentage improvement compared to September 2022. A distressed workout of the Commonwealth Commerce Center, a 703,170-sf industrial complex in Suffolk, VA. The REO property was liquidated and resolved $21.2 million in outstanding debt.
The Minneapolis MSA has the highest overall distressed rate at 20.6%, which was in line with the previous month. Birmingham (9.6%), Cleveland (8.9%), Milwaukee (8.8%), and Hartford (8.3%) comprise the remaining markets with the highest rates of distress. Milwaukee was a new addition to the Top 5 distressed markets this month, displacing Portland. The Jacksonville market (0.1%) had the lowest percentage of distress among the Top 50 MSAs for the third consecutive month.
For the full CRED DQ Report, download here:
| MSA – Property Type | DQ/SS (millions) | DS/SS (%) | Monthly Change |
| Allentown-Bethlehem-Easton, PA-NJ MSA | $78.3 | 2.6% | 0.1% |
| Allentown – Hotel | $0.8 | 2.1% | 2.1% |
| Allentown – Industrial | $0.0 | 0.0% | 0.0% |
| Allentown – Multifamily | $0.0 | 0.0% | 0.0% |
| Allentown – Office | $58.5 | 19.1% | 0.0% |
| Allentown – Other | $0.0 | 0.0% | 0.0% |
| Allentown – Retail | $19.0 | 5.1% | 0.1% |
| Allentown – Self Storage | $0.0 | 0.0% | 0.0% |
| Atlanta – Atlanta-Sandy Springs-Marietta, GA MSA | $411.7 | 1.5% | -0.4% |
| Atlanta – Hotel | $131.9 | 5.4% | -1.5% |
| Atlanta – Industrial | $0.0 | 0.0% | 0.0% |
| Atlanta – Multifamily | $0.0 | 0.0% | 0.0% |
| Atlanta – Office | $69.4 | 3.4% | 0.1% |
| Atlanta – Other | $0.0 | 0.0% | 0.0% |
| Atlanta – Retail | $210.4 | 11.7% | -4.0% |
| Atlanta – Self Storage | $0.0 | 0.0% | 0.0% |
| Austin – Austin-Round Rock, TX MSA | $132.8 | 1.5% | -0.2% |
| Austin – Hotel | $33.4 | 4.5% | -1.9% |
| Austin – Industrial | $0.0 | 0.0% | 0.0% |
| Austin – Multifamily | $40.1 | 0.7% | 0.0% |
| Austin – Office | $0.0 | 0.0% | 0.0% |
| Austin – Other | $10.0 | 2.7% | 0.1% |
| Austin – Retail | $49.3 | 6.6% | 0.2% |
| Austin – Self Storage | $0.0 | 0.0% | 0.0% |
| Baltimore – Baltimore-Towson, MD MSA | $361.4 | 3.6% | -0.1% |
| Baltimore – Hotel | $44.0 | 10.0% | -0.7% |
| Baltimore – Industrial | $0.0 | 0.0% | 0.0% |
| Baltimore – Multifamily | $3.8 | 0.1% | 0.0% |
| Baltimore – Office | $40.9 | 2.3% | -0.9% |
| Baltimore – Other | $21.9 | 9.0% | 4.5% |
| Baltimore – Retail | $250.8 | 22.7% | 0.0% |
| Baltimore – Self Storage | $0.0 | 0.0% | 0.0% |
| Birmingham – Birmingham-Hoover, AL MSA | $282.4 | 9.7% | 0.0% |
| Birmingham – Hotel | $0.0 | 0.0% | 0.0% |
| Birmingham – Industrial | $0.0 | 0.0% | 0.0% |
| Birmingham – Multifamily | $2.1 | 0.2% | 0.0% |
| Birmingham – Office | $95.0 | 19.1% | 0.3% |
| Birmingham – Other | $0.0 | 0.0% | -4.7% |
| Birmingham – Retail | $184.4 | 27.1% | 0.8% |
| Birmingham – Self Storage | $0.9 | 2.6% | 2.6% |
| Boston – Boston-Cambridge-Quincy, MA-NH MSA | $131.2 | 0.7% | 0.0% |
| Boston – Hotel | $26.7 | 1.6% | 0.0% |
| Boston – Industrial | $0.0 | 0.0% | 0.0% |
| Boston – Multifamily | $0.0 | 0.0% | 0.0% |
| Boston – Office | $14.5 | 0.2% | 0.0% |
| Boston – Other | $0.0 | 0.0% | 0.0% |
| Boston – Retail | $90.0 | 8.2% | -0.1% |
| Boston – Self Storage | $0.0 | 0.0% | 0.0% |
| Bridgeport – Bridgeport-Stamford-Norwalk, CT MSA | $145.3 | 3.8% | -0.9% |
| Bridgeport – Hotel | $1.0 | 1.2% | -32.9% |
| Bridgeport – Industrial | $0.0 | 0.0% | 0.0% |
| Bridgeport – Multifamily | $0.0 | 0.0% | 0.0% |
| Bridgeport – Office | $134.5 | 12.9% | 0.1% |
| Bridgeport – Other | $9.8 | 2.6% | 0.1% |
| Bridgeport – Retail | $0.0 | 0.0% | 0.0% |
| Bridgeport – Self Storage | $0.0 | 0.0% | 0.0% |
| Charlotte – Charlotte-Gastonia-Concord, NC-SC MSA | $248.0 | 3.4% | 0.0% |
| Charlotte – Hotel | $60.5 | 7.0% | -0.7% |
| Charlotte – Industrial | $0.0 | 0.0% | 0.0% |
| Charlotte – Multifamily | $0.0 | 0.0% | 0.0% |
| Charlotte – Office | $0.0 | 0.0% | 0.0% |
| Charlotte – Other | $100.5 | 40.3% | 0.3% |
| Charlotte – Retail | $87.0 | 9.7% | 1.6% |
| Charlotte – Self Storage | $0.0 | 0.0% | 0.0% |
| Chicago – Chicago-Naperville-Joliet, IL-IN-WI MSA | $2,247.4 | 7.7% | -0.2% |
| Chicago – Hotel | $814.9 | 31.6% | -1.3% |
| Chicago – Industrial | $0.0 | 0.0% | 0.0% |
| Chicago – Multifamily | $58.9 | 0.6% | 0.0% |
| Chicago – Office | $898.0 | 11.5% | 0.1% |
| Chicago – Other | $208.8 | 8.2% | -0.1% |
| Chicago – Retail | $266.9 | 9.2% | -0.1% |
| Chicago – Self Storage | $0.0 | 0.0% | 0.0% |
| Cincinnati – Cincinnati-Middletown, OH-KY-IN MSA | $108.6 | 2.9% | -0.3% |
| Cincinnati – Hotel | $87.4 | 29.5% | 0.0% |
| Cincinnati – Industrial | $0.0 | 0.0% | 0.0% |
| Cincinnati – Multifamily | $2.3 | 0.1% | 0.0% |
| Cincinnati – Office | $0.0 | 0.0% | 0.0% |
| Cincinnati – Other | $6.8 | 2.6% | 0.0% |
| Cincinnati – Retail | $12.1 | 2.4% | -1.7% |
| Cincinnati – Self Storage | $0.0 | 0.0% | 0.0% |
| Cleveland – Cleveland-Elyria-Mentor, OH MSA | $351.1 | 8.8% | -1.0% |
| Cleveland – Hotel | $85.1 | 47.4% | 0.0% |
| Cleveland – Industrial | $0.0 | 0.0% | 0.0% |
| Cleveland – Multifamily | $5.6 | 0.3% | 0.0% |
| Cleveland – Office | $83.0 | 10.1% | -4.4% |
| Cleveland – Other | $168.8 | 42.7% | -0.3% |
| Cleveland – Retail | $7.7 | 1.1% | 0.0% |
| Cleveland – Self Storage | $0.8 | 1.7% | 1.7% |
| Columbus, OH – Columbus, OH MSA | $197.7 | 2.9% | -0.4% |
| Columbus, OH – Hotel | $37.8 | 12.4% | -0.9% |
| Columbus, OH – Industrial | $11.7 | 2.8% | -0.2% |
| Columbus, OH – Multifamily | $9.4 | 0.2% | -0.3% |
| Columbus, OH – Office | $30.1 | 4.8% | 0.0% |
| Columbus, OH – Other | $0.0 | 0.0% | 0.0% |
| Columbus, OH – Retail | $108.6 | 15.1% | -0.6% |
| Columbus, OH – Self Storage | $0.0 | 0.0% | 0.0% |
| Dallas – Dallas-Fort Worth-Arlington, TX MSA | $241.2 | 0.7% | -0.1% |
| Dallas – Hotel | $78.0 | 2.3% | -0.3% |
| Dallas – Industrial | $1.7 | 0.1% | 0.0% |
| Dallas – Multifamily | $7.1 | 0.0% | -0.2% |
| Dallas – Office | $83.4 | 2.8% | 0.0% |
| Dallas – Other | $4.9 | 0.2% | 0.0% |
| Dallas – Retail | $66.1 | 3.4% | 0.8% |
| Dallas – Self Storage | $0.0 | 0.0% | 0.0% |
| Denver – Denver-Aurora, CO MSA | $283.0 | 1.8% | -0.2% |
| Denver – Hotel | $23.8 | 3.0% | 0.3% |
| Denver – Industrial | $0.0 | 0.0% | 0.0% |
| Denver – Multifamily | $0.0 | 0.0% | -0.1% |
| Denver – Office | $147.1 | 7.3% | -1.6% |
| Denver – Other | $94.3 | 10.0% | 0.2% |
| Denver – Retail | $17.8 | 1.4% | 0.1% |
| Denver – Self Storage | $0.0 | 0.0% | 0.0% |
| Detroit – Detroit-Warren-Livonia, MI MSA | $249.2 | 2.5% | -0.4% |
| Detroit – Hotel | $84.2 | 12.0% | -3.5% |
| Detroit – Industrial | $0.0 | 0.0% | 0.0% |
| Detroit – Multifamily | $0.0 | 0.0% | 0.0% |
| Detroit – Office | $14.6 | 0.7% | 0.0% |
| Detroit – Other | $0.0 | 0.0% | -2.7% |
| Detroit – Retail | $150.4 | 11.3% | 0.8% |
| Detroit – Self Storage | $0.0 | 0.0% | 0.0% |
| Hartford – Hartford-West Hartford-East Hartford, CT MSA | $202.1 | 8.3% | -0.3% |
| Hartford – Hotel | $19.7 | 21.5% | 2.7% |
| Hartford – Industrial | $0.0 | 0.0% | 0.0% |
| Hartford – Multifamily | $0.0 | 0.0% | 0.0% |
| Hartford – Office | $25.3 | 10.2% | 0.7% |
| Hartford – Other | $0.0 | 0.0% | 0.0% |
| Hartford – Retail | $157.2 | 46.7% | -7.9% |
| Hartford – Self Storage | $0.0 | 0.0% | 0.0% |
| Houston – Houston-Sugar Land-Baytown, TX MSA | $1,096.4 | 4.6% | 0.3% |
| Houston – Hotel | $383.3 | 40.0% | -1.0% |
| Houston – Industrial | $0.0 | 0.0% | 0.0% |
| Houston – Multifamily | $26.8 | 0.2% | 0.0% |
| Houston – Office | $502.7 | 15.9% | 1.9% |
| Houston – Other | $74.8 | 11.2% | 4.7% |
| Houston – Retail | $108.6 | 2.8% | 0.0% |
| Houston – Self Storage | $0.0 | 0.0% | 0.0% |
| Indianapolis – Indianapolis-Carmel, IN MSA | $209.5 | 3.4% | -0.6% |
| Indianapolis – Hotel | $96.9 | 15.1% | -1.8% |
| Indianapolis – Industrial | $0.0 | 0.0% | 0.0% |
| Indianapolis – Multifamily | $40.4 | 1.4% | 0.0% |
| Indianapolis – Office | $61.7 | 10.4% | 0.0% |
| Indianapolis – Other | $4.9 | 1.9% | 0.0% |
| Indianapolis – Retail | $5.6 | 2.0% | 0.1% |
| Indianapolis – Self Storage | $0.0 | 0.0% | 0.0% |
| Jacksonville – Jacksonville, FL MSA | $5.0 | 0.1% | 0.0% |
| Jacksonville – Hotel | $0.0 | 0.0% | 0.0% |
| Jacksonville – Industrial | $0.0 | 0.0% | 0.0% |
| Jacksonville – Multifamily | $3.1 | 0.1% | 0.0% |
| Jacksonville – Office | $0.0 | 0.0% | 0.0% |
| Jacksonville – Other | $0.0 | 0.0% | 0.0% |
| Jacksonville – Retail | $1.9 | 0.5% | 0.0% |
| Jacksonville – Self Storage | $0.0 | 0.0% | 0.0% |
| Kansas City – Kansas City, MO-KS MSA | $51.9 | 0.9% | -1.2% |
| Kansas City – Hotel | $29.7 | 13.2% | -14.3% |
| Kansas City – Industrial | $0.0 | 0.0% | 0.0% |
| Kansas City – Multifamily | $0.0 | 0.0% | -0.1% |
| Kansas City – Office | $0.0 | 0.0% | 0.0% |
| Kansas City – Other | $21.1 | 10.5% | 0.1% |
| Kansas City – Retail | $1.1 | 0.2% | -3.6% |
| Kansas City – Self Storage | $0.0 | 0.0% | 0.0% |
| Las Vegas – Las Vegas-Paradise, NV MSA | $229.3 | 1.1% | -0.2% |
| Las Vegas – Hotel | $0.0 | 0.0% | 0.0% |
| Las Vegas – Industrial | $0.0 | 0.0% | 0.0% |
| Las Vegas – Multifamily | $0.0 | 0.0% | -0.7% |
| Las Vegas – Office | $0.0 | 0.0% | 0.0% |
| Las Vegas – Other | $0.0 | 0.0% | 0.0% |
| Las Vegas – Retail | $229.3 | 5.7% | 0.6% |
| Las Vegas – Self Storage | $0.0 | 0.0% | 0.0% |
| Los Angeles – Los Angeles-Long Beach-Santa Ana, CA MSA | $868.1 | 1.7% | 0.6% |
| Los Angeles – Hotel | $99.9 | 1.5% | -0.3% |
| Los Angeles – Industrial | $0.0 | 0.0% | 0.0% |
| Los Angeles – Multifamily | $50.8 | 0.2% | 0.2% |
| Los Angeles – Office | $111.4 | 1.1% | 0.5% |
| Los Angeles – Other | $85.2 | 2.9% | 0.2% |
| Los Angeles – Retail | $520.7 | 8.9% | 3.9% |
| Los Angeles – Self Storage | $0.0 | 0.0% | 0.0% |
| Louisville – Louisville/Jefferson County, KY-IN MSA | $71.7 | 2.6% | 0.0% |
| Louisville – Hotel | $0.0 | 0.0% | 0.0% |
| Louisville – Industrial | $0.0 | 0.0% | 0.0% |
| Louisville – Multifamily | $0.0 | 0.0% | 0.0% |
| Louisville – Office | $0.0 | 0.0% | 0.0% |
| Louisville – Other | $0.0 | 0.0% | 0.0% |
| Louisville – Retail | $71.7 | 14.8% | -0.8% |
| Louisville – Self Storage | $0.0 | 0.0% | 0.0% |
| Memphis – Memphis, TN-AR-MS MSA | $86.2 | 3.6% | 0.1% |
| Memphis – Hotel | $13.0 | 5.8% | -0.2% |
| Memphis – Industrial | $0.0 | 0.0% | 0.0% |
| Memphis – Multifamily | $6.9 | 0.6% | 0.0% |
| Memphis – Office | $0.0 | 0.0% | 0.0% |
| Memphis – Other | $5.4 | 17.0% | -0.2% |
| Memphis – Retail | $60.9 | 17.2% | 0.8% |
| Memphis – Self Storage | $0.0 | 0.0% | 0.0% |
| Miami – Miami-Fort Lauderdale-Pompano Beach, FL MSA | $342.4 | 1.4% | 0.3% |
| Miami – Hotel | $11.0 | 0.2% | 0.0% |
| Miami – Industrial | $0.0 | 0.0% | 0.0% |
| Miami – Multifamily | $0.0 | 0.0% | 0.0% |
| Miami – Office | $4.0 | 0.2% | 0.0% |
| Miami – Other | $0.0 | 0.0% | -0.6% |
| Miami – Retail | $327.4 | 6.1% | 1.6% |
| Miami – Self Storage | $0.0 | 0.0% | 0.0% |
| Milwaukee – Milwaukee-Waukesha-West Allis, WI MSA | $208.6 | 8.8% | 0.5% |
| Milwaukee – Hotel | $16.7 | 10.7% | 6.7% |
| Milwaukee – Industrial | $0.0 | 0.0% | 0.0% |
| Milwaukee – Multifamily | $0.0 | 0.0% | 0.0% |
| Milwaukee – Office | $82.9 | 16.7% | -0.2% |
| Milwaukee – Other | $0.6 | 0.6% | 0.0% |
| Milwaukee – Retail | $108.4 | 27.1% | 1.8% |
| Milwaukee – Self Storage | $0.0 | 0.0% | 0.0% |
| Minneapolis – Minneapolis-St. Paul-Bloomington, MN-WI MSA | $1,739.3 | 20.9% | 0.3% |
| Minneapolis – Hotel | $243.0 | 43.4% | 3.4% |
| Minneapolis – Industrial | $0.0 | 0.0% | 0.0% |
| Minneapolis – Multifamily | $0.0 | 0.0% | 0.0% |
| Minneapolis – Office | $92.1 | 4.4% | 0.0% |
| Minneapolis – Other | $4.1 | 1.1% | 0.1% |
| Minneapolis – Retail | $1,400.0 | 77.8% | 0.4% |
| Minneapolis – Self Storage | $0.0 | 0.0% | 0.0% |
| Nashville – Nashville-Davidson-Murfreesboro-Franklin, TN MSA | $52.6 | 0.9% | -0.3% |
| Nashville – Hotel | $43.2 | 3.0% | -1.5% |
| Nashville – Industrial | $0.0 | 0.0% | 0.0% |
| Nashville – Multifamily | $0.0 | 0.0% | 0.0% |
| Nashville – Office | $0.0 | 0.0% | 0.0% |
| Nashville – Other | $0.0 | 0.0% | 0.0% |
| Nashville – Retail | $9.4 | 1.4% | 0.1% |
| Nashville – Self Storage | $0.0 | 0.0% | 0.0% |
| New Orleans – New Orleans-Metairie-Kenner, LA MSA | $124.1 | 3.7% | 0.0% |
| New Orleans – Hotel | $60.0 | 5.9% | 0.5% |
| New Orleans – Industrial | $0.0 | 0.0% | 0.0% |
| New Orleans – Multifamily | $0.0 | 0.0% | 0.0% |
| New Orleans – Office | $27.2 | 5.0% | 0.0% |
| New Orleans – Other | $14.8 | 9.5% | -0.5% |
| New Orleans – Retail | $22.1 | 3.5% | -0.2% |
| New Orleans – Self Storage | $0.0 | 0.0% | 0.0% |
| New York City – New York-Northern New Jersey-Long Island, NY-NJ-PA MSA | $5,985.3 | 4.7% | 0.6% |
| New York City – Hotel | $1,074.7 | 27.0% | 3.0% |
| New York City – Industrial | $64.6 | 1.6% | 0.0% |
| New York City – Multifamily | $182.0 | 0.5% | 0.0% |
| New York City – Office | $1,404.8 | 3.1% | 0.0% |
| New York City – Other | $1,637.6 | 7.5% | 1.4% |
| New York City – Retail | $1,621.7 | 13.3% | 3.4% |
| New York City – Self Storage | $0.0 | 0.0% | 0.0% |
| Orlando – Orlando-Kissimmee, FL MSA | $159.2 | 1.6% | -0.2% |
| Orlando – Hotel | $52.3 | 1.9% | -1.3% |
| Orlando – Industrial | $0.0 | 0.0% | 0.0% |
| Orlando – Multifamily | $0.0 | 0.0% | 0.0% |
| Orlando – Office | $57.8 | 12.7% | 2.1% |
| Orlando – Other | $0.0 | 0.0% | 0.0% |
| Orlando – Retail | $49.1 | 5.2% | 0.1% |
| Orlando – Self Storage | $0.0 | 0.0% | 0.0% |
| Philadelphia – Philadelphia-Camden-Wilmington, PA-NJ-DE-MD MSA | $730.3 | 3.7% | 0.4% |
| Philadelphia – Hotel | $102.1 | 11.1% | -0.9% |
| Philadelphia – Industrial | $0.0 | 0.0% | 0.0% |
| Philadelphia – Multifamily | $49.2 | 0.6% | 0.1% |
| Philadelphia – Office | $179.9 | 5.0% | 1.8% |
| Philadelphia – Other | $378.4 | 30.2% | 0.0% |
| Philadelphia – Retail | $20.8 | 1.0% | 0.1% |
| Philadelphia – Self Storage | $0.0 | 0.0% | 0.0% |
| Phoenix – Phoenix-Mesa-Scottsdale, AZ MSA | $195.0 | 1.0% | -0.4% |
| Phoenix – Hotel | $23.9 | 1.6% | 0.0% |
| Phoenix – Industrial | $0.0 | 0.0% | 0.0% |
| Phoenix – Multifamily | $0.0 | 0.0% | -0.5% |
| Phoenix – Office | $40.9 | 1.8% | 0.0% |
| Phoenix – Other | $8.6 | 1.0% | -0.3% |
| Phoenix – Retail | $121.6 | 7.4% | -0.9% |
| Phoenix – Self Storage | $0.0 | 0.0% | 0.0% |
| Pittsburgh – Pittsburgh, PA MSA | $54.2 | 1.2% | -0.3% |
| Pittsburgh – Hotel | $15.8 | 8.7% | 0.0% |
| Pittsburgh – Industrial | $0.0 | 0.0% | 0.0% |
| Pittsburgh – Multifamily | $0.0 | 0.0% | 0.0% |
| Pittsburgh – Office | $30.5 | 2.9% | -0.4% |
| Pittsburgh – Other | $7.9 | 2.3% | -2.3% |
| Pittsburgh – Retail | $0.0 | 0.0% | 0.0% |
| Pittsburgh – Self Storage | $0.0 | 0.0% | 0.0% |
| Portland – Portland-Vancouver-Beaverton, OR-WA MSA | $468.9 | 6.8% | -1.6% |
| Portland – Hotel | $240.0 | 30.5% | -8.9% |
| Portland – Industrial | $0.0 | 0.0% | 0.0% |
| Portland – Multifamily | $0.0 | 0.0% | 0.0% |
| Portland – Office | $12.9 | 3.3% | 0.3% |
| Portland – Other | $0.0 | 0.0% | 0.0% |
| Portland – Retail | $216.0 | 43.9% | 0.8% |
| Portland – Self Storage | $0.0 | 0.0% | 0.0% |
| Raleigh – Raleigh-Cary, NC MSA | $21.9 | 0.6% | 0.0% |
| Raleigh – Hotel | $15.3 | 7.3% | -0.1% |
| Raleigh – Industrial | $0.0 | 0.0% | 0.0% |
| Raleigh – Multifamily | $0.0 | 0.0% | 0.0% |
| Raleigh – Office | $0.0 | 0.0% | 0.0% |
| Raleigh – Other | $6.7 | 4.4% | -0.2% |
| Raleigh – Retail | $0.0 | 0.0% | 0.0% |
| Raleigh – Self Storage | $0.0 | 0.0% | 0.0% |
| Richmond – Richmond, VA MSA | $159.6 | 5.0% | 2.9% |
| Richmond – Hotel | $0.0 | 0.0% | 0.0% |
| Richmond – Industrial | $0.0 | 0.0% | 0.0% |
| Richmond – Multifamily | $0.0 | 0.0% | 0.0% |
| Richmond – Office | $0.0 | 0.0% | 0.0% |
| Richmond – Other | $12.9 | 8.9% | 0.0% |
| Richmond – Retail | $146.7 | 37.4% | 25.5% |
| Richmond – Self Storage | $0.0 | 0.0% | 0.0% |
| Riverside – Riverside-San Bernardino-Ontario, CA MSA | $277.3 | 2.8% | 0.0% |
| Riverside – Hotel | $39.2 | 8.5% | -2.0% |
| Riverside – Industrial | $0.0 | 0.0% | 0.0% |
| Riverside – Multifamily | $0.0 | 0.0% | 0.0% |
| Riverside – Office | $0.0 | 0.0% | 0.0% |
| Riverside – Other | $9.7 | 2.6% | 2.6% |
| Riverside – Retail | $228.4 | 12.5% | 1.2% |
| Riverside – Self Storage | $0.0 | 0.0% | 0.0% |
| Sacramento – Sacramento-Arden-Arcade-Roseville, CA MSA | $29.1 | 0.5% | 0.2% |
| Sacramento – Hotel | $9.8 | 2.8% | 1.4% |
| Sacramento – Industrial | $0.0 | 0.0% | 0.0% |
| Sacramento – Multifamily | $0.0 | 0.0% | 0.0% |
| Sacramento – Office | $0.0 | 0.0% | 0.0% |
| Sacramento – Other | $11.0 | 2.9% | 0.0% |
| Sacramento – Retail | $8.3 | 1.5% | 1.5% |
| Sacramento – Self Storage | $0.0 | 0.0% | 0.0% |
| Salt Lake City – Salt Lake City, UT MSA | $42.7 | 1.0% | 0.5% |
| Salt Lake City – Hotel | $6.1 | 2.2% | -5.2% |
| Salt Lake City – Industrial | $0.0 | 0.0% | 0.0% |
| Salt Lake City – Multifamily | $0.0 | 0.0% | 0.0% |
| Salt Lake City – Office | $0.0 | 0.0% | 0.0% |
| Salt Lake City – Other | $0.0 | 0.0% | 0.0% |
| Salt Lake City – Retail | $36.5 | 6.0% | 6.0% |
| Salt Lake City – Self Storage | $0.0 | 0.0% | 0.0% |
| San Antonio – San Antonio, TX MSA | $133.4 | 2.0% | -0.3% |
| San Antonio – Hotel | $17.1 | 3.2% | -3.4% |
| San Antonio – Industrial | $0.0 | 0.0% | 0.0% |
| San Antonio – Multifamily | $0.0 | 0.0% | -0.2% |
| San Antonio – Office | $0.0 | 0.0% | 0.0% |
| San Antonio – Other | $0.0 | 0.0% | 0.0% |
| San Antonio – Retail | $116.3 | 14.2% | -6.0% |
| San Antonio – Self Storage | $0.0 | 0.0% | 0.0% |
| San Diego – San Diego-Carlsbad-San Marcos, CA MSA | $55.7 | 0.5% | 0.0% |
| San Diego – Hotel | $39.4 | 2.1% | 0.1% |
| San Diego – Industrial | $0.0 | 0.0% | 0.0% |
| San Diego – Multifamily | $4.2 | 0.1% | 0.0% |
| San Diego – Office | $0.0 | 0.0% | 0.0% |
| San Diego – Other | $9.2 | 1.3% | 0.0% |
| San Diego – Retail | $2.9 | 0.3% | 0.0% |
| San Diego – Self Storage | $0.0 | 0.0% | 0.0% |
| San Francisco – San Francisco-Oakland-Fremont, CA MSA | $245.3 | 1.0% | 0.2% |
| San Francisco – Hotel | $109.0 | 4.2% | -0.3% |
| San Francisco – Industrial | $0.0 | 0.0% | 0.0% |
| San Francisco – Multifamily | $18.1 | 0.2% | 0.2% |
| San Francisco – Office | $32.2 | 0.3% | 0.3% |
| San Francisco – Other | $38.6 | 1.4% | 0.0% |
| San Francisco – Retail | $47.5 | 4.3% | -0.2% |
| San Francisco – Self Storage | $0.0 | 0.0% | 0.0% |
| San Jose – San Jose-Sunnyvale-Santa Clara, CA MSA | $23.8 | 0.1% | 0.0% |
| San Jose – Hotel | $0.0 | 0.0% | -0.5% |
| San Jose – Industrial | $0.0 | 0.0% | 0.0% |
| San Jose – Multifamily | $0.0 | 0.0% | 0.0% |
| San Jose – Office | $23.8 | 0.3% | 0.3% |
| San Jose – Other | $0.0 | 0.0% | 0.0% |
| San Jose – Retail | $0.0 | 0.0% | 0.0% |
| San Jose – Self Storage | $0.0 | 0.0% | 0.0% |
| Seattle – Seattle-Tacoma-Bellevue, WA MSA | $73.4 | 0.3% | 0.0% |
| Seattle – Hotel | $73.4 | 5.2% | -0.1% |
| Seattle – Industrial | $0.0 | 0.0% | 0.0% |
| Seattle – Multifamily | $0.0 | 0.0% | 0.0% |
| Seattle – Office | $0.0 | 0.0% | 0.0% |
| Seattle – Other | $0.0 | 0.0% | 0.0% |
| Seattle – Retail | $0.0 | 0.0% | 0.0% |
| Seattle – Self Storage | $0.0 | 0.0% | 0.0% |
| St. Louis – St. Louis, MO-IL MSA | $216.5 | 5.4% | 0.4% |
| St. Louis – Hotel | $1.7 | 0.7% | 0.1% |
| St. Louis – Industrial | $0.0 | 0.0% | 0.0% |
| St. Louis – Multifamily | $3.2 | 0.2% | 0.2% |
| St. Louis – Office | $0.0 | 0.0% | 0.0% |
| St. Louis – Other | $19.6 | 4.0% | 0.0% |
| St. Louis – Retail | $192.0 | 21.7% | 2.3% |
| St. Louis – Self Storage | $0.0 | 0.0% | 0.0% |
| Tampa – Tampa-St. Petersburg-Clearwater, FL | $129.3 | 1.4% | -0.1% |
| Tampa – Hotel | $54.9 | 7.7% | -0.9% |
| Tampa – Industrial | $0.0 | 0.0% | 0.0% |
| Tampa – Multifamily | $0.0 | 0.0% | 0.0% |
| Tampa – Office | $23.4 | 3.7% | 0.2% |
| Tampa – Other | $0.0 | 0.0% | 0.0% |
| Tampa – Retail | $51.0 | 7.1% | 0.2% |
| Tampa – Self Storage | $0.0 | 0.0% | 0.0% |
| Tucson – Tucson, AZ MSA | $158.9 | 4.9% | 0.1% |
| Tucson – Hotel | $0.0 | 0.0% | 0.0% |
| Tucson – Industrial | $0.0 | 0.0% | 0.0% |
| Tucson – Multifamily | $0.0 | 0.0% | 0.0% |
| Tucson – Office | $0.0 | 0.0% | 0.0% |
| Tucson – Other | $0.0 | 0.0% | 0.0% |
| Tucson – Retail | $158.9 | 22.7% | 2.8% |
| Tucson – Self Storage | $0.0 | 0.0% | 0.0% |
| Virginia Beach – Virginia Beach-Norfolk-Newport News, VA-NC MSA | $155.4 | 3.3% | -0.7% |
| Virginia Beach – Hotel | $0.0 | 0.0% | 0.0% |
| Virginia Beach – Industrial | $0.0 | 0.0% | -8.0% |
| Virginia Beach – Multifamily | $0.0 | 0.0% | 0.0% |
| Virginia Beach – Office | $0.0 | 0.0% | 0.0% |
| Virginia Beach – Other | $0.0 | 0.0% | 0.0% |
| Virginia Beach – Retail | $155.4 | 20.4% | -2.5% |
| Virginia Beach – Self Storage | $0.0 | 0.0% | 0.0% |
| Washington, DC – Washington-Arlington-Alexandria, DC-VA-MD-WV MSA | $534.9 | 1.7% | -0.1% |
| Washington, DC – Hotel | $49.9 | 4.5% | 0.1% |
| Washington, DC – Industrial | $0.0 | 0.0% | 0.0% |
| Washington, DC – Multifamily | $0.0 | 0.0% | 0.0% |
| Washington, DC – Office | $377.5 | 5.0% | 0.1% |
| Washington, DC – Other | $32.9 | 2.3% | 0.2% |
| Washington, DC – Retail | $74.7 | 2.3% | 0.1% |
| Washington, DC – Self Storage | $0.0 | 0.0% | 0.0% |
| Grand Total | $20,606.7 | 3.0% | 0.1% |
About CRED iQ
CRED iQ is a commercial real estate data, analytics, and valuation platform providing actionable intelligence to CRE and capital markets investors. Subscribers to CRED iQ use the platform to identify valuable leads for leasing, lending, refinancing, distressed debt, and acquisition opportunities. Our data platform is powered by over $2.0 trillion of CMBS, CRE CLO, SBLL, Ginnie Mae, FHA/HUD, and Freddie Mac loan and property data.
