
CRED iQ monitors distressed rates and market performance for nearly 400 MSAs across the United States, covering over $900 billion in outstanding commercial real estate (CRE) debt. Distressed rates (DQ + SS%) include loans that are specially serviced, delinquent, or a combination of both. Distressed rates and month-over-month changes for data reported as of June 2023 are presented below for the 50 largest MSAs, broken out by property type for a granular view of distress by market-sector.
Of the 50 largest MSAs tracked by CRED iQ, there were 35 markets that exhibited month-over-month increases in the percentages of distressed CRE loans, equal to 70% of the Top 50 markets. Of the markets with comparatively higher levels of CRE distress to the prior month, the average increase was approximately 61 basis points. Notable markets with the largest increases in distress included Minneapolis (+10.6%), Washington, DC (+2.5%), and Charlotte (+2.0%). The sharp increase in CRE distress for the Minneapolis market further separates the MSA as an outlier for distressed commercial real estate properties. The Minneapolis MSA has the highest percentage of distressed CRE loans among the Top 50 markets, equal to 33.6%. CRE distress in Minneapolis is nearly 3x higher than Chicago (11.5%), which has the second-highest level of distress among the Top 50 markets.
Of the 15 markets that exhibited month-over-month improvements in distressed rates, St. Louis (-2.7%) and Pittsburgh (-1.3%) had the sharpest declines. The distressed rate for the St. Louis MSA improved substantially after a $155 million mortgage secured by West County Center was modified with a two-year maturity extension. West County Center is a 743,945-SF regional mall located in Des Peres, MO and its mortgage failed to pay off at maturity in December 2022. The loan was paid current as part of the modification. The St. Louis MSA, and more specifically the St. Louis – Retail market-sector, had the largest declines in distress among the markets and sectors monitored by CRED iQ.
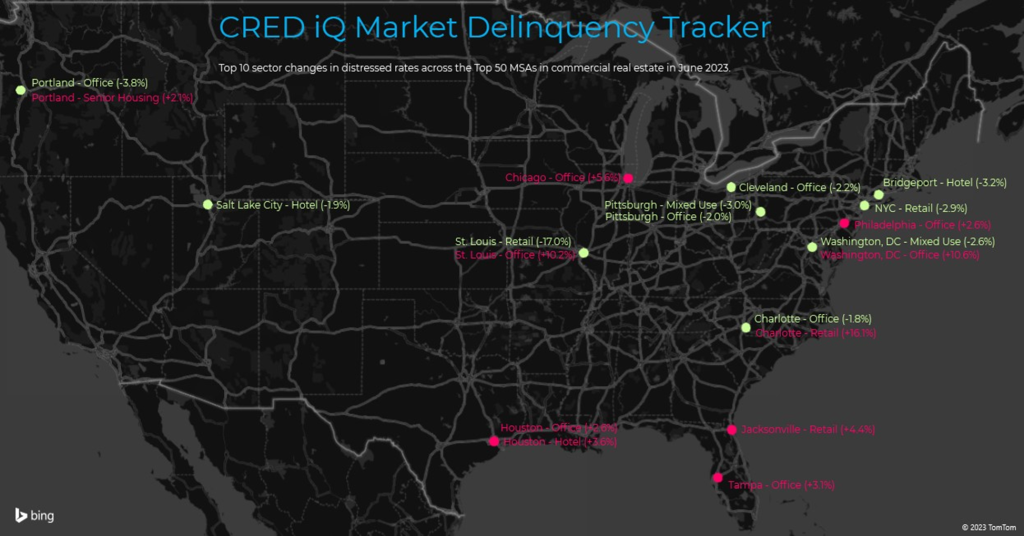
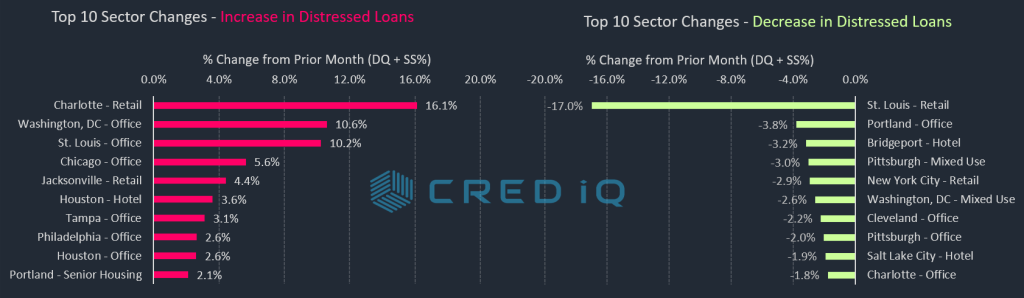
For a more granular analysis of the Top 50 markets, CRED iQ further delineated individual markets’ distressed rates by property type for a comprehensive view by market-sector. The office and mixed-use sectors exhibited continued volatility, accounting for six of the 10 largest increases in distress by market-sector. Washington, DC-Office (+10.6%), St. Louis-Office (+10.3%), and Chicago-Office (+5.6%) were among the market-sectors with the sharpest month-over-month increases in CRE distress. The Chicago-Office market-sector alone had more than $450 million in newly distressed CMBS loans as of June 2023, including the special servicing transfer of a $310 million mortgage secured by River North Point, a 1.3 million-SF office property located in Chicago’s Central Business District. Suburban Chicago office properties also transferred to special servicing due to credit issues — a $56 million loan secured by the 869,120-SF Riverway office complex and a $26 million mortgage secured by 9525 West Bryn Mawr Avenue, a 246,841-SF office building, both transferred to special servicing in May 2023. These suburban office properties are located in Rosemont, IL, approximately 20 miles northwest of Chicago. The Chicago MSA is the fourth-largest office market, based on aggregate outstanding securitized debt, monitored by CRED iQ.
The market-sector with highest month-over-month increase in distress was Charlotte-Retail, which saw its distressed rate surge to 24.5% of outstanding debt that is delinquent or specially serviced. A $151 million mortgage secured by 647,511 SF of the Carolina Place Mall in Pineville, NC defaulted at its maturity in June 2023 and transferred to special servicing.
In summary, the Minneapolis MSA has the highest overall distressed rate — equal to 33.6% — and has maintained this position for over a year. Chicago (11.5%), Milwaukee (9.9%), Cleveland (9.8%), and Birmingham, AL (8.8%) comprise the remaining markets with the highest rates of distress. The Salt Lake City MSA (0.0%) has the lowest level of distress among the Top 50 MSAs for the second consecutive month.
View commercial real estate distressed rates broken out by market and property type below:
| MSA – Property Type | DQ/SS (millions) | DQ/SS (%) | Monthly Change |
| Allentown-Bethlehem-Easton, PA-NJ MSA | $76.5 | 2.4% | -0.1% |
| Allentown – Hotel | $0.0 | 0.0% | 0.0% |
| Allentown – Industrial | $0.0 | 0.0% | 0.0% |
| Allentown – Multifamily | $0.0 | 0.0% | 0.0% |
| Allentown – Office | $57.6 | 18.5% | 0.0% |
| Allentown – Other | $0.0 | 0.0% | 0.0% |
| Allentown – Retail | $18.8 | 5.1% | 0.0% |
| Allentown – Self Storage | $0.0 | 0.0% | 0.0% |
| Atlanta-Sandy Springs-Marietta, GA MSA | $528.0 | 1.9% | -0.1% |
| Atlanta – Hotel | $80.8 | 3.2% | 0.0% |
| Atlanta – Industrial | $0.0 | 0.0% | 0.0% |
| Atlanta – Multifamily | $2.5 | 0.0% | 0.0% |
| Atlanta – Office | $414.4 | 19.8% | 0.7% |
| Atlanta – Other | $0.0 | 0.0% | 0.0% |
| Atlanta – Retail | $30.3 | 1.9% | -0.8% |
| Atlanta – Self Storage | $0.0 | 0.0% | 0.0% |
| Austin-Round Rock, TX MSA | $107.2 | 1.1% | 0.2% |
| Austin – Hotel | $69.3 | 7.7% | 1.4% |
| Austin – Industrial | $0.0 | 0.0% | 0.0% |
| Austin – Multifamily | $0.0 | 0.0% | 0.0% |
| Austin – Office | $0.0 | 0.0% | 0.0% |
| Austin – Other | $4.1 | 1.3% | 0.0% |
| Austin – Retail | $33.8 | 4.5% | 0.0% |
| Austin – Self Storage | $0.0 | 0.0% | 0.0% |
| Baltimore-Towson, MD MSA | $393.8 | 4.1% | 0.0% |
| Baltimore – Hotel | $65.2 | 14.4% | 0.3% |
| Baltimore – Industrial | $0.0 | 0.0% | 0.0% |
| Baltimore – Multifamily | $5.1 | 0.1% | 0.0% |
| Baltimore – Office | $65.5 | 7.4% | -0.2% |
| Baltimore – Other | $11.4 | 5.5% | 0.0% |
| Baltimore – Retail | $246.5 | 23.4% | 0.1% |
| Baltimore – Self Storage | $0.0 | 0.0% | 0.0% |
| Birmingham-Hoover, AL MSA | $267.9 | 8.8% | 0.1% |
| Birmingham – Hotel | $10.3 | 7.6% | 0.0% |
| Birmingham – Industrial | $0.0 | 0.0% | 0.0% |
| Birmingham – Multifamily | $0.0 | 0.0% | 0.0% |
| Birmingham – Office | $93.4 | 20.1% | 0.3% |
| Birmingham – Other | $0.0 | 0.0% | 0.0% |
| Birmingham – Retail | $164.2 | 23.6% | 0.7% |
| Birmingham – Self Storage | $0.0 | 0.0% | 0.0% |
| Boston-Cambridge-Quincy, MA-NH MSA | $156.7 | 0.8% | 0.0% |
| Boston – Hotel | $19.3 | 1.2% | -0.1% |
| Boston – Industrial | $0.0 | 0.0% | 0.0% |
| Boston – Multifamily | $0.0 | 0.0% | 0.0% |
| Boston – Office | $49.3 | 0.7% | 0.0% |
| Boston – Other | $0.0 | 0.0% | 0.0% |
| Boston – Retail | $88.1 | 8.0% | 2.4% |
| Boston – Self Storage | $0.0 | 0.0% | 0.0% |
| Bridgeport-Stamford-Norwalk, CT MSA | $196.9 | 4.7% | 0.0% |
| Bridgeport – Hotel | $37.2 | 20.3% | -3.2% |
| Bridgeport – Industrial | $17.8 | 14.2% | 0.0% |
| Bridgeport – Multifamily | $0.0 | 0.0% | 0.0% |
| Bridgeport – Office | $132.1 | 11.1% | 0.0% |
| Bridgeport – Other | $9.8 | 3.3% | -0.1% |
| Bridgeport – Retail | $0.0 | 0.0% | 0.0% |
| Bridgeport – Self Storage | $0.0 | 0.0% | 0.0% |
| Charlotte-Gastonia-Concord, NC-SC MSA | $657.7 | 8.6% | 2.0% |
| Charlotte – Hotel | $47.0 | 5.4% | 0.1% |
| Charlotte – Industrial | $0.0 | 0.0% | 0.0% |
| Charlotte – Multifamily | $0.0 | 0.0% | 0.0% |
| Charlotte – Office | $276.3 | 29.3% | -1.8% |
| Charlotte – Other | $100.3 | 29.5% | 0.5% |
| Charlotte – Retail | $234.2 | 24.5% | 16.1% |
| Charlotte – Self Storage | $0.0 | 0.0% | 0.0% |
| Chicago-Naperville-Joliet, IL-IN-WI MSA | $3,340.7 | 11.5% | 1.5% |
| Chicago – Hotel | $738.5 | 39.3% | -0.9% |
| Chicago – Industrial | $8.6 | 0.2% | 0.0% |
| Chicago – Multifamily | $85.6 | 0.9% | 0.0% |
| Chicago – Office | $2,021.5 | 24.4% | 5.6% |
| Chicago – Other | $215.6 | 8.6% | 0.2% |
| Chicago – Retail | $270.9 | 8.8% | -0.9% |
| Chicago – Self Storage | $0.0 | 0.0% | 0.0% |
| Cincinnati-Middletown, OH-KY-IN MSA | $189.7 | 4.9% | 0.1% |
| Cincinnati – Hotel | $86.2 | 30.1% | -0.8% |
| Cincinnati – Industrial | $0.0 | 0.0% | 0.0% |
| Cincinnati – Multifamily | $0.0 | 0.0% | 0.0% |
| Cincinnati – Office | $58.5 | 12.9% | 1.0% |
| Cincinnati – Other | $6.7 | 3.5% | 0.8% |
| Cincinnati – Retail | $38.3 | 7.3% | -0.8% |
| Cincinnati – Self Storage | $0.0 | 0.0% | 0.0% |
| Cleveland-Elyria-Mentor, OH MSA | $417.3 | 9.8% | -0.5% |
| Cleveland – Hotel | $84.2 | 48.7% | -0.1% |
| Cleveland – Industrial | $0.0 | 0.0% | 0.0% |
| Cleveland – Multifamily | $0.0 | 0.0% | 0.0% |
| Cleveland – Office | $145.2 | 15.9% | -2.2% |
| Cleveland – Other | $180.4 | 45.4% | 0.0% |
| Cleveland – Retail | $7.6 | 1.1% | 0.0% |
| Cleveland – Self Storage | $0.0 | 0.0% | 0.0% |
| Columbus, OH MSA | $194.8 | 3.2% | 0.0% |
| Columbus, OH – Hotel | $18.1 | 7.4% | 0.4% |
| Columbus, OH – Industrial | $0.0 | 0.0% | 0.0% |
| Columbus, OH – Multifamily | $5.7 | 0.1% | 0.0% |
| Columbus, OH – Office | $57.1 | 8.8% | 0.4% |
| Columbus, OH – Other | $0.0 | 0.0% | 0.0% |
| Columbus, OH – Retail | $114.0 | 13.7% | 0.0% |
| Columbus, OH – Self Storage | $0.0 | 0.0% | 0.0% |
| Dallas-Fort Worth-Arlington, TX MSA | $326.1 | 0.9% | 0.0% |
| Dallas – Hotel | $118.8 | 3.4% | 0.0% |
| Dallas – Industrial | $0.0 | 0.0% | 0.0% |
| Dallas – Multifamily | $10.5 | 0.0% | 0.0% |
| Dallas – Office | $143.4 | 4.7% | 0.0% |
| Dallas – Other | $10.2 | 0.5% | 0.0% |
| Dallas – Retail | $43.2 | 2.2% | 0.1% |
| Dallas – Self Storage | $0.0 | 0.0% | 0.0% |
| Denver-Aurora, CO MSA | $848.2 | 5.4% | 0.0% |
| Denver – Hotel | $17.2 | 2.0% | -0.1% |
| Denver – Industrial | $0.0 | 0.0% | 0.0% |
| Denver – Multifamily | $0.0 | 0.0% | 0.0% |
| Denver – Office | $691.0 | 33.1% | 0.4% |
| Denver – Other | $93.8 | 10.6% | 0.7% |
| Denver – Retail | $46.2 | 3.6% | 0.2% |
| Denver – Self Storage | $0.0 | 0.0% | 0.0% |
| Detroit-Warren-Livonia, MI MSA | $252.8 | 2.4% | 0.0% |
| Detroit – Hotel | $83.7 | 12.9% | 0.1% |
| Detroit – Industrial | $18.8 | 2.9% | 0.0% |
| Detroit – Multifamily | $1.2 | 0.0% | 0.0% |
| Detroit – Office | $3.7 | 0.2% | 0.0% |
| Detroit – Other | $0.0 | 0.0% | 0.0% |
| Detroit – Retail | $145.4 | 9.8% | -0.2% |
| Detroit – Self Storage | $0.0 | 0.0% | 0.0% |
| Hartford-West Hartford-East Hartford, CT MSA | $197.6 | 8.1% | 0.2% |
| Hartford – Hotel | $0.0 | 0.0% | 0.0% |
| Hartford – Industrial | $0.0 | 0.0% | 0.0% |
| Hartford – Multifamily | $1.0 | 0.1% | 0.1% |
| Hartford – Office | $71.5 | 26.5% | 0.0% |
| Hartford – Other | $0.0 | 0.0% | 0.0% |
| Hartford – Retail | $125.1 | 41.5% | 2.8% |
| Hartford – Self Storage | $0.0 | 0.0% | 0.0% |
| Houston-Sugar Land-Baytown, TX MSA | $1,270.2 | 4.9% | 0.7% |
| Houston – Hotel | $426.4 | 47.1% | 3.6% |
| Houston – Industrial | $32.7 | 3.5% | 0.0% |
| Houston – Multifamily | $104.3 | 0.7% | 0.5% |
| Houston – Office | $576.1 | 17.0% | 2.6% |
| Houston – Other | $87.3 | 14.9% | 0.0% |
| Houston – Retail | $43.4 | 1.1% | 0.0% |
| Houston – Self Storage | $0.0 | 0.0% | 0.0% |
| Indianapolis-Carmel, IN MSA | $126.1 | 2.3% | 0.0% |
| Indianapolis – Hotel | $42.1 | 7.9% | 0.2% |
| Indianapolis – Industrial | $0.0 | 0.0% | 0.0% |
| Indianapolis – Multifamily | $9.7 | 0.3% | 0.0% |
| Indianapolis – Office | $59.6 | 10.4% | 0.8% |
| Indianapolis – Other | $0.0 | 0.0% | 0.0% |
| Indianapolis – Retail | $14.8 | 4.3% | 0.0% |
| Indianapolis – Self Storage | $0.0 | 0.0% | 0.0% |
| Jacksonville, FL MSA | $174.3 | 3.3% | 0.0% |
| Jacksonville – Hotel | $24.4 | 6.2% | 0.2% |
| Jacksonville – Industrial | $0.0 | 0.0% | 0.0% |
| Jacksonville – Multifamily | $0.0 | 0.0% | 0.0% |
| Jacksonville – Office | $38.1 | 6.7% | -0.2% |
| Jacksonville – Other | $0.0 | 0.0% | 0.0% |
| Jacksonville – Retail | $111.9 | 33.7% | 4.4% |
| Jacksonville – Self Storage | $0.0 | 0.0% | 0.0% |
| Kansas City, MO-KS MSA | $332.2 | 5.8% | 0.1% |
| Kansas City – Hotel | $28.1 | 12.2% | 0.0% |
| Kansas City – Industrial | $0.0 | 0.0% | 0.0% |
| Kansas City – Multifamily | $2.5 | 0.1% | 0.0% |
| Kansas City – Office | $232.5 | 21.9% | 1.0% |
| Kansas City – Other | $20.8 | 10.3% | -0.2% |
| Kansas City – Retail | $48.4 | 8.7% | 2.9% |
| Kansas City – Self Storage | $0.0 | 0.0% | 0.0% |
| Las Vegas-Paradise, NV MSA | $407.1 | 1.8% | -0.8% |
| Las Vegas – Hotel | $30.3 | 0.3% | 0.0% |
| Las Vegas – Industrial | $0.0 | 0.0% | 0.0% |
| Las Vegas – Multifamily | $0.0 | 0.0% | 0.0% |
| Las Vegas – Office | $0.0 | 0.0% | 0.0% |
| Las Vegas – Other | $130.0 | 23.6% | -17.6% |
| Las Vegas – Retail | $246.7 | 7.1% | 0.3% |
| Las Vegas – Self Storage | $0.0 | 0.0% | 0.0% |
| Los Angeles-Long Beach-Santa Ana, CA MSA | $2,264.8 | 4.4% | 0.1% |
| Los Angeles – Hotel | $164.9 | 3.3% | 0.3% |
| Los Angeles – Industrial | $0.0 | 0.0% | 0.0% |
| Los Angeles – Multifamily | $31.7 | 0.2% | 0.1% |
| Los Angeles – Office | $1,118.5 | 9.1% | 0.0% |
| Los Angeles – Other | $53.3 | 1.6% | -0.5% |
| Los Angeles – Retail | $896.4 | 14.5% | -0.2% |
| Los Angeles – Self Storage | $0.0 | 0.0% | 0.0% |
| Louisville/Jefferson County, KY-IN MSA | $22.0 | 0.7% | 0.0% |
| Louisville – Hotel | $0.0 | 0.0% | 0.0% |
| Louisville – Industrial | $0.0 | 0.0% | 0.0% |
| Louisville – Multifamily | $6.9 | 0.5% | 0.0% |
| Louisville – Office | $0.0 | 0.0% | 0.0% |
| Louisville – Other | $0.0 | 0.0% | 0.0% |
| Louisville – Retail | $15.1 | 3.5% | 0.5% |
| Louisville – Self Storage | $0.0 | 0.0% | 0.0% |
| Memphis, TN-AR-MS MSA | $87.7 | 3.7% | 0.0% |
| Memphis – Hotel | $22.5 | 10.7% | 0.2% |
| Memphis – Industrial | $0.0 | 0.0% | 0.0% |
| Memphis – Multifamily | $0.0 | 0.0% | 0.0% |
| Memphis – Office | $0.0 | 0.0% | 0.0% |
| Memphis – Other | $5.3 | 14.7% | 0.0% |
| Memphis – Retail | $59.9 | 16.0% | -0.8% |
| Memphis – Self Storage | $0.0 | 0.0% | 0.0% |
| Miami-Fort Lauderdale-Pompano Beach, FL MSA | $404.2 | 1.6% | 0.2% |
| Miami – Hotel | $59.6 | 1.1% | 0.0% |
| Miami – Industrial | $0.0 | 0.0% | 0.0% |
| Miami – Multifamily | $0.0 | 0.0% | 0.0% |
| Miami – Office | $98.3 | 3.7% | 2.0% |
| Miami – Other | $0.0 | 0.0% | 0.0% |
| Miami – Retail | $246.2 | 4.5% | 0.0% |
| Miami – Self Storage | $0.0 | 0.0% | 0.0% |
| Milwaukee-Waukesha-West Allis, WI MSA | $238.7 | 9.9% | -0.2% |
| Milwaukee – Hotel | $16.5 | 10.3% | 0.0% |
| Milwaukee – Industrial | $0.0 | 0.0% | 0.0% |
| Milwaukee – Multifamily | $0.0 | 0.0% | 0.0% |
| Milwaukee – Office | $117.4 | 21.6% | -1.2% |
| Milwaukee – Other | $0.0 | 0.0% | 0.0% |
| Milwaukee – Retail | $104.9 | 24.0% | -0.3% |
| Milwaukee – Self Storage | $0.0 | 0.0% | 0.0% |
| Minneapolis-St. Paul-Bloomington, MN-WI MSA | $2,833.4 | 33.6% | 10.6% |
| Minneapolis – Hotel | $258.7 | 44.6% | -1.4% |
| Minneapolis – Industrial | $2.6 | 0.5% | 0.5% |
| Minneapolis – Multifamily | $9.8 | 0.3% | 0.0% |
| Minneapolis – Office | $989.1 | 47.4% | 43.6% |
| Minneapolis – Other | $173.2 | 35.1% | 1.6% |
| Minneapolis – Retail | $1,400.0 | 74.5% | 0.0% |
| Minneapolis – Self Storage | $0.0 | 0.0% | 0.0% |
| Nashville-Davidson-Murfreesboro-Franklin, TN MSA | $54.4 | 0.9% | -0.1% |
| Nashville – Hotel | $51.3 | 3.5% | 0.1% |
| Nashville – Industrial | $0.0 | 0.0% | 0.0% |
| Nashville – Multifamily | $0.0 | 0.0% | 0.0% |
| Nashville – Office | $0.0 | 0.0% | 0.0% |
| Nashville – Other | $0.0 | 0.0% | 0.0% |
| Nashville – Retail | $3.1 | 0.4% | -0.5% |
| Nashville – Self Storage | $0.0 | 0.0% | 0.0% |
| New Orleans-Metairie-Kenner, LA MSA | $118.1 | 3.4% | 0.1% |
| New Orleans – Hotel | $56.5 | 4.8% | -0.5% |
| New Orleans – Industrial | $0.0 | 0.0% | 0.0% |
| New Orleans – Multifamily | $14.4 | 1.8% | 0.5% |
| New Orleans – Office | $26.9 | 5.2% | 0.0% |
| New Orleans – Other | $14.6 | 9.6% | 0.0% |
| New Orleans – Retail | $5.6 | 0.9% | 0.0% |
| New Orleans – Self Storage | $0.0 | 0.0% | 0.0% |
| New York-Northern New Jersey-Long Island, NY-NJ-PA MSA | $8,519.9 | 6.6% | 0.3% |
| New York City – Hotel | $934.4 | 24.4% | 0.8% |
| New York City – Industrial | $120.0 | 2.8% | -0.1% |
| New York City – Multifamily | $1,404.7 | 3.9% | 0.8% |
| New York City – Office | $2,064.2 | 4.4% | 1.0% |
| New York City – Other | $1,833.4 | 8.1% | 0.0% |
| New York City – Retail | $2,163.2 | 17.4% | -2.9% |
| New York City – Self Storage | $0.0 | 0.0% | 0.0% |
| Orlando-Kissimmee, FL MSA | $102.7 | 1.0% | 0.0% |
| Orlando – Hotel | $13.5 | 0.5% | 0.0% |
| Orlando – Industrial | $0.0 | 0.0% | 0.0% |
| Orlando – Multifamily | $0.0 | 0.0% | 0.0% |
| Orlando – Office | $61.0 | 11.5% | 0.0% |
| Orlando – Other | $0.0 | 0.0% | 0.0% |
| Orlando – Retail | $28.2 | 3.2% | 0.0% |
| Orlando – Self Storage | $0.0 | 0.0% | 0.0% |
| Philadelphia-Camden-Wilmington, PA-NJ-DE-MD MSA | $1,201.3 | 5.8% | 0.7% |
| Philadelphia – Hotel | $117.0 | 13.8% | 0.1% |
| Philadelphia – Industrial | $18.5 | 0.6% | 0.3% |
| Philadelphia – Multifamily | $54.9 | 0.6% | 0.0% |
| Philadelphia – Office | $530.6 | 13.8% | 2.6% |
| Philadelphia – Other | $439.4 | 35.4% | 2.3% |
| Philadelphia – Retail | $41.1 | 1.9% | 0.5% |
| Philadelphia – Self Storage | $0.0 | 0.0% | 0.0% |
| Phoenix-Mesa-Scottsdale, AZ MSA | $297.8 | 1.5% | 0.2% |
| Phoenix – Hotel | $54.1 | 3.0% | -0.1% |
| Phoenix – Industrial | $3.0 | 0.3% | 0.3% |
| Phoenix – Multifamily | $0.0 | 0.0% | 0.0% |
| Phoenix – Office | $79.9 | 3.6% | 1.3% |
| Phoenix – Other | $26.9 | 2.9% | 0.8% |
| Phoenix – Retail | $133.8 | 6.2% | 0.1% |
| Phoenix – Self Storage | $0.0 | 0.0% | 0.0% |
| Pittsburgh, PA MSA | $236.3 | 5.2% | -1.2% |
| Pittsburgh – Hotel | $8.2 | 4.8% | 0.0% |
| Pittsburgh – Industrial | $0.0 | 0.0% | 0.0% |
| Pittsburgh – Multifamily | $21.9 | 1.0% | -1.3% |
| Pittsburgh – Office | $88.7 | 8.1% | -2.0% |
| Pittsburgh – Other | $104.8 | 30.0% | -3.0% |
| Pittsburgh – Retail | $12.7 | 2.6% | 0.0% |
| Pittsburgh – Self Storage | $0.0 | 0.0% | 0.0% |
| Portland-Vancouver-Beaverton, OR-WA MSA | $356.7 | 4.1% | 0.4% |
| Portland – Hotel | $295.6 | 33.2% | -0.1% |
| Portland – Industrial | $0.0 | 0.0% | 0.0% |
| Portland – Multifamily | $38.1 | 0.9% | 0.9% |
| Portland – Office | $12.8 | 2.7% | -3.8% |
| Portland – Other | $10.1 | 2.1% | 2.1% |
| Portland – Retail | $0.0 | 0.0% | 0.0% |
| Portland – Self Storage | $0.0 | 0.0% | 0.0% |
| Raleigh-Cary, NC MSA | $21.8 | 0.6% | 0.0% |
| Raleigh – Hotel | $15.3 | 5.8% | -0.2% |
| Raleigh – Industrial | $0.0 | 0.0% | 0.0% |
| Raleigh – Multifamily | $0.0 | 0.0% | 0.0% |
| Raleigh – Office | $0.0 | 0.0% | 0.0% |
| Raleigh – Other | $6.6 | 4.1% | 0.5% |
| Raleigh – Retail | $0.0 | 0.0% | 0.0% |
| Raleigh – Self Storage | $0.0 | 0.0% | 0.0% |
| Richmond, VA MSA | $153.8 | 4.8% | 0.1% |
| Richmond – Hotel | $0.0 | 0.0% | 0.0% |
| Richmond – Industrial | $0.0 | 0.0% | 0.0% |
| Richmond – Multifamily | $0.0 | 0.0% | 0.0% |
| Richmond – Office | $0.0 | 0.0% | 0.0% |
| Richmond – Other | $10.4 | 7.3% | -1.6% |
| Richmond – Retail | $143.4 | 32.8% | 1.2% |
| Richmond – Self Storage | $0.0 | 0.0% | 0.0% |
| Riverside-San Bernardino-Ontario, CA MSA | $283.8 | 2.4% | 0.0% |
| Riverside – Hotel | $29.5 | 6.2% | -0.2% |
| Riverside – Industrial | $0.0 | 0.0% | 0.0% |
| Riverside – Multifamily | $1.4 | 0.0% | 0.0% |
| Riverside – Office | $0.0 | 0.0% | 0.0% |
| Riverside – Other | $0.0 | 0.0% | 0.0% |
| Riverside – Retail | $252.9 | 13.0% | 0.4% |
| Riverside – Self Storage | $0.0 | 0.0% | 0.0% |
| Sacramento-Arden-Arcade-Roseville, CA MSA | $25.0 | 0.5% | 0.2% |
| Sacramento – Hotel | $0.0 | 0.0% | 0.0% |
| Sacramento – Industrial | $0.0 | 0.0% | 0.0% |
| Sacramento – Multifamily | $0.0 | 0.0% | 0.0% |
| Sacramento – Office | $14.2 | 1.8% | 1.0% |
| Sacramento – Other | $10.8 | 2.8% | -0.2% |
| Sacramento – Retail | $0.0 | 0.0% | 0.0% |
| Sacramento – Self Storage | $0.0 | 0.0% | 0.0% |
| Salt Lake City, UT MSA | $0.0 | 0.0% | -0.1% |
| Salt Lake City – Hotel | $0.0 | 0.0% | -1.9% |
| Salt Lake City – Industrial | $0.0 | 0.0% | 0.0% |
| Salt Lake City – Multifamily | $0.0 | 0.0% | 0.0% |
| Salt Lake City – Office | $0.0 | 0.0% | 0.0% |
| Salt Lake City – Other | $0.0 | 0.0% | 0.0% |
| Salt Lake City – Retail | $0.0 | 0.0% | 0.0% |
| Salt Lake City – Self Storage | $0.0 | 0.0% | 0.0% |
| San Antonio, TX MSA | $186.5 | 2.8% | 0.0% |
| San Antonio – Hotel | $16.4 | 5.0% | -1.3% |
| San Antonio – Industrial | $0.0 | 0.0% | 0.0% |
| San Antonio – Multifamily | $0.0 | 0.0% | 0.0% |
| San Antonio – Office | $56.1 | 14.1% | 0.9% |
| San Antonio – Other | $0.0 | 0.0% | 0.0% |
| San Antonio – Retail | $114.0 | 14.7% | -0.1% |
| San Antonio – Self Storage | $0.0 | 0.0% | 0.0% |
| San Diego-Carlsbad-San Marcos, CA MSA | $63.5 | 0.6% | 0.0% |
| San Diego – Hotel | $56.6 | 4.4% | 1.5% |
| San Diego – Industrial | $0.0 | 0.0% | 0.0% |
| San Diego – Multifamily | $4.1 | 0.1% | 0.0% |
| San Diego – Office | $0.0 | 0.0% | 0.0% |
| San Diego – Other | $0.0 | 0.0% | 0.0% |
| San Diego – Retail | $2.9 | 0.2% | 0.0% |
| San Diego – Self Storage | $0.0 | 0.0% | 0.0% |
| San Francisco-Oakland-Fremont, CA MSA | $1,291.2 | 4.9% | 0.0% |
| San Francisco – Hotel | $209.4 | 7.1% | 0.0% |
| San Francisco – Industrial | $0.0 | 0.0% | 0.0% |
| San Francisco – Multifamily | $450.8 | 5.6% | 0.0% |
| San Francisco – Office | $458.0 | 4.5% | 0.1% |
| San Francisco – Other | $135.3 | 4.3% | -0.2% |
| San Francisco – Retail | $37.8 | 3.4% | -1.5% |
| San Francisco – Self Storage | $0.0 | 0.0% | 0.0% |
| San Jose-Sunnyvale-Santa Clara, CA MSA | $198.7 | 1.0% | 0.3% |
| San Jose – Hotel | $35.0 | 0.5% | 0.0% |
| San Jose – Industrial | $0.0 | 0.0% | 0.0% |
| San Jose – Multifamily | $6.4 | 0.2% | 0.0% |
| San Jose – Office | $157.4 | 2.0% | 0.6% |
| San Jose – Other | $0.0 | 0.0% | 0.0% |
| San Jose – Retail | $0.0 | 0.0% | 0.0% |
| San Jose – Self Storage | $0.0 | 0.0% | 0.0% |
| Seattle-Tacoma-Bellevue, WA MSA | $110.0 | 0.5% | 0.2% |
| Seattle – Hotel | $35.7 | 2.6% | 0.0% |
| Seattle – Industrial | $0.0 | 0.0% | 0.0% |
| Seattle – Multifamily | $51.9 | 0.7% | 0.7% |
| Seattle – Office | $0.0 | 0.0% | 0.0% |
| Seattle – Other | $22.4 | 1.4% | 0.0% |
| Seattle – Retail | $0.0 | 0.0% | 0.0% |
| Seattle – Self Storage | $0.0 | 0.0% | 0.0% |
| St. Louis, MO-IL MSA | $108.7 | 2.6% | -2.7% |
| St. Louis – Hotel | $1.7 | 0.5% | 0.0% |
| St. Louis – Industrial | $0.0 | 0.0% | 0.0% |
| St. Louis – Multifamily | $3.2 | 0.2% | 0.0% |
| St. Louis – Office | $61.6 | 14.1% | 10.2% |
| St. Louis – Other | $13.9 | 2.9% | 0.1% |
| St. Louis – Retail | $28.3 | 3.2% | -17.0% |
| St. Louis – Self Storage | $0.0 | 0.0% | 0.0% |
| Tampa-St. Petersburg-Clearwater, FL MSA | $210.3 | 1.9% | 0.5% |
| Tampa – Hotel | $58.8 | 7.8% | -0.3% |
| Tampa – Industrial | $7.0 | 2.9% | 2.9% |
| Tampa – Multifamily | $1.2 | 0.0% | 0.0% |
| Tampa – Office | $59.4 | 8.0% | 3.1% |
| Tampa – Other | $42.9 | 12.9% | 6.5% |
| Tampa – Retail | $41.0 | 6.2% | 0.2% |
| Tampa – Self Storage | $0.0 | 0.0% | 0.0% |
| Tucson, AZ MSA | $155.7 | 4.6% | 0.1% |
| Tucson – Hotel | $0.0 | 0.0% | 0.0% |
| Tucson – Industrial | $0.0 | 0.0% | 0.0% |
| Tucson – Multifamily | $0.0 | 0.0% | 0.0% |
| Tucson – Office | $0.0 | 0.0% | 0.0% |
| Tucson – Other | $0.0 | 0.0% | 0.0% |
| Tucson – Retail | $155.7 | 19.4% | -0.7% |
| Tucson – Self Storage | $0.0 | 0.0% | 0.0% |
| Virginia Beach-Norfolk-Newport News, VA-NC MSA | $182.7 | 3.8% | 0.0% |
| Virginia Beach – Hotel | $14.8 | 3.3% | 0.0% |
| Virginia Beach – Industrial | $0.0 | 0.0% | 0.0% |
| Virginia Beach – Multifamily | $0.0 | 0.0% | 0.0% |
| Virginia Beach – Office | $0.0 | 0.0% | 0.0% |
| Virginia Beach – Other | $4.4 | 3.5% | 0.0% |
| Virginia Beach – Retail | $163.5 | 18.9% | 0.4% |
| Virginia Beach – Self Storage | $0.0 | 0.0% | 0.0% |
| Washington-Arlington-Alexandria, DC-VA-MD-WV MSA | $1,861.7 | 5.9% | 2.5% |
| Washington, DC – Hotel | $40.6 | 3.6% | -0.1% |
| Washington, DC – Industrial | $0.0 | 0.0% | 0.0% |
| Washington, DC – Multifamily | $0.0 | 0.0% | 0.0% |
| Washington, DC – Office | $1,614.8 | 21.1% | 10.6% |
| Washington, DC – Other | $63.5 | 4.9% | -2.6% |
| Washington, DC – Retail | $142.8 | 4.3% | 0.1% |
| Washington, DC – Self Storage | $0.0 | 0.0% | 0.0% |
| Grand Total | $32,053.5 | 4.5% | 0.6% |
About CRED iQ
CRED iQ is a commercial real estate data, analytics, and valuation platform providing actionable intelligence to CRE and capital markets investors. Subscribers use the platform to identify valuable leads for leasing, lending, refinancing, distressed debt, and acquisition opportunities.
The platform also offers a highly efficient valuation engine which can be leveraged across all property types and geographies. Our data platform is powered by over $2.0 trillion in transactions and data covering CRE, CMBS, CRE CLO, Single Asset Single Borrower (SASB), and all of GSE / Agency.
