
CRED iQ monitors distressed rates and market performance for nearly 400 MSAs across the United States, covering over $900 billion in outstanding commercial real estate (CRE) debt. Distressed rates (DQ + SS%) include loans that are specially serviced, delinquent, or a combination of both. Distressed rates and month-over-month changes for data reported as of May 2023 are presented below for the 50 largest MSAs, broken out by property type for a granular view of distress by market-sector.
Of the 50 largest MSAs tracked by CRED iQ, many exhibited recoveries from April surges in distressed rates exhibited across the majority of tracked markets. There were 37 markets with declines in CRE distress, equal to 74% of the 50 largest MSAs. The average decline in distress was approximately 64 basis points. The recoveries were a welcome signal of alleviation; however, declines in May were not enough to outweigh the extensive increases in distressed rates experienced in April by most markets. Notable markets with the sharpest declines in CRE distress this month included Charlotte (-2.7%), Minneapolis (-2.3%), and Birmingham, AL (-2.0%). Despite improvement in May, Minneapolis retains its position among the worst performing of the Top 50 markets with an overall distressed rate of 22.9%.
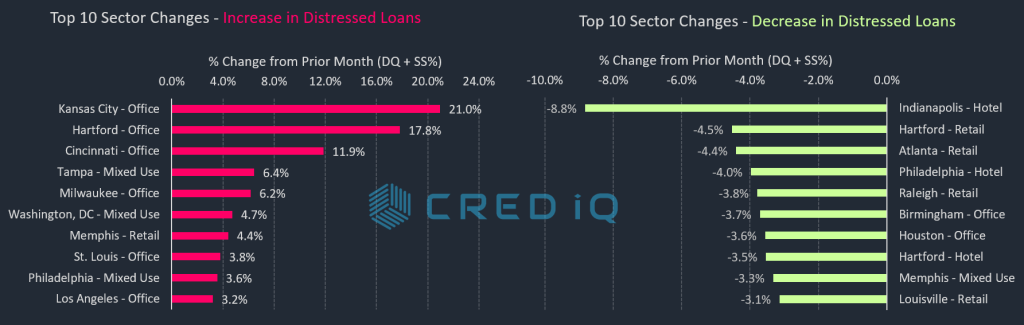
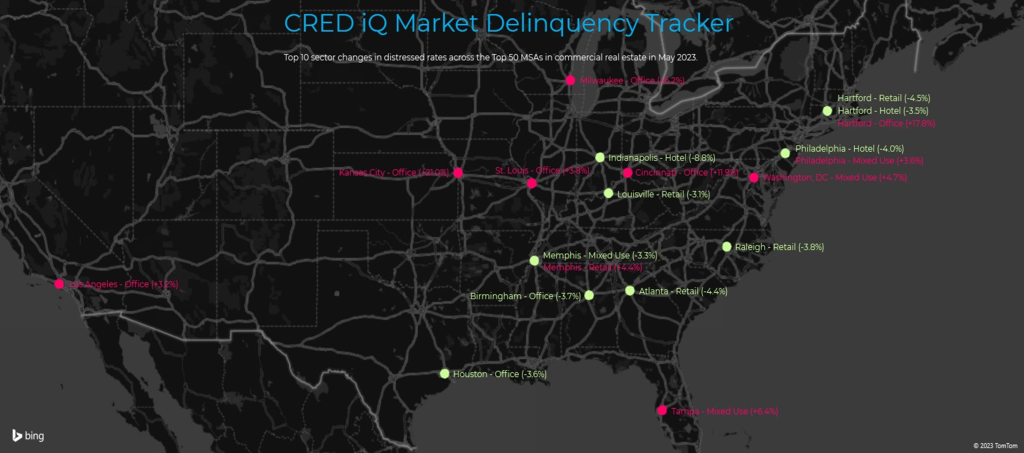
The Kansas City (+3.6%), New Orleans (+1.7%), and Bridgeport, CT (+1.1%) markets were among those that exhibited the highest month-over-month increases in distressed rates during May 2023. The Kansas City MSA was particularly impacted by the office sector after one of the largest properties in the market, the Aspiria Office Campus, transferred to special servicing. The campus encompasses 3.7 million SF of office space located Overland Park, KS and secures a $232.5 million mortgage. The special servicing transfer is related to the loan’s impending August 2023 maturity date.
For a more granular analysis of the Top 50 markets, CRED iQ further delineated individual markets’ distressed rates by property type for a comprehensive view by market-sector. After reviewing month-over-month changes in distress, CRED iQ observed that office or mixed-use sectors accounted for nine of the 10 largest increases in distress by market-sector. In addition to the Kansas City-Office market-sector, the Hartford-Office and Cincinnati-Office market-sectors exhibited relatively large month-over-month increases in distress. In the Hartford MSA, a $51.4 million mortgage secured by Constitution Plaza transferred to special servicing after a maturity default. In the Cincinnati MSA, two loans totaling $58.6 million, secured by office properties totaling 610,000 SF (312 Elm Street and 312 Plum Street), transferred to special servicing following occupancy declines. Additionally, a $1.3 billion mortgage secured by a portfolio of office and mixed-use properties owned by Workspace Property Trust transferred to special servicing in April 2023 and adversely impacted distressed rates for several market-sectors. The 146-property portfolio securing the loan is geographically dispersed across five markets: Miami, Minneapolis, Philadelphia, Phoenix, and Tampa. High collateral concentrations in the Philadelphia and Tampa office and mixed-use market-sectors caused some of the highest individual increases in distress this month among the 50 largest MSAs.
Switching focus to positive developments, the Indianapolis-Hotel market-sector exhibited the greatest month-over-month improvement in CRE distress. The decline in the lodging distressed rate for the Indianapolis MSA was driven primary by the cure of a $49.2 million loan secured by the Conrad Indianapolis, a 247-room full-service hotel located along the circumference of Monument Circle in the Indianapolis CBD. The loan transferred to special servicing in April 2020, but returned to the master servicer as a corrected loan three years later after multiple forbearances.
As previously highlighted, the Minneapolis MSA has the highest overall distressed rate — equal to 22.9% — and has maintained this position for the trailing 12 months. Cleveland (10.3%), Milwaukee (10.1%), Chicago (10.0%), and Birmingham, AL (8.7%) comprise the remaining markets with the highest rates of distress. The Salt Lake City MSA (0.1%) has the lowest percentage of distress among the Top 50 MSAs. Last month, the San Jose market held position with the lowest percentage of distressed CRE loans; however, multiple San Jose office market loans became distressed in May.
View commercial real estate distressed rates broken out by market and property type below:
| MSA – Property Type | DQ/SS (millions) | DQ/SS (%) | Monthly Change |
| Allentown-Bethlehem-Easton, PA-NJ MSA | $76.6 | 2.4% | -0.2% |
| Allentown – Hotel | $0.0 | 0.0% | -3.1% |
| Allentown – Industrial | $0.0 | 0.0% | 0.0% |
| Allentown – Multifamily | $0.0 | 0.0% | 0.0% |
| Allentown – Office | $57.7 | 18.5% | 0.0% |
| Allentown – Other | $0.0 | 0.0% | 0.0% |
| Allentown – Retail | $18.8 | 5.1% | -0.1% |
| Allentown – Self Storage | $0.0 | 0.0% | 0.0% |
| Atlanta-Sandy Springs-Marietta, GA MSA | $567.0 | 2.1% | -0.8% |
| Atlanta – Hotel | $80.8 | 3.2% | -0.4% |
| Atlanta – Industrial | $0.0 | 0.0% | 0.0% |
| Atlanta – Multifamily | $4.5 | 0.0% | 0.0% |
| Atlanta – Office | $431.7 | 19.1% | -1.3% |
| Atlanta – Other | $0.0 | 0.0% | 0.0% |
| Atlanta – Retail | $50.0 | 2.7% | -4.4% |
| Atlanta – Self Storage | $0.0 | 0.0% | 0.0% |
| Austin-Round Rock, TX MSA | $89.8 | 1.0% | -0.6% |
| Austin – Hotel | $51.8 | 6.4% | -1.5% |
| Austin – Industrial | $0.0 | 0.0% | 0.0% |
| Austin – Multifamily | $0.0 | 0.0% | 0.0% |
| Austin – Office | $0.0 | 0.0% | 0.0% |
| Austin – Other | $4.1 | 1.3% | -0.6% |
| Austin – Retail | $33.9 | 4.5% | -1.9% |
| Austin – Self Storage | $0.0 | 0.0% | 0.0% |
| Baltimore-Towson, MD MSA | $394.2 | 4.1% | -0.8% |
| Baltimore – Hotel | $65.4 | 14.1% | -0.2% |
| Baltimore – Industrial | $0.0 | 0.0% | 0.0% |
| Baltimore – Multifamily | $5.1 | 0.1% | 0.0% |
| Baltimore – Office | $65.6 | 7.6% | 0.2% |
| Baltimore – Other | $11.4 | 5.5% | -1.2% |
| Baltimore – Retail | $246.7 | 23.3% | 0.2% |
| Baltimore – Self Storage | $0.0 | 0.0% | 0.0% |
| Birmingham-Hoover, AL MSA | $268.1 | 8.7% | -2.0% |
| Birmingham – Hotel | $10.3 | 7.6% | 0.0% |
| Birmingham – Industrial | $0.0 | 0.0% | 0.0% |
| Birmingham – Multifamily | $0.0 | 0.0% | 0.0% |
| Birmingham – Office | $93.6 | 19.7% | -3.7% |
| Birmingham – Other | $0.0 | 0.0% | 0.0% |
| Birmingham – Retail | $164.2 | 23.0% | -0.3% |
| Birmingham – Self Storage | $0.0 | 0.0% | 0.0% |
| Boston-Cambridge-Quincy, MA-NH MSA | $157.9 | 0.8% | -0.1% |
| Boston – Hotel | $19.3 | 1.2% | 0.1% |
| Boston – Industrial | $0.0 | 0.0% | 0.0% |
| Boston – Multifamily | $0.0 | 0.0% | 0.0% |
| Boston – Office | $50.3 | 0.7% | 0.0% |
| Boston – Other | $0.0 | 0.0% | 0.0% |
| Boston – Retail | $88.4 | 5.6% | 0.4% |
| Boston – Self Storage | $0.0 | 0.0% | 0.0% |
| Bridgeport-Stamford-Norwalk, CT MSA | $197.3 | 4.7% | 1.0% |
| Bridgeport – Hotel | $37.3 | 23.5% | -2.4% |
| Bridgeport – Industrial | $17.8 | 14.2% | -4.4% |
| Bridgeport – Multifamily | $0.0 | 0.0% | 0.0% |
| Bridgeport – Office | $132.4 | 11.1% | 5.0% |
| Bridgeport – Other | $9.8 | 3.4% | 1.2% |
| Bridgeport – Retail | $0.0 | 0.0% | 0.0% |
| Bridgeport – Self Storage | $0.0 | 0.0% | 0.0% |
| Charlotte-Gastonia-Concord, NC-SC MSA | $507.3 | 6.6% | -2.6% |
| Charlotte – Hotel | $47.1 | 5.3% | 0.8% |
| Charlotte – Industrial | $0.0 | 0.0% | 0.0% |
| Charlotte – Multifamily | $0.0 | 0.0% | 0.0% |
| Charlotte – Office | $276.5 | 31.0% | -5.6% |
| Charlotte – Other | $100.3 | 28.9% | -1.6% |
| Charlotte – Retail | $83.4 | 8.4% | 0.2% |
| Charlotte – Self Storage | $0.0 | 0.0% | 0.0% |
| Chicago-Naperville-Joliet, IL-IN-WI MSA | $2,890.5 | 10.0% | -0.8% |
| Chicago – Hotel | $738.8 | 40.2% | -1.7% |
| Chicago – Industrial | $8.6 | 0.2% | 0.2% |
| Chicago – Multifamily | $82.8 | 0.9% | 0.1% |
| Chicago – Office | $1,544.1 | 18.8% | -0.7% |
| Chicago – Other | $214.5 | 8.5% | -0.2% |
| Chicago – Retail | $301.8 | 9.7% | 2.4% |
| Chicago – Self Storage | $0.0 | 0.0% | 0.0% |
| Cincinnati-Middletown, OH-KY-IN MSA | $194.7 | 4.8% | 1.0% |
| Cincinnati – Hotel | $86.3 | 30.9% | -0.5% |
| Cincinnati – Industrial | $0.0 | 0.0% | 0.0% |
| Cincinnati – Multifamily | $0.0 | 0.0% | 0.0% |
| Cincinnati – Office | $58.6 | 11.9% | 11.9% |
| Cincinnati – Other | $6.8 | 2.7% | -0.4% |
| Cincinnati – Retail | $43.0 | 8.1% | 0.6% |
| Cincinnati – Self Storage | $0.0 | 0.0% | 0.0% |
| Cleveland-Elyria-Mentor, OH MSA | $436.8 | 10.3% | 0.9% |
| Cleveland – Hotel | $84.3 | 48.7% | -1.5% |
| Cleveland – Industrial | $0.0 | 0.0% | 0.0% |
| Cleveland – Multifamily | $0.0 | 0.0% | 0.0% |
| Cleveland – Office | $164.2 | 18.1% | 8.2% |
| Cleveland – Other | $180.7 | 45.4% | 1.7% |
| Cleveland – Retail | $7.6 | 1.1% | 0.0% |
| Cleveland – Self Storage | $0.0 | 0.0% | 0.0% |
| Columbus, OH MSA | $195.2 | 3.1% | -0.3% |
| Columbus, OH – Hotel | $18.1 | 7.0% | 0.0% |
| Columbus, OH – Industrial | $0.0 | 0.0% | 0.0% |
| Columbus, OH – Multifamily | $5.7 | 0.1% | 0.1% |
| Columbus, OH – Office | $57.2 | 8.5% | 0.2% |
| Columbus, OH – Other | $0.0 | 0.0% | 0.0% |
| Columbus, OH – Retail | $114.2 | 13.8% | 0.6% |
| Columbus, OH – Self Storage | $0.0 | 0.0% | 0.0% |
| Dallas-Fort Worth-Arlington, TX MSA | $315.2 | 0.9% | -0.2% |
| Dallas – Hotel | $118.5 | 3.4% | -0.2% |
| Dallas – Industrial | $0.0 | 0.0% | 0.0% |
| Dallas – Multifamily | $3.6 | 0.0% | 0.0% |
| Dallas – Office | $143.7 | 4.7% | 0.2% |
| Dallas – Other | $10.2 | 0.5% | 0.2% |
| Dallas – Retail | $39.3 | 2.1% | -0.1% |
| Dallas – Self Storage | $0.0 | 0.0% | 0.0% |
| Denver-Aurora, CO MSA | $853.7 | 5.4% | -0.9% |
| Denver – Hotel | $17.2 | 2.0% | -0.1% |
| Denver – Industrial | $0.0 | 0.0% | 0.0% |
| Denver – Multifamily | $0.0 | 0.0% | 0.0% |
| Denver – Office | $696.4 | 32.6% | 0.5% |
| Denver – Other | $93.9 | 9.9% | 5.6% |
| Denver – Retail | $46.2 | 3.4% | 0.2% |
| Denver – Self Storage | $0.0 | 0.0% | 0.0% |
| Detroit-Warren-Livonia, MI MSA | $253.1 | 2.4% | -0.3% |
| Detroit – Hotel | $83.8 | 12.8% | 0.1% |
| Detroit – Industrial | $18.8 | 2.9% | 0.0% |
| Detroit – Multifamily | $1.2 | 0.0% | 0.0% |
| Detroit – Office | $3.7 | 0.2% | -0.6% |
| Detroit – Other | $0.0 | 0.0% | 0.0% |
| Detroit – Retail | $145.6 | 10.0% | 0.3% |
| Detroit – Self Storage | $0.0 | 0.0% | 0.0% |
| Hartford-West Hartford-East Hartford, CT MSA | $196.9 | 7.9% | 0.6% |
| Hartford – Hotel | $0.0 | 0.0% | -3.5% |
| Hartford – Industrial | $0.0 | 0.0% | 0.0% |
| Hartford – Multifamily | $0.0 | 0.0% | 0.0% |
| Hartford – Office | $71.5 | 26.6% | 17.8% |
| Hartford – Other | $0.0 | 0.0% | 0.0% |
| Hartford – Retail | $125.4 | 38.7% | -4.5% |
| Hartford – Self Storage | $0.0 | 0.0% | 0.0% |
| Houston-Sugar Land-Baytown, TX MSA | $1,086.4 | 4.2% | -1.6% |
| Houston – Hotel | $389.9 | 43.5% | -2.9% |
| Houston – Industrial | $32.7 | 3.5% | -1.8% |
| Houston – Multifamily | $27.9 | 0.2% | 0.1% |
| Houston – Office | $505.0 | 14.4% | -3.6% |
| Houston – Other | $87.4 | 14.9% | -2.4% |
| Houston – Retail | $43.5 | 1.1% | 0.6% |
| Houston – Self Storage | $0.0 | 0.0% | 0.0% |
| Indianapolis-Carmel, IN MSA | $126.2 | 2.2% | -1.2% |
| Indianapolis – Hotel | $42.1 | 7.7% | -8.8% |
| Indianapolis – Industrial | $0.0 | 0.0% | 0.0% |
| Indianapolis – Multifamily | $9.7 | 0.3% | 0.3% |
| Indianapolis – Office | $59.7 | 9.6% | 0.3% |
| Indianapolis – Other | $0.0 | 0.0% | 0.0% |
| Indianapolis – Retail | $14.8 | 4.3% | 0.5% |
| Indianapolis – Self Storage | $0.0 | 0.0% | 0.0% |
| Jacksonville, FL MSA | $174.4 | 3.4% | -0.7% |
| Jacksonville – Hotel | $24.4 | 6.0% | -0.2% |
| Jacksonville – Industrial | $0.0 | 0.0% | 0.0% |
| Jacksonville – Multifamily | $0.0 | 0.0% | 0.0% |
| Jacksonville – Office | $38.1 | 6.9% | 0.1% |
| Jacksonville – Other | $0.0 | 0.0% | 0.0% |
| Jacksonville – Retail | $111.8 | 29.3% | 3.9% |
| Jacksonville – Self Storage | $0.0 | 0.0% | 0.0% |
| Kansas City, MO-KS MSA | $316.1 | 5.7% | 3.6% |
| Kansas City – Hotel | $28.1 | 12.2% | -0.3% |
| Kansas City – Industrial | $0.0 | 0.0% | 0.0% |
| Kansas City – Multifamily | $2.5 | 0.1% | 0.0% |
| Kansas City – Office | $232.5 | 21.0% | 21.0% |
| Kansas City – Other | $20.8 | 10.5% | -1.0% |
| Kansas City – Retail | $32.1 | 5.9% | -2.6% |
| Kansas City – Self Storage | $0.0 | 0.0% | 0.0% |
| Las Vegas-Paradise, NV MSA | $602.7 | 2.6% | -0.1% |
| Las Vegas – Hotel | $30.3 | 0.3% | 0.1% |
| Las Vegas – Industrial | $0.0 | 0.0% | 0.0% |
| Las Vegas – Multifamily | $0.0 | 0.0% | 0.0% |
| Las Vegas – Office | $0.0 | 0.0% | 0.0% |
| Las Vegas – Other | $325.0 | 41.2% | 1.9% |
| Las Vegas – Retail | $247.3 | 6.8% | 1.0% |
| Las Vegas – Self Storage | $0.0 | 0.0% | 0.0% |
| Los Angeles-Long Beach-Santa Ana, CA MSA | $2,256.1 | 4.2% | 0.0% |
| Los Angeles – Hotel | $161.9 | 3.0% | -0.2% |
| Los Angeles – Industrial | $0.0 | 0.0% | 0.0% |
| Los Angeles – Multifamily | $6.8 | 0.0% | 0.0% |
| Los Angeles – Office | $1,124.5 | 9.1% | 3.2% |
| Los Angeles – Other | $66.4 | 2.1% | -1.8% |
| Los Angeles – Retail | $896.6 | 14.7% | -0.9% |
| Los Angeles – Self Storage | $0.0 | 0.0% | -0.9% |
| Louisville/Jefferson County, KY-IN MSA | $22.0 | 0.7% | -0.4% |
| Louisville – Hotel | $0.0 | 0.0% | 0.0% |
| Louisville – Industrial | $0.0 | 0.0% | 0.0% |
| Louisville – Multifamily | $6.9 | 0.5% | 0.5% |
| Louisville – Office | $0.0 | 0.0% | 0.0% |
| Louisville – Other | $0.0 | 0.0% | 0.0% |
| Louisville – Retail | $15.1 | 3.0% | -3.1% |
| Louisville – Self Storage | $0.0 | 0.0% | 0.0% |
| Memphis, TN-AR-MS MSA | $91.3 | 3.8% | -0.1% |
| Memphis – Hotel | $22.5 | 10.5% | -2.3% |
| Memphis – Industrial | $0.0 | 0.0% | 0.0% |
| Memphis – Multifamily | $0.0 | 0.0% | 0.0% |
| Memphis – Office | $0.0 | 0.0% | 0.0% |
| Memphis – Other | $5.3 | 14.7% | -3.3% |
| Memphis – Retail | $63.5 | 16.7% | 4.4% |
| Memphis – Self Storage | $0.0 | 0.0% | 0.0% |
| Miami-Fort Lauderdale-Pompano Beach, FL MSA | $350.5 | 1.4% | 0.0% |
| Miami – Hotel | $59.7 | 1.1% | -0.2% |
| Miami – Industrial | $0.0 | 0.0% | 0.0% |
| Miami – Multifamily | $0.0 | 0.0% | 0.0% |
| Miami – Office | $44.6 | 1.7% | 1.5% |
| Miami – Other | $0.0 | 0.0% | 0.0% |
| Miami – Retail | $246.2 | 4.5% | 0.0% |
| Miami – Self Storage | $0.0 | 0.0% | 0.0% |
| Milwaukee-Waukesha-West Allis, WI MSA | $245.5 | 10.1% | -0.4% |
| Milwaukee – Hotel | $16.5 | 10.3% | -0.5% |
| Milwaukee – Industrial | $0.0 | 0.0% | 0.0% |
| Milwaukee – Multifamily | $0.0 | 0.0% | 0.0% |
| Milwaukee – Office | $123.9 | 22.7% | 6.2% |
| Milwaukee – Other | $0.0 | 0.0% | 0.0% |
| Milwaukee – Retail | $105.1 | 24.2% | 0.5% |
| Milwaukee – Self Storage | $0.0 | 0.0% | 0.0% |
| Minneapolis-St. Paul-Bloomington, MN-WI MSA | $511.9 | 7.4% | -2.3% |
| Minneapolis – Hotel | $258.8 | 46.0% | 2.2% |
| Minneapolis – Industrial | $0.0 | 0.0% | 0.0% |
| Minneapolis – Multifamily | $9.8 | 0.3% | -0.1% |
| Minneapolis – Office | $77.5 | 3.9% | -0.3% |
| Minneapolis – Other | $165.7 | 33.5% | 0.5% |
| Minneapolis – Retail | $1,400.0 | 74.5% | 0.7% |
| Minneapolis – Self Storage | $0.0 | 0.0% | 0.0% |
| Nashville-Davidson-Murfreesboro-Franklin, TN MSA | $58.3 | 1.0% | -0.3% |
| Nashville – Hotel | $51.4 | 3.4% | -0.1% |
| Nashville – Industrial | $0.0 | 0.0% | 0.0% |
| Nashville – Multifamily | $0.0 | 0.0% | 0.0% |
| Nashville – Office | $0.0 | 0.0% | 0.0% |
| Nashville – Other | $0.0 | 0.0% | 0.0% |
| Nashville – Retail | $6.8 | 0.9% | -0.8% |
| Nashville – Self Storage | $0.0 | 0.0% | 0.0% |
| New Orleans-Metairie-Kenner, LA MSA | $115.0 | 3.4% | 1.7% |
| New Orleans – Hotel | $56.5 | 5.3% | 5.3% |
| New Orleans – Industrial | $0.0 | 0.0% | 0.0% |
| New Orleans – Multifamily | $11.3 | 1.3% | -0.1% |
| New Orleans – Office | $26.9 | 5.2% | 0.3% |
| New Orleans – Other | $14.6 | 9.6% | -0.2% |
| New Orleans – Retail | $5.6 | 0.9% | 0.2% |
| New Orleans – Self Storage | $0.0 | 0.0% | 0.0% |
| New York-Northern New Jersey-Long Island, NY-NJ-PA MSA | $8,192.5 | 6.3% | 0.2% |
| New York City – Hotel | $885.3 | 23.6% | -0.8% |
| New York City – Industrial | $120.1 | 2.9% | 0.1% |
| New York City – Multifamily | $1,159.6 | 3.2% | -0.2% |
| New York City – Office | $1,607.3 | 3.4% | 0.7% |
| New York City – Other | $1,797.2 | 8.1% | 0.5% |
| New York City – Retail | $2,623.0 | 20.3% | 1.0% |
| New York City – Self Storage | $0.0 | 0.0% | 0.0% |
| Orlando-Kissimmee, FL MSA | $102.8 | 1.0% | -0.2% |
| Orlando – Hotel | $13.5 | 0.5% | 0.0% |
| Orlando – Industrial | $0.0 | 0.0% | 0.0% |
| Orlando – Multifamily | $0.0 | 0.0% | 0.0% |
| Orlando – Office | $61.0 | 11.5% | 0.5% |
| Orlando – Other | $0.0 | 0.0% | 0.0% |
| Orlando – Retail | $28.3 | 3.2% | 0.1% |
| Orlando – Self Storage | $0.0 | 0.0% | 0.0% |
| Philadelphia-Camden-Wilmington, PA-NJ-DE-MD MSA | $1,067.3 | 5.2% | -0.8% |
| Philadelphia – Hotel | $117.1 | 13.7% | -4.0% |
| Philadelphia – Industrial | $10.3 | 0.3% | 0.0% |
| Philadelphia – Multifamily | $54.9 | 0.6% | -0.9% |
| Philadelphia – Office | $441.5 | 11.1% | 0.4% |
| Philadelphia – Other | $414.2 | 33.1% | 3.6% |
| Philadelphia – Retail | $29.3 | 1.3% | -0.1% |
| Philadelphia – Self Storage | $0.0 | 0.0% | 0.0% |
| Phoenix-Mesa-Scottsdale, AZ MSA | $257.7 | 1.3% | -0.2% |
| Phoenix – Hotel | $54.1 | 3.1% | -0.7% |
| Phoenix – Industrial | $0.0 | 0.0% | 0.0% |
| Phoenix – Multifamily | $0.0 | 0.0% | 0.0% |
| Phoenix – Office | $52.0 | 2.3% | 0.2% |
| Phoenix – Other | $17.7 | 2.1% | 1.2% |
| Phoenix – Retail | $133.8 | 6.2% | -1.7% |
| Phoenix – Self Storage | $0.0 | 0.0% | 0.0% |
| Pittsburgh, PA MSA | $290.9 | 6.4% | 0.3% |
| Pittsburgh – Hotel | $8.3 | 4.8% | -10.6% |
| Pittsburgh – Industrial | $0.0 | 0.0% | 0.0% |
| Pittsburgh – Multifamily | $50.7 | 2.3% | 2.2% |
| Pittsburgh – Office | $103.7 | 10.2% | 0.3% |
| Pittsburgh – Other | $115.5 | 33.0% | 3.0% |
| Pittsburgh – Retail | $12.7 | 2.6% | 1.1% |
| Pittsburgh – Self Storage | $0.0 | 0.0% | 0.0% |
| Portland-Vancouver-Beaverton, OR-WA MSA | $326.7 | 3.7% | -0.6% |
| Portland – Hotel | $295.8 | 33.3% | -0.2% |
| Portland – Industrial | $0.0 | 0.0% | 0.0% |
| Portland – Multifamily | $0.0 | 0.0% | 0.0% |
| Portland – Office | $31.0 | 6.5% | 2.2% |
| Portland – Other | $0.0 | 0.0% | 0.0% |
| Portland – Retail | $0.0 | 0.0% | 0.0% |
| Portland – Self Storage | $0.0 | 0.0% | 0.0% |
| Raleigh-Cary, NC MSA | $21.8 | 0.6% | -0.4% |
| Raleigh – Hotel | $15.3 | 6.0% | -0.4% |
| Raleigh – Industrial | $0.0 | 0.0% | 0.0% |
| Raleigh – Multifamily | $0.0 | 0.0% | 0.0% |
| Raleigh – Office | $0.0 | 0.0% | 0.0% |
| Raleigh – Other | $6.6 | 3.6% | 0.7% |
| Raleigh – Retail | $0.0 | 0.0% | -3.8% |
| Raleigh – Self Storage | $0.0 | 0.0% | 0.0% |
| Richmond, VA MSA | $156.9 | 4.7% | -1.1% |
| Richmond – Hotel | $0.0 | 0.0% | 0.0% |
| Richmond – Industrial | $0.0 | 0.0% | 0.0% |
| Richmond – Multifamily | $0.0 | 0.0% | 0.0% |
| Richmond – Office | $0.0 | 0.0% | 0.0% |
| Richmond – Other | $12.8 | 8.8% | 0.0% |
| Richmond – Retail | $144.1 | 31.6% | 1.4% |
| Richmond – Self Storage | $0.0 | 0.0% | 0.0% |
| Riverside-San Bernardino-Ontario, CA MSA | $284.0 | 2.4% | -0.4% |
| Riverside – Hotel | $29.6 | 6.3% | -2.6% |
| Riverside – Industrial | $0.0 | 0.0% | 0.0% |
| Riverside – Multifamily | $1.4 | 0.0% | 0.0% |
| Riverside – Office | $0.0 | 0.0% | 0.0% |
| Riverside – Other | $0.0 | 0.0% | 0.0% |
| Riverside – Retail | $253.0 | 12.6% | 0.8% |
| Riverside – Self Storage | $0.0 | 0.0% | 0.0% |
| Sacramento-Arden-Arcade-Roseville, CA MSA | $16.9 | 0.3% | -0.1% |
| Sacramento – Hotel | $0.0 | 0.0% | 0.0% |
| Sacramento – Industrial | $0.0 | 0.0% | 0.0% |
| Sacramento – Multifamily | $0.0 | 0.0% | 0.0% |
| Sacramento – Office | $6.1 | 0.8% | 0.0% |
| Sacramento – Other | $10.9 | 3.0% | -0.7% |
| Sacramento – Retail | $0.0 | 0.0% | 0.0% |
| Sacramento – Self Storage | $0.0 | 0.0% | 0.0% |
| Salt Lake City, UT MSA | $6.1 | 0.1% | -0.2% |
| Salt Lake City – Hotel | $6.1 | 1.9% | -0.2% |
| Salt Lake City – Industrial | $0.0 | 0.0% | 0.0% |
| Salt Lake City – Multifamily | $0.0 | 0.0% | 0.0% |
| Salt Lake City – Office | $0.0 | 0.0% | 0.0% |
| Salt Lake City – Other | $0.0 | 0.0% | 0.0% |
| Salt Lake City – Retail | $0.0 | 0.0% | -1.0% |
| Salt Lake City – Self Storage | $0.0 | 0.0% | 0.0% |
| San Antonio, TX MSA | $186.9 | 2.9% | -1.1% |
| San Antonio – Hotel | $16.4 | 6.3% | -2.5% |
| San Antonio – Industrial | $0.0 | 0.0% | 0.0% |
| San Antonio – Multifamily | $0.0 | 0.0% | 0.0% |
| San Antonio – Office | $56.2 | 13.2% | 0.0% |
| San Antonio – Other | $0.0 | 0.0% | 0.0% |
| San Antonio – Retail | $114.3 | 14.8% | -0.5% |
| San Antonio – Self Storage | $0.0 | 0.0% | 0.0% |
| San Diego-Carlsbad-San Marcos, CA MSA | $63.6 | 0.5% | -0.1% |
| San Diego – Hotel | $56.6 | 2.9% | -0.5% |
| San Diego – Industrial | $0.0 | 0.0% | 0.0% |
| San Diego – Multifamily | $4.1 | 0.1% | 0.0% |
| San Diego – Office | $0.0 | 0.0% | 0.0% |
| San Diego – Other | $0.0 | 0.0% | 0.0% |
| San Diego – Retail | $2.9 | 0.2% | 0.0% |
| San Diego – Self Storage | $0.0 | 0.0% | 0.0% |
| San Francisco-Oakland-Fremont, CA MSA | $1,296.9 | 4.9% | 0.0% |
| San Francisco – Hotel | $209.4 | 7.1% | 0.2% |
| San Francisco – Industrial | $0.0 | 0.0% | 0.0% |
| San Francisco – Multifamily | $450.8 | 5.6% | -1.3% |
| San Francisco – Office | $437.7 | 4.4% | 0.3% |
| San Francisco – Other | $143.3 | 4.5% | 0.5% |
| San Francisco – Retail | $55.6 | 4.9% | 0.8% |
| San Francisco – Self Storage | $0.0 | 0.0% | 0.0% |
| San Jose-Sunnyvale-Santa Clara, CA MSA | $146.5 | 0.7% | 0.4% |
| San Jose – Hotel | $35.1 | 0.5% | 0.0% |
| San Jose – Industrial | $0.0 | 0.0% | 0.0% |
| San Jose – Multifamily | $6.4 | 0.2% | 0.2% |
| San Jose – Office | $105.0 | 1.3% | 1.1% |
| San Jose – Other | $0.0 | 0.0% | 0.0% |
| San Jose – Retail | $0.0 | 0.0% | 0.0% |
| San Jose – Self Storage | $0.0 | 0.0% | 0.0% |
| Seattle-Tacoma-Bellevue, WA MSA | $58.2 | 0.3% | -0.2% |
| Seattle – Hotel | $35.8 | 2.6% | -1.7% |
| Seattle – Industrial | $0.0 | 0.0% | 0.0% |
| Seattle – Multifamily | $0.0 | 0.0% | 0.0% |
| Seattle – Office | $0.0 | 0.0% | 0.0% |
| Seattle – Other | $22.4 | 1.4% | -0.1% |
| Seattle – Retail | $0.0 | 0.0% | 0.0% |
| Seattle – Self Storage | $0.0 | 0.0% | 0.0% |
| St. Louis, MO-IL MSA | $219.5 | 5.3% | 0.1% |
| St. Louis – Hotel | $1.7 | 0.5% | 0.0% |
| St. Louis – Industrial | $0.0 | 0.0% | 0.0% |
| St. Louis – Multifamily | $3.2 | 0.2% | -0.1% |
| St. Louis – Office | $16.7 | 3.8% | 3.8% |
| St. Louis – Other | $13.9 | 2.9% | 0.4% |
| St. Louis – Retail | $184.0 | 20.2% | 0.9% |
| St. Louis – Self Storage | $0.0 | 0.0% | 0.0% |
| Tampa-St. Petersburg-Clearwater, FL MSA | $159.2 | 1.5% | 0.3% |
| Tampa – Hotel | $58.8 | 8.1% | -1.2% |
| Tampa – Industrial | $0.0 | 0.0% | 0.0% |
| Tampa – Multifamily | $1.2 | 0.0% | 0.0% |
| Tampa – Office | $36.7 | 4.8% | 2.3% |
| Tampa – Other | $21.4 | 6.4% | 6.4% |
| Tampa – Retail | $41.1 | 6.0% | 2.1% |
| Tampa – Self Storage | $0.0 | 0.0% | 0.0% |
| Tucson, AZ MSA | $156.1 | 4.6% | -0.6% |
| Tucson – Hotel | $0.0 | 0.0% | 0.0% |
| Tucson – Industrial | $0.0 | 0.0% | 0.0% |
| Tucson – Multifamily | $0.0 | 0.0% | 0.0% |
| Tucson – Office | $0.0 | 0.0% | 0.0% |
| Tucson – Other | $0.0 | 0.0% | 0.0% |
| Tucson – Retail | $156.1 | 20.0% | 0.2% |
| Tucson – Self Storage | $0.0 | 0.0% | 0.0% |
| Virginia Beach-Norfolk-Newport News, VA-NC MSA | $182.8 | 3.8% | -0.8% |
| Virginia Beach – Hotel | $14.8 | 3.3% | -0.1% |
| Virginia Beach – Industrial | $0.0 | 0.0% | 0.0% |
| Virginia Beach – Multifamily | $0.0 | 0.0% | 0.0% |
| Virginia Beach – Office | $0.0 | 0.0% | 0.0% |
| Virginia Beach – Other | $4.4 | 3.5% | 0.4% |
| Virginia Beach – Retail | $163.6 | 18.5% | 0.2% |
| Virginia Beach – Self Storage | $0.0 | 0.0% | 0.0% |
| Washington-Arlington-Alexandria, DC-VA-MD-WV MSA | $1,082.2 | 3.4% | -0.1% |
| Washington, DC – Hotel | $40.6 | 3.7% | 0.0% |
| Washington, DC – Industrial | $0.0 | 0.0% | 0.0% |
| Washington, DC – Multifamily | $0.0 | 0.0% | 0.0% |
| Washington, DC – Office | $790.8 | 10.5% | 0.5% |
| Washington, DC – Other | $107.7 | 7.5% | 4.7% |
| Washington, DC – Retail | $143.1 | 4.3% | 0.4% |
| Washington, DC – Self Storage | $0.0 | 0.0% | 0.0% |
| Grand Total | $27,825.9 | 3.8% | -0.5% |
About CRED iQ
CRED iQ is a commercial real estate data, analytics, and valuation platform providing actionable intelligence to CRE and capital markets investors. Subscribers use the platform to identify valuable leads for leasing, lending, refinancing, distressed debt, and acquisition opportunities.
The platform also offers a highly efficient valuation engine which can be leveraged across all property types and geographies. Our data platform is powered by over $2.0 trillion in transactions and data covering CRE, CMBS, CRE CLO, Single Asset Single Borrower (SASB), and all of GSE / Agency.
