This week, CRED iQ calculated real-time valuations for 5 office and industrial properties that have major tenants with lease expirations in the next 6 months. Featured leases include tenant spaces at industrial/flex complexes in Houston, TX and Los Angeles, CA as well as large blocks of office space in the Phoenix, Portland, and Minneapolis MSAs. Lease expirations are opportunities for tenant reps to source options and find solutions for clients. Additionally, lease expirations can serve as a preemptive signal of distress for CRE loans if prospects for leasing the newly vacant space are low.
The CRED iQ valuations factor in a base-case (Most Likely), a downside (significant loss of tenants), and dark scenarios (100% vacant). Select valuations are provided for the properties below. For full access to the valuation reports including all 3 valuation scenarios as well as full CMBS loan reporting, with detailed financials, updated tenant information, and borrower contact information, sign up for a free trial here.
FMC Technologies
462,717 sf, Industrial, Houston, TX [View Details]
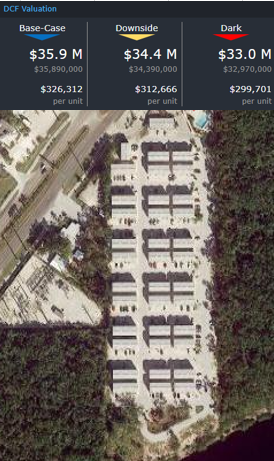
TechnipFMC leases approximately 462,000 sf of industrial space in the North Belt submarket of Houston, TX. Although the lease expires on March 31, 2022, TechnipFMC physically vacated the property in 2017 after a merger between FMC Technologies and Technip SA created the need to consolidate operations. As first reported by the Houston Business Journal, brokerage firms Binswanger and Avison Young were retained to sublease the remaining term of TechnipFMC’s lease following the merger. The property secures a $27.2 million mortgage with a maturity date in 2037. The loan had an anticipated repayment date (ARD) in 2017 but refinancing at the time was likely difficult with a dark property. The industrial complex spans 38 acres and allows for heavy manufacturing uses with several dock high doors and cranes. Unlike Houston’s office market, which has had its struggles with large blocks of empty space, the industrial market has seen declining vacancy rates in 2021, which offers an optimistic view on the leasing prospects for the property. However, there has not been a replacement tenant for more than 3 years. For the full valuation report and loan-level details, click here.

| Property Name | FMC Technologies |
| Address | 1701 Gears Road Houston, TX 77067 |
| Outstanding Balance | $27,180,775 |
| Interest Rate | 5.60% |
| Maturity Date | 4/11/2037 |
| Most Recent Appraisal | $65,000,000 ($140/sf) |
| Most Recent Appraisal Date | 12/22/2006 |
| CRED iQ Base-Case Value | $39,920,000 ($86/sf) |
4141 N Scottsdale
147,864 sf, Office, Scottsdale, AZ [View Details]
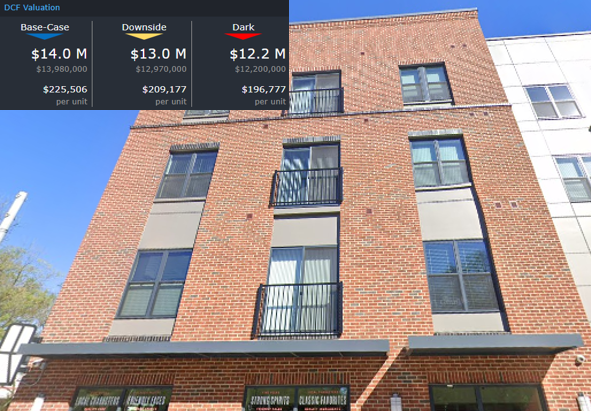
Aetna is vacating approximately 107,000 sf of office space in the Old Town neighborhood of Scottsdale, AZ upon its December 31, 2021 lease expiration. The property, a 3-story office building, secures a $25.2 million mortgage that is scheduled to mature on February 6, 2025. Aetna accounts for about 73% of the property’s GLA. The healthcare company used the space for its Coventry Health Care operations, which it acquired in 2012. CRED iQ estimates occupancy of 24% for the office building following the departure of Aetna. Prior to loan origination in 2015, the property operated with 71% occupancy for several years. The office building benefits from a central downtown location, however, several adjacent office buildings also have substantially large blocks of office space available, including the Scottsdale Financial Center. For the full valuation report and loan-level details, click here.

| Property Name | 4141 N Scottsdale |
| Address | 4141 N. Scottsdale Road Scottsdale, AZ 85251 |
| Outstanding Balance | $25,236,497 |
| Interest Rate | 4.11% |
| Maturity Date | 2/6/2025 |
| Most Recent Appraisal | $36,100,000 ($244/sf) |
| Most Recent Appraisal Date | 11/20/2014 |
| CRED iQ Base-Case Value | $24,980,000 ($169/sf) |
The Lovejoy
83,422 sf, CBD Office, Portland, OR [View Details]
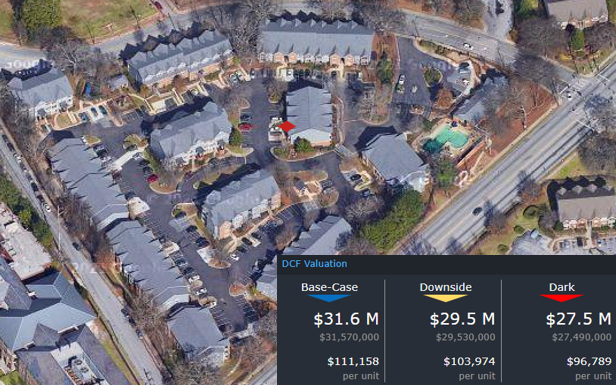
Buchalter is vacating 27,681 sf of space at lease expiration on March 31, 2022 at the Lovejoy office property in the Pearl District neighborhood of Portland, OR. The Oregon-based law firm is moving to Fox Tower, a 27-story Class-A building located more centrally to Portland’s CBD. Buchalter’s lease accounted for 33% of the GLA at the property, which secures a $24.0 million mortgage. The property’s largest tenant, Ruby Receptionists, has a lease that accounts for 34% of the GLA and expires in 2026. CRED iQ estimates occupancy will be approximately 57% following the departure of Buchalter. The mortgage is scheduled to mature on July 11, 2024. For the full valuation report and loan-level details, click here.

| Property Name | The Lovejoy |
| Address | 1331 Northwest Lovejoy Street Portland, OR 97209 |
| Outstanding Balance | $24,000,000 |
| Interest Rate | 4.31% |
| Maturity Date | 7/11/2024 |
| Most Recent Appraisal | $38,550,000 ($462/sf) |
| Most Recent Appraisal Date | 5/20/2014 |
| CRED iQ Base-Case Value | $25,680,000 ($308/sf) |
Gardena Office Campus
146,765 sf, Industrial (Flex), Gardena, CA [View Details]
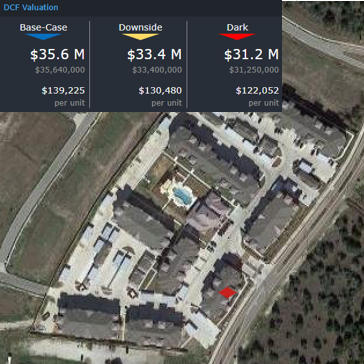
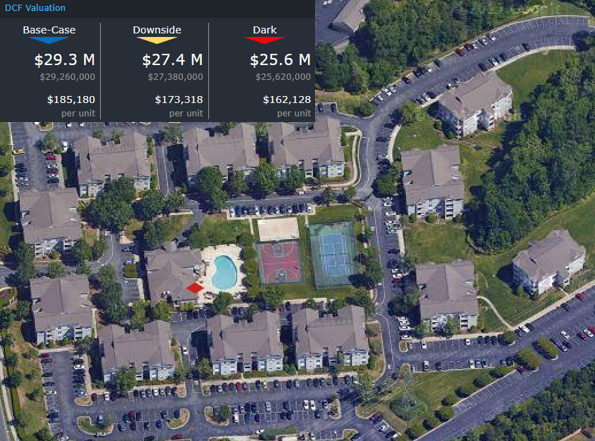
Faraday Future, an electric vehicle manufacturer, is the sole tenant at a flex industrial property located approximately 14 miles south of downtown Los Angeles. Its lease agreement has an initial expiration of April 30, 2022 with two, 5-year extension options. The tenant previously owned the property, which consists of two buildings containing creative office space and R&D facilities, but sold it to Atlas Capital Group in a sale-leaseback transaction that closed in March 2019. The property still serves as Faraday Future’s headquarters. Although the tenant has given no indication of its intent to extend or vacate, a positive signal for a lease renewal occurred in July 2021 when the EV manufacturer became a publicly traded company. Prior to this, concerns about the company’s financial viability were well publicized, including a failed venture with foreign real estate firm Evergrande. Should Faraday vacate, the borrower plans to market the available space as flex or reposition the property as creative office pending availability of capital. CRED iQ calculated a dark value for the property in the scenario that Faraday Future vacates. For the full valuation report and loan-level details, click here.

| Property Name | Gardena Office Campus |
| Address | 18455 S. Figueroa Street Gardena, CA 90248 |
| Outstanding Balance | $20,000,000 |
| Interest Rate | LIBOR + 2.95% |
| Maturity Date | 8/9/2022 |
| Most Recent Appraisal | $32,100,000 ($219/sf) |
| Most Recent Appraisal Date | 5/30/2019 |
| CRED iQ Dark Value | $24,040,000 ($164/sf) |
Riverview Office Tower
235,271 sf, Suburban Office, Bloomington, MN [View Details]
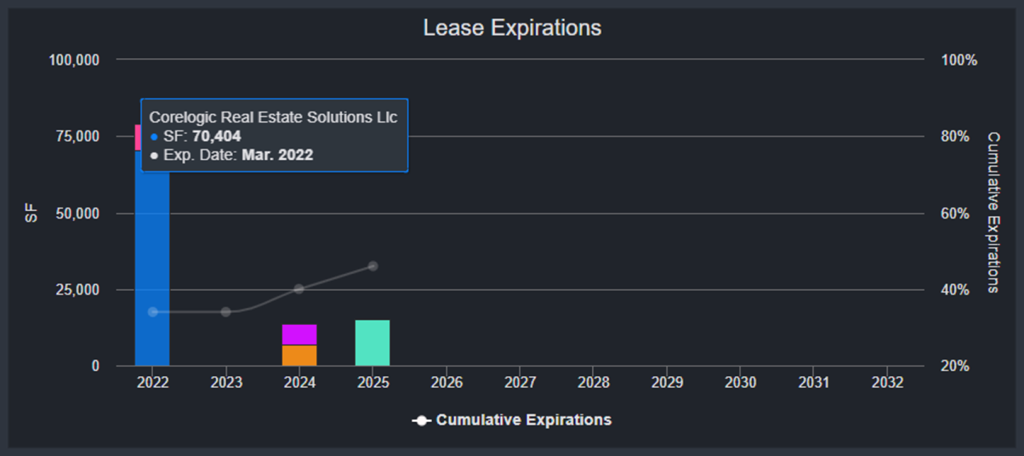
CoreLogic has a 70,404-sf lease expiring on March 31, 2022 at a suburban office building located 10 miles south of Minneapolis, MN. The tenant closed its offices at the building in 2019 and the space has since been dark. CoreLogic was the largest tenant at the property and accounted for 30% of the GLA. Riverview Office Tower is a 15-story Class-B tower located just south of the Minneapolis – Saint Paul International Airport in close proximity to the Mall of America. Occupancy for the property has been consistently low and was most recently reported to be 68% as of June 2021. CRED iQ anticipates economic occupancy declining to 38% following the expiration of CoreLogic’s lease. For the full valuation report and loan-level details, click here.
| Property Name | Riverview Office Tower |
| Address | 8009 34th Avenue South Bloomington, MN 55425 |
| Outstanding Balance | $17,999,960 |
| Interest Rate | 5.07% |
| Maturity Date | 10/1/2023 |
| Most Recent Appraisal | $31,000,000 ($132/sf) |
| Most Recent Appraisal Date | 9/13/2013 |
| CRED iQ Base-Case Value | $15,120,000 ($64/sf) |
CRED iQ is a commercial real estate data, analytics, and valuation platform providing actionable intelligence to CRE and capital markets investors. Subscribers to CRED iQ use the platform to identify valuable leads for leasing, lending, refinancing, distressed debt, and acquisition opportunities. For full access to our loan database and valuation platform, sign up for a free trial below: