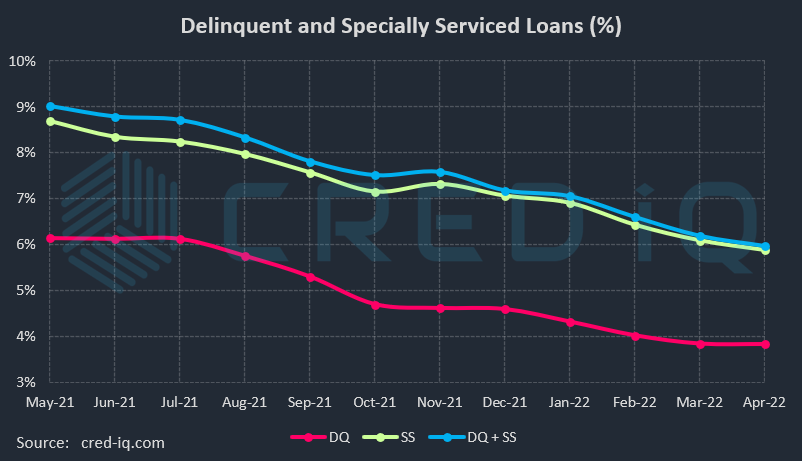
SS = All specially serviced CMBS loans in the conduit and SASB universe, including current, delinquent and REO
DQ + SS = All distressed CMBS loans in the conduit and SASB universe that are delinquent, specially serviced, or a combination of both
The CRED iQ overall delinquency rate for CMBS showed nominal movement during the April 2022 remittance period but still tallied a decline for the 23rd consecutive month. The delinquency rate, equal to the percentage of all delinquent specially serviced loans and delinquent non-specially serviced loans, for CRED iQ’s sample universe of $500+ billion in CMBS conduit and single asset single-borrower (SASB) loans was 3.83%, which compares to the prior month’s rate of 3.84%. CRED iQ’s special servicing rate, equal to the percentage of CMBS loans that are with the special servicer (delinquent and non-delinquent), declined month-over month to 5.88% from 6.09%. The special servicing rate is now approximately 45% lower than its pandemic-era peak of 10.79% in October 2020. Aggregating the two indicators of distress – delinquency rate and special servicing rate – into an overall distressed rate (DQ + SS%) equals 5.97% of CMBS loans that are specially serviced, delinquent, or a combination of both. The overall distressed rate declined compared to the prior month rate of 6.19%. The overall distressed rates typically track slightly higher than special servicing rates as most delinquent loans are also with the special servicer.
SS = All specially serviced CMBS loans in the conduit and SASB universe, including current, delinquent and REO
DQ + SS = All distressed CMBS loans in the conduit and SASB universe that are delinquent, specially serviced, or a combination of both
The individual delinquency rate for the retail sector spiked higher this month to 7.34%, compared to 7.06% as of March 2022. The sharp increase can be attributed partially to a reversion to delinquent payments from the $125 million Westfield Palm Desert loan, which is secured by a regional mall in California. The loan was marked as current in payment during previous months but became 30 days delinquent as of April 2022. Westfield Palm Desert transferred to special servicing in August 2020 and was delinquent for nearly all of 2021. Notably, the loan sponsor, Unibail-Rodamco-Westfield, was featured in the news in early-April 2022 for providing an update on its planned divestiture of U.S.-based regional malls.
The delinquency rate for lodging properties continued to show meaningful and consistent improvement. For a second consecutive month, the outstanding balance of delinquent lodging loans declined by more than $450 million. The lodging delinquency rate was 7.55% this month, which compared to 7.99% last month. One of the largest delinquency cures this month was the $135.1 million Marriott LAX loan, which is secured by a 1,004-room hotel adjacent to the Los Angeles International Airport. The loan was modified in February 2022 and terms of the agreement brought the loan current in payment. The loan transferred to special servicing in December 2020 and had been delinquent in payment until the closing of the modification agreement.
Changes in special servicing rates by individual property type were a mixed bag this month. The special servicing rate for lodging declined by approximately 15% this month. A large component of the shift was caused by the $982 million loan secured by the Ashford Hospitality Trust Portfolio. The loan transferred to special servicing in June 2020. The loan returned to the master servicer this month after furniture, fixture, and equipment (FF&E) reserves were replenished from being used to pay debt service during a forbearance period.
Special servicing rates for retail (11.21%) and office (3.73%) both increased compared to the prior month. The increase in the office special servicing rate was anticipated given last month’s revelation of Blackstone’s intentions to hand 1740 Broadway back to the lender. The increase in the special servicing rate for retail was driven by Destiny USA – a 2.1 million-sf regional mall in Syracuse, NY that is owned by Pyramid Management Group. The distressed shopping center secures a $430 million loan that is securitized in the JPMCC 2014-DSTY CMBS transaction. The loan transferred to special servicing due to imminent default ahead of the loan’s June 2022 maturity date. The loan had previously transferred to special servicing in April 2020 and returned to the master servicer in March 2021 after a loan modification. Another one of Pyramid’s properties, Walden Galleria, was a major driver behind increases in retail distress last month.
CRED iQ’s overall CMBS distressed rate (DQ + SS%) by property type accounts for loans that qualify for either delinquent or special servicing subsets. This month, overall distressed rates for retail, office, industrial, and self storage increased while lodging and multifamily exhibited declines in overall distress. Two of the largest loans added to the distressed category this month, both via transfers to special servicing, were the aforementioned 1740 Broadway and Destiny USA. For additional information about these two loans, click View Details below:
| [View Details] | [View Details] | |
| Loan | Destiny USA | 1740 Broadway |
| Balance | $430,000,000 | $308,000,000 |
| Special Servicer Transfer Date | 4/4/2022 | 3/18/2022 |
About CRED iQ
CRED iQ is a commercial real estate data, analytics, and valuation platform providing actionable intelligence to CRE and capital markets investors. Subscribers to CRED iQ use the platform to identify valuable leads for leasing, lending, refinancing, distressed debt, and acquisition opportunities. Our data platform is powered by over $2.0 trillion of CMBS, CRE CLO, SBLL, and GSE Agency loan and property data.