
CRED iQ monitors distressed rates and market performance for nearly 400 MSAs across the United States, covering over $900 billion in outstanding commercial real estate (CRE) debt. Distressed rates (DQ + SS%) include loans that are specially serviced, delinquent, or a combination of both. Distressed rates and month-over-month changes for the month of July 2022 are presented below for the 50 largest MSAs, broken out by property type for a granular view of distress by market-sector.
Of the 50 largest MSAs tracked by CRED iQ, there were 33 with month-over-month increases in the percentage of distressed CRE loans within the CMBS universe. This is a reversal from trends over the past several months when the majority of Top 50 MSAs exhibited consecutive delinquency improvements. Despite the comparatively high number of markets with increases in distressed rates this month, the scale of those increases was relatively modest. The Baltimore MSA (+1.38%) had the highest month-over-month increase. New Orleans (+1.12%) was the only other market to exhibit an increase in distress greater than 1% in July 2022.
Exploring market delinquencies by property type, the Healthcare sector for Kansas City, MO exhibited the highest increase in distress by market-sector with a +10.4% change compared to June 2022. The increase was led by a $21.2 million floating-rate loan secured by The Atriums, a 207-unit assisted living facility. The loan defaulted at maturity on July 1, 2022 and subsequently transferred to special servicing. Additionally, a $25 million loan, secured by two properties in Metairie, LA — Independence Plaza and 3530 Houma Boulevard — became 30 days delinquent in July and contributed to elevated increases in distress in the New Orleans – Mixed Use and Office sectors.
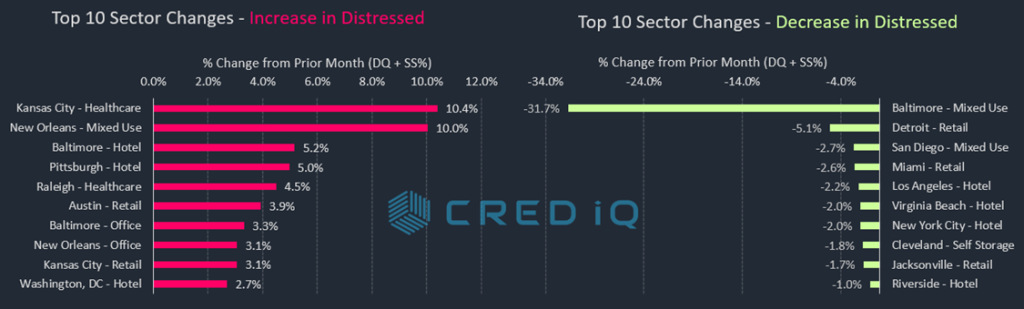
Of the largest decreases in distress, the Baltimore – Mixed Use market-sector exhibited the most significant change, which was driven by the resolution of the $67.8 million Gallery at Harborplace loan. The loan failed to pay off at maturity in May 2022, when it contributed to a spike in distress for the Baltimore market. However, the loan appears to have been paid off in full during the July 2022 reporting period, alleviating the temporary increase in distress. Additionally, the $22.6 million Gatlin Retail Portfolio loan returned to the master servicer this month, which corresponded to decreases in distress for two retail markets – Detroit and Jacksonville.
The Minneapolis MSA has the highest overall distressed rate at 20.9%, which was an Market Delinquency Tracker August 2022 increase compared to the prior month distressed rate of 20.1%. Milwaukee (10.0%), Hartford, CT (9.2%), Cleveland (7.6%), and Chicago (5.7%) comprise the next four markets with the highest rates of distress. Louisville dropped out of the Top 5 distressed markets this month after it was supplanted by Chicago. The Sacramento market (0.1%) had the lowest percentage of distress among the Top 50 MSAs for the fourth consecutive month. The Jacksonville (0.3%) market moved into position as the market with the second-lowest percentage of distress.
For the full CRED DQ Report, download here:
| MSA – Property Type | DQ/SS (millions) | DS/SS (%) | Monthly Change |
| Allentown-Bethlehem-Easton, PA-NJ MSA | $170.3 | 5.5% | 0.3% |
| Allentown – Hotel | $16.2 | 53.8% | 0.0% |
| Allentown – Industrial | $64.9 | 4.3% | 0.0% |
| Allentown – Multifamily | $34.9 | 5.6% | 0.0% |
| Allentown – Office | $06.7 | 2.4% | 3.1% |
| Allentown – Other | $0.0 | 0.0% | 0.0% |
| Allentown – Retail | $32.5 | 8.5% | -0.2% |
| Allentown – Self Storage | $15.1 | 17.1% | 0.0% |
| Atlanta – Atlanta-Sandy Springs-Marietta, GA MSA | $3,056.9 | 11.2% | 0.4% |
| Atlanta – Hotel | $916.9 | 46.5% | 0.6% |
| Atlanta – Industrial | $275.6 | 19.7% | -1.2% |
| Atlanta – Multifamily | $801.7 | 5.3% | 0.0% |
| Atlanta – Office | $359.4 | 16.6% | 0.0% |
| Atlanta – Other | $378.2 | 8.8% | 0.0% |
| Atlanta – Retail | $295.7 | 13.8% | 3.6% |
| Atlanta – Self Storage | $29.4 | 9.1% | 0.0% |
| Austin – Austin-Round Rock, TX MSA | $1,330.1 | 14.3% | 0.5% |
| Austin – Hotel | $237.7 | 31.4% | -0.5% |
| Austin – Industrial | $125.1 | 65.3% | 0.0% |
| Austin – Multifamily | $582.2 | 9.3% | 0.1% |
| Austin – Office | $96.2 | 12.9% | 0.1% |
| Austin – Other | $172.0 | 40.1% | 0.6% |
| Austin – Retail | $106.4 | 12.4% | 3.9% |
| Austin – Self Storage | $10.4 | 14.3% | 0.0% |
| Baltimore – Baltimore-Towson, MD MSA | $1,088.8 | 13.0% | 1.4% |
| Baltimore – Hotel | $170.6 | 41.6% | 5.2% |
| Baltimore – Industrial | $54.0 | 23.1% | 0.0% |
| Baltimore – Multifamily | $339.3 | 5.9% | 0.8% |
| Baltimore – Office | $119.3 | 22.2% | 3.3% |
| Baltimore – Other | $117.8 | 43.2% | -31.7% |
| Baltimore – Retail | $276.8 | 27.4% | 10.7% |
| Baltimore – Self Storage | $11.1 | 10.1% | 0.0% |
| Birmingham – Birmingham-Hoover, AL MSA | $640.6 | 23.5% | 0.8% |
| Birmingham – Hotel | $41.1 | 40.8% | 0.0% |
| Birmingham – Industrial | $265.7 | 87.9% | 0.0% |
| Birmingham – Multifamily | $77.9 | 7.7% | 0.0% |
| Birmingham – Office | $47.8 | 9.7% | 0.7% |
| Birmingham – Other | $03.1 | 16.5% | 0.0% |
| Birmingham – Retail | $200.0 | 28.1% | 0.0% |
| Birmingham – Self Storage | $05.0 | 6.1% | -1.0% |
| Boston – Boston-Cambridge-Quincy, MA-NH MSA | $1,559.3 | 9.8% | 0.1% |
| Boston – Hotel | $367.6 | 22.8% | 0.1% |
| Boston – Industrial | $105.0 | 32.7% | 0.0% |
| Boston – Multifamily | $475.8 | 10.2% | 0.0% |
| Boston – Office | $258.3 | 5.9% | 0.0% |
| Boston – Other | $197.2 | 6.2% | 0.0% |
| Boston – Retail | $119.0 | 7.4% | 0.8% |
| Boston – Self Storage | $36.3 | 21.4% | 0.0% |
| Bridgeport – Bridgeport-Stamford-Norwalk, CT MSA | $1,002.4 | 25.7% | 0.5% |
| Bridgeport – Hotel | $08.0 | 8.9% | 9.5% |
| Bridgeport – Industrial | $14.3 | 14.1% | 0.0% |
| Bridgeport – Multifamily | $95.7 | 4.8% | 0.0% |
| Bridgeport – Office | $468.9 | 46.4% | 0.4% |
| Bridgeport – Other | $191.6 | 53.6% | 0.3% |
| Bridgeport – Retail | $215.5 | 77.2% | 0.0% |
| Bridgeport – Self Storage | $08.6 | 15.2% | 0.0% |
| Charlotte – Charlotte-Gastonia-Concord, NC-SC MSA | $1,455.5 | 18.8% | -1.0% |
| Charlotte – Hotel | $472.1 | 52.4% | 0.0% |
| Charlotte – Industrial | $68.7 | 24.1% | 0.0% |
| Charlotte – Multifamily | $226.6 | 5.2% | 0.0% |
| Charlotte – Office | $387.0 | 42.5% | -3.1% |
| Charlotte – Other | $19.7 | 8.0% | 4.3% |
| Charlotte – Retail | $276.7 | 27.4% | -9.0% |
| Charlotte – Self Storage | $04.7 | 10.1% | 0.0% |
| Chicago – Chicago-Naperville-Joliet, IL-IN-WI MSA | $5,288.7 | 17.9% | -0.6% |
| Chicago – Hotel | $822.1 | 28.3% | 1.6% |
| Chicago – Industrial | $366.1 | 10.0% | 0.0% |
| Chicago – Multifamily | $1,118.0 | 11.8% | -0.3% |
| Chicago – Office | $1,452.7 | 18.6% | -1.3% |
| Chicago – Other | $662.0 | 25.7% | -0.3% |
| Chicago – Retail | $758.2 | 26.9% | -4.2% |
| Chicago – Self Storage | $109.7 | 33.8% | 0.0% |
| Cincinnati – Cincinnati-Middletown, OH-KY-IN MSA | $577.3 | 15.7% | 0.5% |
| Cincinnati – Hotel | $84.1 | 34.6% | 7.2% |
| Cincinnati – Industrial | $32.1 | 13.1% | 0.0% |
| Cincinnati – Multifamily | $100.7 | 5.4% | 0.0% |
| Cincinnati – Office | $220.9 | 44.8% | 0.0% |
| Cincinnati – Other | $78.4 | 28.7% | 0.4% |
| Cincinnati – Retail | $60.3 | 11.6% | 0.3% |
| Cincinnati – Self Storage | $0.8 | 1.5% | 0.0% |
| Cleveland – Cleveland-Elyria-Mentor, OH MSA | $821.0 | 20.7% | -0.8% |
| Cleveland – Hotel | $74.4 | 45.3% | -3.5% |
| Cleveland – Industrial | $33.9 | 19.9% | 0.0% |
| Cleveland – Multifamily | $144.4 | 8.7% | 0.0% |
| Cleveland – Office | $63.7 | 7.7% | -4.9% |
| Cleveland – Other | $195.6 | 48.2% | 1.1% |
| Cleveland – Retail | $307.2 | 43.8% | 0.1% |
| Cleveland – Self Storage | $01.7 | 3.9% | -1.8% |
| Columbus, OH – Columbus, OH MSA | $564.2 | 7.9% | 0.4% |
| Columbus, OH – Hotel | $101.9 | 33.9% | 2.1% |
| Columbus, OH – Industrial | $13.3 | 3.4% | -0.1% |
| Columbus, OH – Multifamily | $219.4 | 4.6% | 0.0% |
| Columbus, OH – Office | $21.8 | 3.4% | 1.2% |
| Columbus, OH – Other | $36.3 | 12.8% | 0.0% |
| Columbus, OH – Retail | $158.3 | 21.5% | -1.4% |
| Columbus, OH – Self Storage | $13.4 | 47.8% | 0.0% |
| Dallas – Dallas-Fort Worth-Arlington, TX MSA | $4,648.8 | 13.9% | 0.0% |
| Dallas – Hotel | $1,414.8 | 43.2% | -0.1% |
| Dallas – Industrial | $226.4 | 16.7% | 0.0% |
| Dallas – Multifamily | $1,533.3 | 7.2% | 0.0% |
| Dallas – Office | $735.6 | 23.4% | 0.4% |
| Dallas – Other | $194.8 | 10.0% | 0.1% |
| Dallas – Retail | $466.2 | 22.3% | -0.8% |
| Dallas – Self Storage | $72.4 | 19.8% | 0.0% |
| Denver – Denver-Aurora, CO MSA | $2,195.9 | 13.6% | 0.2% |
| Denver – Hotel | $493.7 | 62.9% | 0.1% |
| Denver – Industrial | $36.7 | 6.7% | 0.0% |
| Denver – Multifamily | $478.6 | 4.6% | 0.0% |
| Denver – Office | $350.7 | 17.0% | -0.1% |
| Denver – Other | $101.0 | 10.5% | 0.3% |
| Denver – Retail | $720.4 | 54.0% | 0.0% |
| Denver – Self Storage | $14.8 | 8.0% | 0.0% |
| Detroit – Detroit-Warren-Livonia, MI MSA | $1,261.2 | 14.3% | -0.8% |
| Detroit – Hotel | $395.3 | 60.5% | -0.8% |
| Detroit – Industrial | $117.6 | 20.7% | 0.0% |
| Detroit – Multifamily | $242.0 | 6.8% | -0.2% |
| Detroit – Office | $248.7 | 15.1% | 0.0% |
| Detroit – Other | $92.1 | 11.8% | 0.6% |
| Detroit – Retail | $132.6 | 10.2% | -5.1% |
| Detroit – Self Storage | $32.9 | 11.1% | 0.0% |
| Hartford – Hartford-West Hartford-East Hartford, CT MSA | $355.9 | 14.6% | -2.5% |
| Hartford – Hotel | $29.3 | 24.7% | 6.2% |
| Hartford – Industrial | $08.4 | 18.2% | 0.0% |
| Hartford – Multifamily | $62.8 | 3.9% | 0.0% |
| Hartford – Office | $199.0 | 71.7% | -30.4% |
| Hartford – Other | $14.9 | 17.1% | 0.0% |
| Hartford – Retail | $34.2 | 11.8% | 7.8% |
| Hartford – Self Storage | $07.4 | 32.8% | 0.0% |
| Houston – Houston-Sugar Land-Baytown, TX MSA | $3,662.4 | 15.5% | 0.6% |
| Houston – Hotel | $329.5 | 31.6% | 2.0% |
| Houston – Industrial | $149.9 | 24.7% | -0.8% |
| Houston – Multifamily | $1,232.3 | 8.8% | 0.1% |
| Houston – Office | $967.0 | 29.6% | 1.2% |
| Houston – Other | $233.5 | 33.7% | 2.3% |
| Houston – Retail | $693.1 | 18.4% | 0.1% |
| Houston – Self Storage | $57.0 | 18.7% | 0.0% |
| Indianapolis – Indianapolis-Carmel, IN MSA | $864.3 | 16.4% | 0.0% |
| Indianapolis – Hotel | $232.6 | 40.0% | 1.0% |
| Indianapolis – Industrial | $47.8 | 7.7% | 0.0% |
| Indianapolis – Multifamily | $286.2 | 10.3% | -0.3% |
| Indianapolis – Office | $166.2 | 27.1% | -0.4% |
| Indianapolis – Other | $41.7 | 14.8% | -0.2% |
| Indianapolis – Retail | $72.5 | 21.7% | 0.0% |
| Indianapolis – Self Storage | $17.3 | 25.4% | 0.0% |
| Jacksonville – Jacksonville, FL MSA | $544.5 | 9.9% | -0.1% |
| Jacksonville – Hotel | $115.9 | 30.6% | 0.3% |
| Jacksonville – Industrial | $04.8 | 2.4% | 0.0% |
| Jacksonville – Multifamily | $198.8 | 5.3% | 0.0% |
| Jacksonville – Office | $59.2 | 11.3% | 0.0% |
| Jacksonville – Other | $36.5 | 18.0% | 0.0% |
| Jacksonville – Retail | $119.9 | 31.0% | -1.7% |
| Jacksonville – Self Storage | $09.4 | 13.3% | 0.0% |
| Kansas City – Kansas City, MO-KS MSA | $1,126.9 | 20.3% | 0.6% |
| Kansas City – Hotel | $172.2 | 60.7% | 1.3% |
| Kansas City – Industrial | $0.0 | 0.0% | 0.0% |
| Kansas City – Multifamily | $266.9 | 9.6% | -0.4% |
| Kansas City – Office | $288.8 | 27.2% | 0.0% |
| Kansas City – Other | $40.5 | 19.8% | 10.4% |
| Kansas City – Retail | $201.5 | 34.1% | 3.1% |
| Kansas City – Self Storage | $157.0 | 81.0% | 0.0% |
| Las Vegas – Las Vegas-Paradise, NV MSA | $2,153.0 | 10.4% | 0.1% |
| Las Vegas – Hotel | $998.8 | 13.2% | 0.0% |
| Las Vegas – Industrial | $49.0 | 11.7% | 0.0% |
| Las Vegas – Multifamily | $140.3 | 2.1% | 0.0% |
| Las Vegas – Office | $63.5 | 8.3% | 0.0% |
| Las Vegas – Other | $113.5 | 14.1% | 0.0% |
| Las Vegas – Retail | $776.1 | 18.0% | 0.3% |
| Las Vegas – Self Storage | $11.7 | 5.9% | 0.0% |
| Los Angeles – Los Angeles-Long Beach-Santa Ana, CA MSA | $7,897.5 | 15.1% | -0.2% |
| Los Angeles – Hotel | $1,935.0 | 30.0% | -2.2% |
| Los Angeles – Industrial | $224.3 | 6.0% | 0.0% |
| Los Angeles – Multifamily | $1,404.6 | 6.7% | 0.0% |
| Los Angeles – Office | $1,936.7 | 18.1% | 0.1% |
| Los Angeles – Other | $760.8 | 24.7% | 1.1% |
| Los Angeles – Retail | $1,565.2 | 23.9% | -0.5% |
| Los Angeles – Self Storage | $70.9 | 8.1% | 0.0% |
| Louisville – Louisville/Jefferson County, KY-IN MSA | $381.1 | 14.5% | -2.8% |
| Louisville – Hotel | $112.0 | 73.9% | 0.0% |
| Louisville – Industrial | $07.8 | 3.7% | 0.0% |
| Louisville – Multifamily | $102.9 | 7.1% | -0.2% |
| Louisville – Office | $31.7 | 10.9% | 0.0% |
| Louisville – Other | $27.6 | 36.4% | 0.0% |
| Louisville – Retail | $82.6 | 19.3% | -16.5% |
| Louisville – Self Storage | $16.3 | 41.5% | 0.0% |
| Memphis – Memphis, TN-AR-MS MSA | $429.4 | 18.2% | 0.6% |
| Memphis – Hotel | $78.3 | 41.3% | 1.5% |
| Memphis – Industrial | $58.2 | 27.5% | 0.0% |
| Memphis – Multifamily | $44.5 | 3.7% | 0.0% |
| Memphis – Office | $35.2 | 14.4% | 0.0% |
| Memphis – Other | $02.2 | 6.5% | 16.0% |
| Memphis – Retail | $166.7 | 51.2% | 1.1% |
| Memphis – Self Storage | $44.2 | 28.4% | 0.0% |
| Miami – Miami-Fort Lauderdale-Pompano Beach, FL MSA | $2,937.9 | 11.4% | -0.6% |
| Miami – Hotel | $1,061.6 | 21.0% | -0.6% |
| Miami – Industrial | $18.5 | 4.5% | 0.0% |
| Miami – Multifamily | $349.4 | 3.3% | -0.3% |
| Miami – Office | $405.5 | 15.9% | 0.0% |
| Miami – Other | $264.8 | 15.0% | 0.0% |
| Miami – Retail | $786.3 | 15.8% | -2.6% |
| Miami – Self Storage | $51.8 | 9.4% | 0.0% |
| Milwaukee – Milwaukee-Waukesha-West Allis, WI MSA | $383.1 | 15.2% | -0.1% |
| Milwaukee – Hotel | $46.1 | 33.1% | 0.1% |
| Milwaukee – Industrial | $26.4 | 9.0% | 0.0% |
| Milwaukee – Multifamily | $55.1 | 5.9% | 0.0% |
| Milwaukee – Office | $91.9 | 17.2% | 0.1% |
| Milwaukee – Other | $67.6 | 52.6% | 0.0% |
| Milwaukee – Retail | $94.4 | 20.0% | -2.0% |
| Milwaukee – Self Storage | $01.6 | 11.9% | 0.0% |
| Minneapolis – Minneapolis-St. Paul-Bloomington, MN-WI MSA | $1,227.9 | 14.5% | 0.8% |
| Minneapolis – Hotel | $208.7 | 32.5% | -0.5% |
| Minneapolis – Industrial | $37.3 | 9.2% | 0.0% |
| Minneapolis – Multifamily | $269.0 | 9.5% | 0.0% |
| Minneapolis – Office | $332.0 | 15.0% | 0.3% |
| Minneapolis – Other | $229.5 | 45.6% | 0.0% |
| Minneapolis – Retail | $99.8 | 5.5% | 2.6% |
| Minneapolis – Self Storage | $51.6 | 73.2% | 0.0% |
| Nashville – Nashville-Davidson-Murfreesboro-Franklin, TN MSA | $1,093.2 | 18.0% | 0.2% |
| Nashville – Hotel | $428.0 | 31.8% | 0.2% |
| Nashville – Industrial | $101.2 | 33.6% | 0.0% |
| Nashville – Multifamily | $240.9 | 7.8% | 0.0% |
| Nashville – Office | $170.1 | 35.5% | 0.0% |
| Nashville – Other | $19.8 | 50.8% | 0.0% |
| Nashville – Retail | $128.0 | 17.3% | 0.0% |
| Nashville – Self Storage | $05.1 | 5.6% | 0.0% |
| New Orleans – New Orleans-Metairie-Kenner, LA MSA | $1,263.0 | 37.8% | 1.1% |
| New Orleans – Hotel | $720.2 | 73.9% | 0.3% |
| New Orleans – Industrial | $0.5 | 1.3% | 0.0% |
| New Orleans – Multifamily | $192.3 | 21.8% | 0.0% |
| New Orleans – Office | $105.1 | 19.8% | 3.1% |
| New Orleans – Other | $28.2 | 19.0% | 10.0% |
| New Orleans – Retail | $203.3 | 30.6% | 0.1% |
| New Orleans – Self Storage | $13.4 | 12.7% | 0.0% |
| New York City – New York-Northern New Jersey-Long Island, NY-NJ-PA MSA | $20,821.1 | 16.2% | -0.1% |
| New York City – Hotel | $1,310.5 | 38.6% | -2.0% |
| New York City – Industrial | $239.2 | 5.9% | -0.3% |
| New York City – Multifamily | $6,877.0 | 19.8% | -0.1% |
| New York City – Office | $4,717.7 | 10.0% | -0.3% |
| New York City – Other | $4,599.3 | 19.2% | -0.3% |
| New York City – Retail | $2,797.0 | 22.8% | 0.5% |
| New York City – Self Storage | $280.4 | 8.9% | 0.0% |
| Orlando – Orlando-Kissimmee, FL MSA | $2,392.5 | 22.6% | 0.3% |
| Orlando – Hotel | $1,900.2 | 67.2% | 0.2% |
| Orlando – Industrial | $04.5 | 2.6% | 0.0% |
| Orlando – Multifamily | $137.3 | 2.4% | 0.0% |
| Orlando – Office | $68.2 | 14.9% | 0.3% |
| Orlando – Other | $54.6 | 12.6% | 0.0% |
| Orlando – Retail | $192.7 | 20.4% | 1.0% |
| Orlando – Self Storage | $35.1 | 31.5% | 0.0% |
| Philadelphia – Philadelphia-Camden-Wilmington, PA-NJ-DE-MD MSA | $2,617.8 | 12.9% | 0.2% |
| Philadelphia – Hotel | $467.0 | 59.1% | 1.1% |
| Philadelphia – Industrial | $61.8 | 2.1% | 0.0% |
| Philadelphia – Multifamily | $471.7 | 5.1% | 0.1% |
| Philadelphia – Office | $481.7 | 13.6% | 1.4% |
| Philadelphia – Other | $570.6 | 43.8% | 0.1% |
| Philadelphia – Retail | $484.3 | 22.8% | 0.1% |
| Philadelphia – Self Storage | $80.6 | 23.3% | 0.0% |
| Phoenix – Phoenix-Mesa-Scottsdale, AZ MSA | $1,334.1 | 6.9% | -0.1% |
| Phoenix – Hotel | $509.8 | 34.2% | 0.2% |
| Phoenix – Industrial | $75.6 | 5.1% | 0.0% |
| Phoenix – Multifamily | $279.1 | 2.5% | 0.0% |
| Phoenix – Office | $172.5 | 7.6% | 0.0% |
| Phoenix – Other | $124.1 | 15.5% | 0.0% |
| Phoenix – Retail | $152.6 | 9.2% | -1.6% |
| Phoenix – Self Storage | $20.6 | 6.1% | 0.0% |
| Pittsburgh – Pittsburgh, PA MSA | $789.3 | 16.8% | -0.2% |
| Pittsburgh – Hotel | $120.5 | 75.1% | 5.0% |
| Pittsburgh – Industrial | $38.7 | 32.3% | 0.0% |
| Pittsburgh – Multifamily | $159.1 | 7.2% | 0.0% |
| Pittsburgh – Office | $140.1 | 12.9% | -1.3% |
| Pittsburgh – Other | $179.0 | 46.0% | -1.9% |
| Pittsburgh – Retail | $151.7 | 24.8% | 0.0% |
| Pittsburgh – Self Storage | $0.3 | 0.2% | 0.0% |
| Portland – Portland-Vancouver-Beaverton, OR-WA MSA | $1,118.9 | 16.0% | 0.4% |
| Portland – Hotel | $320.7 | 37.4% | 0.7% |
| Portland – Industrial | $108.9 | 36.8% | 0.0% |
| Portland – Multifamily | $237.1 | 5.4% | -0.2% |
| Portland – Office | $70.0 | 17.5% | 0.1% |
| Portland – Other | $335.6 | 67.6% | 0.0% |
| Portland – Retail | $36.2 | 7.3% | 0.0% |
| Portland – Self Storage | $10.4 | 18.1% | 0.0% |
| Raleigh – Raleigh-Cary, NC MSA | $437.1 | 11.4% | 0.2% |
| Raleigh – Hotel | $101.2 | 55.7% | 2.3% |
| Raleigh – Industrial | $37.1 | 31.6% | 0.0% |
| Raleigh – Multifamily | $192.7 | 7.3% | 0.0% |
| Raleigh – Office | $72.6 | 15.1% | 0.0% |
| Raleigh – Other | $0.0 | 0.0% | 4.5% |
| Raleigh – Retail | $31.3 | 12.9% | 0.0% |
| Raleigh – Self Storage | $02.3 | 4.8% | 0.0% |
| Richmond – Richmond, VA MSA | $567.7 | 17.1% | 0.2% |
| Richmond – Hotel | $102.9 | 40.9% | 0.0% |
| Richmond – Industrial | $15.5 | 8.9% | 0.0% |
| Richmond – Multifamily | $31.4 | 2.0% | 0.0% |
| Richmond – Office | $201.2 | 29.8% | 0.0% |
| Richmond – Other | $0.0 | 0.0% | 0.0% |
| Richmond – Retail | $179.7 | 38.3% | 0.8% |
| Richmond – Self Storage | $36.9 | 67.9% | 0.0% |
| Riverside – Riverside-San Bernardino-Ontario, CA MSA | $879.5 | 8.6% | 0.2% |
| Riverside – Hotel | $40.4 | 10.2% | -1.0% |
| Riverside – Industrial | $21.3 | 0.9% | 0.0% |
| Riverside – Multifamily | $124.0 | 3.2% | 0.0% |
| Riverside – Office | $112.0 | 17.5% | 0.0% |
| Riverside – Other | $49.7 | 14.5% | 0.0% |
| Riverside – Retail | $500.0 | 24.4% | 0.1% |
| Riverside – Self Storage | $32.0 | 7.2% | 0.0% |
| Sacramento – Sacramento-Arden-Arcade-Roseville, CA MSA | $516.4 | 9.4% | 0.0% |
| Sacramento – Hotel | $198.9 | 63.3% | 0.4% |
| Sacramento – Industrial | $19.8 | 2.8% | 0.0% |
| Sacramento – Multifamily | $82.7 | 3.0% | 0.0% |
| Sacramento – Office | $126.9 | 15.9% | 0.0% |
| Sacramento – Other | $41.7 | 10.7% | 0.0% |
| Sacramento – Retail | $46.4 | 9.9% | 0.0% |
| Sacramento – Self Storage | $0.1 | 0.1% | 0.0% |
| Salt Lake City – Salt Lake City, UT MSA | $420.4 | 10.6% | 0.1% |
| Salt Lake City – Hotel | $86.1 | 36.7% | 2.3% |
| Salt Lake City – Industrial | $33.7 | 18.5% | 0.0% |
| Salt Lake City – Multifamily | $91.6 | 5.0% | 0.0% |
| Salt Lake City – Office | $89.0 | 17.6% | 0.0% |
| Salt Lake City – Other | $113.1 | 20.7% | 0.0% |
| Salt Lake City – Retail | $06.9 | 1.1% | 0.0% |
| Salt Lake City – Self Storage | $0.0 | 0.0% | 0.0% |
| San Antonio – San Antonio, TX MSA | $619.0 | 10.1% | 0.1% |
| San Antonio – Hotel | $141.0 | 55.1% | 0.0% |
| San Antonio – Industrial | $48.4 | 29.2% | 0.0% |
| San Antonio – Multifamily | $270.5 | 6.1% | -0.2% |
| San Antonio – Office | $39.3 | 10.7% | 0.0% |
| San Antonio – Other | $0.0 | 0.0% | 0.0% |
| San Antonio – Retail | $92.6 | 15.6% | 0.3% |
| San Antonio – Self Storage | $27.2 | 17.5% | 0.0% |
| San Diego – San Diego-Carlsbad-San Marcos, CA MSA | $1,479.0 | 12.4% | -0.3% |
| San Diego – Hotel | $656.8 | 35.2% | -0.8% |
| San Diego – Industrial | $28.1 | 5.8% | 0.0% |
| San Diego – Multifamily | $113.7 | 1.8% | -0.1% |
| San Diego – Office | $240.4 | 16.8% | 0.0% |
| San Diego – Other | $187.0 | 29.2% | -2.7% |
| San Diego – Retail | $253.0 | 21.9% | 0.0% |
| San Diego – Self Storage | $0.1 | 0.1% | 0.0% |
| San Francisco – San Francisco-Oakland-Fremont, CA MSA | $5,292.2 | 21.7% | 0.1% |
| San Francisco – Hotel | $1,667.6 | 82.2% | 1.5% |
| San Francisco – Industrial | $44.5 | 6.5% | 0.0% |
| San Francisco – Multifamily | $1,315.6 | 17.7% | 0.0% |
| San Francisco – Office | $1,454.3 | 14.2% | 0.0% |
| San Francisco – Other | $455.8 | 18.3% | 0.0% |
| San Francisco – Retail | $296.2 | 25.6% | -0.5% |
| San Francisco – Self Storage | $58.2 | 15.7% | 0.0% |
| San Jose – San Jose-Sunnyvale-Santa Clara, CA MSA | $2,484.9 | 13.0% | -0.3% |
| San Jose – Hotel | $499.0 | 7.9% | -0.8% |
| San Jose – Industrial | $0.0 | 0.0% | 0.0% |
| San Jose – Multifamily | $266.1 | 7.4% | 0.0% |
| San Jose – Office | $900.1 | 12.1% | 0.0% |
| San Jose – Other | $612.5 | 64.2% | 0.0% |
| San Jose – Retail | $196.3 | 34.0% | 0.0% |
| San Jose – Self Storage | $10.9 | 27.7% | 0.0% |
| Seattle – Seattle-Tacoma-Bellevue, WA MSA | $2,805.4 | 13.3% | 0.0% |
| Seattle – Hotel | $896.4 | 70.0% | 1.2% |
| Seattle – Industrial | $33.5 | 0.7% | 0.0% |
| Seattle – Multifamily | $839.4 | 10.7% | -0.1% |
| Seattle – Office | $469.2 | 11.6% | 0.0% |
| Seattle – Other | $312.8 | 26.4% | 0.0% |
| Seattle – Retail | $233.8 | 15.6% | 0.0% |
| Seattle – Self Storage | $20.2 | 10.5% | 0.0% |
| St. Louis – St. Louis, MO-IL MSA | $782.6 | 19.2% | 0.6% |
| St. Louis – Hotel | $172.1 | 76.9% | 2.8% |
| St. Louis – Industrial | $20.4 | 11.8% | 0.0% |
| St. Louis – Multifamily | $240.0 | 13.9% | -0.2% |
| St. Louis – Office | $27.0 | 5.7% | 0.0% |
| St. Louis – Other | $226.2 | 45.5% | -2.1% |
| St. Louis – Retail | $92.2 | 9.9% | 0.4% |
| St. Louis – Self Storage | $04.7 | 10.2% | 0.0% |
| Tampa – Tampa-St. Petersburg-Clearwater, FL MSA | $895.6 | 9.5% | 0.2% |
| Tampa – Hotel | $229.5 | 34.0% | -0.8% |
| Tampa – Industrial | $30.8 | 16.7% | 0.0% |
| Tampa – Multifamily | $146.6 | 2.2% | 1.3% |
| Tampa – Office | $76.6 | 11.7% | 0.0% |
| Tampa – Other | $109.7 | 27.4% | 0.0% |
| Tampa – Retail | $271.1 | 34.9% | 0.3% |
| Tampa – Self Storage | $31.3 | 18.6% | 0.0% |
| Tucson – Tucson, AZ MSA | $436.9 | 13.2% | 0.7% |
| Tucson – Hotel | $84.5 | 25.2% | 0.0% |
| Tucson – Industrial | $0.0 | 0.0% | 0.0% |
| Tucson – Multifamily | $154.6 | 9.0% | 0.0% |
| Tucson – Office | $10.7 | 18.8% | 0.0% |
| Tucson – Other | $11.6 | 6.3% | 0.0% |
| Tucson – Retail | $175.4 | 21.3% | -0.1% |
| Tucson – Self Storage | $0.0 | 0.0% | 0.0% |
| Virginia Beach – Virginia Beach-Norfolk-Newport News, VA-NC MSA | $484.8 | 10.4% | -1.3% |
| Virginia Beach – Hotel | $79.1 | 18.9% | -2.0% |
| Virginia Beach – Industrial | $25.0 | 8.1% | 0.0% |
| Virginia Beach – Multifamily | $67.1 | 2.6% | 0.0% |
| Virginia Beach – Office | $161.7 | 42.9% | 0.0% |
| Virginia Beach – Other | $52.7 | 34.9% | 0.0% |
| Virginia Beach – Retail | $75.0 | 10.0% | -8.8% |
| Virginia Beach – Self Storage | $24.3 | 30.3% | 0.0% |
| Washington, DC – Washington-Arlington-Alexandria, DC-VA-MD-WV MSA | $3,820.4 | 13.3% | 0.1% |
| Washington, DC – Hotel | $567.2 | 57.6% | 2.7% |
| Washington, DC – Industrial | $39.1 | 6.6% | 0.0% |
| Washington, DC – Multifamily | $973.6 | 6.5% | 0.0% |
| Washington, DC – Office | $1,406.4 | 19.6% | -0.8% |
| Washington, DC – Other | $361.1 | 22.6% | 0.1% |
| Washington, DC – Retail | $438.4 | 13.2% | 0.0% |
| Washington, DC – Self Storage | $34.6 | 15.7% | 0.0% |
| Grand Total | $100,976.6 | 14.5% | 0.0% |
About CRED iQ
CRED iQ is a commercial real estate data, analytics, and valuation platform providing actionable intelligence to CRE and capital markets investors. Subscribers to CRED iQ use the platform to identify valuable leads for leasing, lending, refinancing, distressed debt, and acquisition opportunities. Our data platform is powered by over $2.0 trillion of CMBS, CRE CLO, SBLL, Ginnie Mae, FHA/HUD, and Freddie Mac loan and property data.
