
CRED iQ monitors distressed rates and market performance for nearly 400 MSAs across the United States, covering over $900 billion in outstanding commercial real estate (CRE) debt. Distressed rates (DQ + SS%) include loans that are specially serviced, delinquent, or a combination of both. Distressed rates and month-over-month changes for data reported as of December 2022 are presented below for the 50 largest MSAs, broken out by property type for a granular view of distress by market-sector.
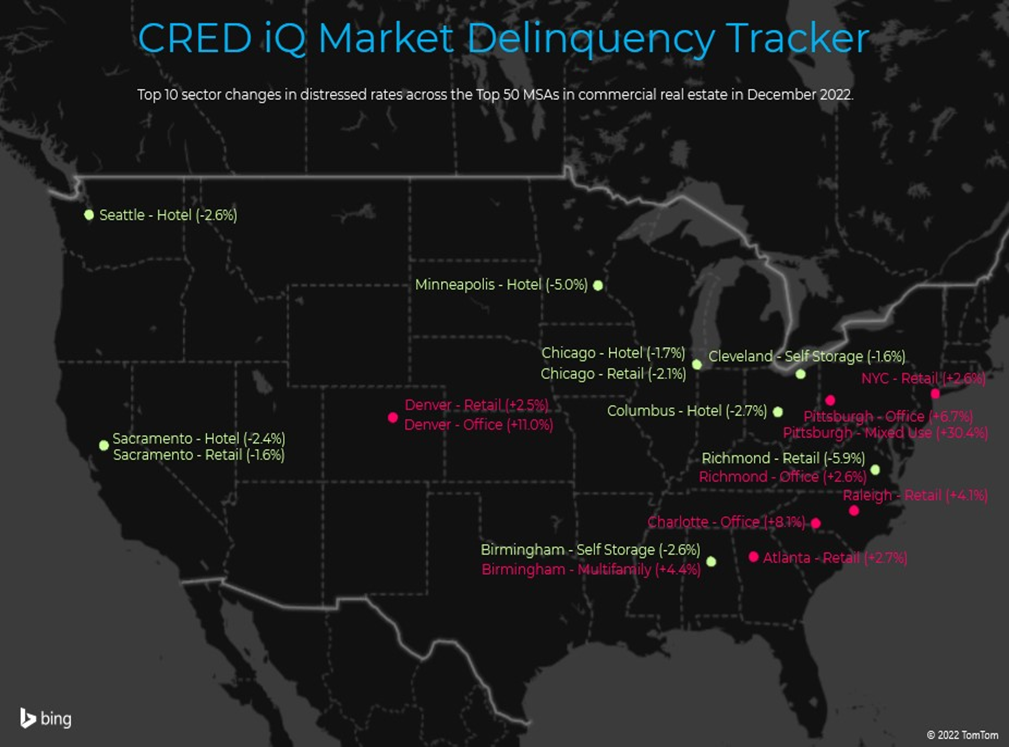
Of the 50 largest MSAs tracked by CRED iQ, half exhibited month-over-month increases in the percentage of distressed CRE loans with an average monthly increase of 0.7%. The other half of the 50 largest MSAs had an average improvement in distress of 0.2%. Notable markets with increased levels of distress this month included Pittsburgh (+4.0%), Birmingham, AL (+2.4%), and Cleveland (+1.9%). The Memphis, TN market (-0.5%) exhibited the sharpest percentage decline in distressed commercial real estate loans during December 2022.
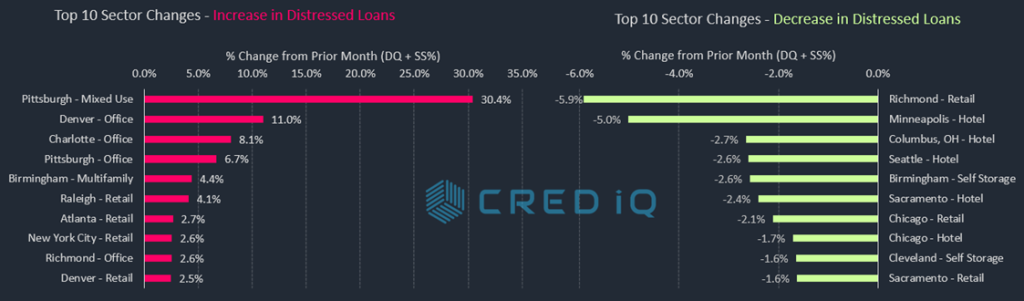
For a more granular analysis of the Top 50 markets, CRED iQ further delineated individual market distressed rates by property type for a comprehensive view by market-sector. The office sector accounted for three of the five-largest month-over-month increases in distress by market-sector. Multiple large-balance office loans transferred to special servicing in December 2022, including a $243.6 million mortgage secured by Republic Plaza in Denver, CO, a $53.9 million mortgage secured by Belk Headquarters in Charlotte, NC, and a $41.7 million mortgage secured by Parkway Center in Pittsburgh, PA. As noted, the Pittsburgh MSA exhibited the highest increase in distress this month among primary markets. Much of the increase in distress can be attributed to a $98.2 million loan secured by a 1.5 million-sf mixed-use (office and retail) building located at 3 Gateway Center. The loan transferred to special servicing in late-November 2022 ahead of its January 2023 maturity date. Imminent maturity default was cited as the reason for distress. The office tower, which has a retail component, has had issues attaining occupancy levels above 80% for several years.
The lodging sector was associated with five of the 10 largest percentage declines in distressed rates across market-sectors during December 2022, including the Chicago hotel market-sector (-1.7%). A $20.7 million loan secured by the IHG-flagged EVEN Hotel Chicago – Tinley Park returned to the master servicer this month after initially transferring to special servicing in October 2021.
The Minneapolis MSA has the highest overall distressed rate at 20.3%, which was in line with previous months. Birmingham (11.0%), Cleveland (10.3%), Hartford (9.0%), and Milwaukee (8.6%) comprise the remaining markets with the highest rates of distress. The Sacramento MSA (0.1%) displaced Jacksonville this month as the market with the lowest percentage of distress among the Top 50 MSAs after favorable workouts in the retail and lodging sectors.
For the full Market DelinQuency Tracker Report, download here:
| MSA – Property Type | DQ/SS (millions) | DS/SS (%) | Monthly Change |
| Allentown-Bethlehem-Easton, PA-NJ MSA | $78.0 | 2.5% | -0.1% |
| Allentown – Hotel | $0.7 | 1.9% | -0.2% |
| Allentown – Industrial | $0.0 | 0.0% | 0.0% |
| Allentown – Multifamily | $0.0 | 0.0% | 0.0% |
| Allentown – Office | $58.3 | 17.9% | -1.2% |
| Allentown – Other | $0.0 | 0.0% | 0.0% |
| Allentown – Retail | $19.0 | 5.1% | 0.0% |
| Allentown – Self Storage | $0.0 | 0.0% | 0.0% |
| Atlanta – Atlanta-Sandy Springs-Marietta, GA MSA | $519.5 | 1.9% | 0.2% |
| Atlanta – Hotel | $82.2 | 3.4% | -0.4% |
| Atlanta – Industrial | $0.0 | 0.0% | 0.0% |
| Atlanta – Multifamily | $0.0 | 0.0% | -0.1% |
| Atlanta – Office | $56.3 | 2.6% | -0.7% |
| Atlanta – Other | $0.0 | 0.0% | 0.0% |
| Atlanta – Retail | $381.1 | 18.8% | 2.7% |
| Atlanta – Self Storage | $0.0 | 0.0% | 0.0% |
| Austin – Austin-Round Rock, TX MSA | $111.5 | 1.2% | -0.4% |
| Austin – Hotel | $58.2 | 6.6% | 0.8% |
| Austin – Industrial | $0.0 | 0.0% | 0.0% |
| Austin – Multifamily | $0.0 | 0.0% | -0.6% |
| Austin – Office | $0.0 | 0.0% | 0.0% |
| Austin – Other | $4.2 | 1.2% | -1.4% |
| Austin – Retail | $49.1 | 6.5% | -0.4% |
| Austin – Self Storage | $0.0 | 0.0% | 0.0% |
| Baltimore – Baltimore-Towson, MD MSA | $356.4 | 3.9% | 0.1% |
| Baltimore – Hotel | $43.9 | 9.4% | -0.5% |
| Baltimore – Industrial | $0.0 | 0.0% | 0.0% |
| Baltimore – Multifamily | $3.8 | 0.1% | 0.0% |
| Baltimore – Office | $46.7 | 5.2% | 0.4% |
| Baltimore – Other | $11.6 | 4.9% | -4.4% |
| Baltimore – Retail | $250.5 | 22.6% | 0.0% |
| Baltimore – Self Storage | $0.0 | 0.0% | 0.0% |
| Birmingham – Birmingham-Hoover, AL MSA | $342.2 | 11.0% | 2.4% |
| Birmingham – Hotel | $0.0 | 0.0% | 0.0% |
| Birmingham – Industrial | $0.0 | 0.0% | 0.0% |
| Birmingham – Multifamily | $63.2 | 4.5% | 4.4% |
| Birmingham – Office | $94.7 | 18.3% | -0.7% |
| Birmingham – Other | $0.0 | 0.0% | 0.0% |
| Birmingham – Retail | $184.4 | 25.7% | -0.2% |
| Birmingham – Self Storage | $0.0 | 0.0% | -2.6% |
| Boston – Boston-Cambridge-Quincy, MA-NH MSA | $123.3 | 0.6% | -0.1% |
| Boston – Hotel | $19.3 | 1.2% | -0.5% |
| Boston – Industrial | $0.0 | 0.0% | 0.0% |
| Boston – Multifamily | $0.0 | 0.0% | 0.0% |
| Boston – Office | $14.5 | 0.2% | 0.0% |
| Boston – Other | $0.0 | 0.0% | 0.0% |
| Boston – Retail | $89.5 | 5.5% | -0.2% |
| Boston – Self Storage | $0.0 | 0.0% | 0.0% |
| Bridgeport – Bridgeport-Stamford-Norwalk, CT MSA | $198.9 | 5.0% | 0.4% |
| Bridgeport – Hotel | $38.6 | 29.9% | -1.1% |
| Bridgeport – Industrial | $0.0 | 0.0% | 0.0% |
| Bridgeport – Multifamily | $0.0 | 0.0% | 0.0% |
| Bridgeport – Office | $150.5 | 14.0% | 1.1% |
| Bridgeport – Other | $9.8 | 2.5% | -0.1% |
| Bridgeport – Retail | $0.0 | 0.0% | 0.0% |
| Bridgeport – Self Storage | $0.0 | 0.0% | 0.0% |
| Charlotte – Charlotte-Gastonia-Concord, NC-SC MSA | $279.1 | 3.7% | 0.7% |
| Charlotte – Hotel | $35.4 | 4.3% | -1.2% |
| Charlotte – Industrial | $0.0 | 0.0% | 0.0% |
| Charlotte – Multifamily | $0.0 | 0.0% | 0.0% |
| Charlotte – Office | $75.3 | 8.1% | 8.1% |
| Charlotte – Other | $85.0 | 31.4% | -5.7% |
| Charlotte – Retail | $83.5 | 10.2% | 0.8% |
| Charlotte – Self Storage | $0.0 | 0.0% | 0.0% |
| Chicago – Chicago-Naperville-Joliet, IL-IN-WI MSA | $2,187.6 | 7.3% | -0.2% |
| Chicago – Hotel | $748.4 | 30.8% | -1.7% |
| Chicago – Industrial | $0.0 | 0.0% | 0.0% |
| Chicago – Multifamily | $52.9 | 0.5% | 0.0% |
| Chicago – Office | $962.1 | 11.4% | 0.4% |
| Chicago – Other | $208.6 | 8.2% | 0.0% |
| Chicago – Retail | $215.7 | 7.0% | -2.1% |
| Chicago – Self Storage | $0.0 | 0.0% | 0.0% |
| Cincinnati – Cincinnati-Middletown, OH-KY-IN MSA | $137.6 | 3.6% | 0.7% |
| Cincinnati – Hotel | $87.1 | 30.0% | 0.5% |
| Cincinnati – Industrial | $0.0 | 0.0% | 0.0% |
| Cincinnati – Multifamily | $0.0 | 0.0% | -0.1% |
| Cincinnati – Office | $0.0 | 0.0% | 0.0% |
| Cincinnati – Other | $6.8 | 2.6% | 0.0% |
| Cincinnati – Retail | $43.6 | 7.9% | 5.6% |
| Cincinnati – Self Storage | $0.0 | 0.0% | 0.0% |
| Cleveland – Cleveland-Elyria-Mentor, OH MSA | $442.5 | 10.3% | 1.9% |
| Cleveland – Hotel | $84.9 | 46.4% | -1.1% |
| Cleveland – Industrial | $0.0 | 0.0% | 0.0% |
| Cleveland – Multifamily | $1.1 | 0.1% | -0.2% |
| Cleveland – Office | $175.9 | 18.8% | 8.9% |
| Cleveland – Other | $172.8 | 42.9% | 0.2% |
| Cleveland – Retail | $7.7 | 1.1% | -0.1% |
| Cleveland – Self Storage | $0.0 | 0.0% | -1.7% |
| Columbus, OH – Columbus, OH MSA | $159.0 | 2.3% | -0.2% |
| Columbus, OH – Hotel | $19.7 | 7.0% | -2.7% |
| Columbus, OH – Industrial | $0.0 | 0.0% | 0.0% |
| Columbus, OH – Multifamily | $0.0 | 0.0% | -0.2% |
| Columbus, OH – Office | $31.1 | 4.9% | 0.8% |
| Columbus, OH – Other | $0.0 | 0.0% | 0.0% |
| Columbus, OH – Retail | $108.2 | 14.4% | -0.6% |
| Columbus, OH – Self Storage | $0.0 | 0.0% | 0.0% |
| Dallas – Dallas-Fort Worth-Arlington, TX MSA | $258.3 | 0.8% | 0.0% |
| Dallas – Hotel | $77.5 | 2.2% | -0.3% |
| Dallas – Industrial | $1.7 | 0.1% | 0.0% |
| Dallas – Multifamily | $7.1 | 0.0% | 0.0% |
| Dallas – Office | $101.1 | 3.4% | 0.0% |
| Dallas – Other | $4.9 | 0.2% | 0.0% |
| Dallas – Retail | $65.9 | 3.3% | -0.2% |
| Dallas – Self Storage | $0.0 | 0.0% | 0.0% |
| Denver – Denver-Aurora, CO MSA | $508.9 | 3.2% | 1.5% |
| Denver – Hotel | $18.3 | 2.6% | -0.6% |
| Denver – Industrial | $0.0 | 0.0% | 0.0% |
| Denver – Multifamily | $0.0 | 0.0% | 0.0% |
| Denver – Office | $377.9 | 18.1% | 11.0% |
| Denver – Other | $66.4 | 6.9% | -3.1% |
| Denver – Retail | $46.2 | 3.5% | 2.5% |
| Denver – Self Storage | $0.0 | 0.0% | 0.0% |
| Detroit – Detroit-Warren-Livonia, MI MSA | $231.8 | 2.2% | -0.3% |
| Detroit – Hotel | $84.1 | 11.8% | -0.1% |
| Detroit – Industrial | $0.0 | 0.0% | 0.0% |
| Detroit – Multifamily | $0.0 | 0.0% | 0.0% |
| Detroit – Office | $3.7 | 0.2% | -0.6% |
| Detroit – Other | $0.0 | 0.0% | 0.0% |
| Detroit – Retail | $143.9 | 10.1% | -0.9% |
| Detroit – Self Storage | $0.0 | 0.0% | 0.0% |
| Hartford – Hartford-West Hartford-East Hartford, CT MSA | $239.5 | 9.0% | 1.1% |
| Hartford – Hotel | $58.2 | 43.4% | 20.0% |
| Hartford – Industrial | $0.0 | 0.0% | 0.0% |
| Hartford – Multifamily | $0.0 | 0.0% | 0.0% |
| Hartford – Office | $25.1 | 9.2% | -1.0% |
| Hartford – Other | $0.0 | 0.0% | 0.0% |
| Hartford – Retail | $156.2 | 46.7% | -0.1% |
| Hartford – Self Storage | $0.0 | 0.0% | 0.0% |
| Houston – Houston-Sugar Land-Baytown, TX MSA | $1,081.1 | 4.5% | 0.2% |
| Houston – Hotel | $512.3 | 47.8% | 5.7% |
| Houston – Industrial | $0.0 | 0.0% | 0.0% |
| Houston – Multifamily | $22.3 | 0.1% | 0.0% |
| Houston – Office | $441.2 | 13.0% | -0.7% |
| Houston – Other | $0.0 | 0.0% | -6.6% |
| Houston – Retail | $105.2 | 3.6% | 0.9% |
| Houston – Self Storage | $0.0 | 0.0% | 0.0% |
| Indianapolis – Indianapolis-Carmel, IN MSA | $176.1 | 2.7% | -0.5% |
| Indianapolis – Hotel | $110.4 | 17.2% | 2.0% |
| Indianapolis – Industrial | $0.0 | 0.0% | 0.0% |
| Indianapolis – Multifamily | $0.0 | 0.0% | -1.2% |
| Indianapolis – Office | $60.2 | 10.2% | -0.2% |
| Indianapolis – Other | $0.0 | 0.0% | 0.0% |
| Indianapolis – Retail | $5.6 | 1.7% | -0.1% |
| Indianapolis – Self Storage | $0.0 | 0.0% | 0.0% |
| Jacksonville – Jacksonville, FL MSA | $111.9 | 2.1% | 0.0% |
| Jacksonville – Hotel | $0.0 | 0.0% | 0.0% |
| Jacksonville – Industrial | $0.0 | 0.0% | 0.0% |
| Jacksonville – Multifamily | $0.0 | 0.0% | -0.1% |
| Jacksonville – Office | $0.0 | 0.0% | 0.0% |
| Jacksonville – Other | $0.0 | 0.0% | 0.0% |
| Jacksonville – Retail | $111.9 | 28.6% | -0.5% |
| Jacksonville – Self Storage | $0.0 | 0.0% | 0.0% |
| Kansas City – Kansas City, MO-KS MSA | $77.9 | 1.3% | -0.2% |
| Kansas City – Hotel | $29.5 | 12.5% | -0.5% |
| Kansas City – Industrial | $0.0 | 0.0% | 0.0% |
| Kansas City – Multifamily | $0.0 | 0.0% | 0.0% |
| Kansas City – Office | $0.0 | 0.0% | 0.0% |
| Kansas City – Other | $0.0 | 0.0% | -10.3% |
| Kansas City – Retail | $48.5 | 8.0% | 2.0% |
| Kansas City – Self Storage | $0.0 | 0.0% | 0.0% |
| Las Vegas – Las Vegas-Paradise, NV MSA | $250.9 | 1.2% | 0.2% |
| Las Vegas – Hotel | $0.0 | 0.0% | 0.0% |
| Las Vegas – Industrial | $0.0 | 0.0% | 0.0% |
| Las Vegas – Multifamily | $0.0 | 0.0% | 0.0% |
| Las Vegas – Office | $4.1 | 0.5% | 0.5% |
| Las Vegas – Other | $0.0 | 0.0% | 0.0% |
| Las Vegas – Retail | $246.8 | 6.4% | 0.8% |
| Las Vegas – Self Storage | $0.0 | 0.0% | 0.0% |
| Los Angeles – Los Angeles-Long Beach-Santa Ana, CA MSA | $849.8 | 1.6% | -0.4% |
| Los Angeles – Hotel | $156.1 | 2.7% | -1.1% |
| Los Angeles – Industrial | $0.0 | 0.0% | 0.0% |
| Los Angeles – Multifamily | $0.0 | 0.0% | -0.1% |
| Los Angeles – Office | $72.9 | 0.6% | -0.6% |
| Los Angeles – Other | $56.5 | 1.6% | -1.3% |
| Los Angeles – Retail | $564.3 | 9.1% | -0.4% |
| Los Angeles – Self Storage | $0.0 | 0.0% | 0.0% |
| Louisville – Louisville/Jefferson County, KY-IN MSA | $71.1 | 2.3% | -0.3% |
| Louisville – Hotel | $0.0 | 0.0% | 0.0% |
| Louisville – Industrial | $0.0 | 0.0% | 0.0% |
| Louisville – Multifamily | $0.0 | 0.0% | 0.0% |
| Louisville – Office | $0.0 | 0.0% | 0.0% |
| Louisville – Other | $0.0 | 0.0% | 0.0% |
| Louisville – Retail | $71.1 | 14.8% | 0.1% |
| Louisville – Self Storage | $0.0 | 0.0% | 0.0% |
| Memphis – Memphis, TN-AR-MS MSA | $73.5 | 3.0% | -0.5% |
| Memphis – Hotel | $12.8 | 6.0% | -0.1% |
| Memphis – Industrial | $0.0 | 0.0% | 0.0% |
| Memphis – Multifamily | $0.0 | 0.0% | -0.5% |
| Memphis – Office | $0.0 | 0.0% | 0.0% |
| Memphis – Other | $0.0 | 0.0% | -15.9% |
| Memphis – Retail | $60.7 | 16.6% | -0.2% |
| Memphis – Self Storage | $0.0 | 0.0% | 0.0% |
| Miami – Miami-Fort Lauderdale-Pompano Beach, FL MSA | $262.8 | 1.0% | 0.0% |
| Miami – Hotel | $40.6 | 0.8% | 0.6% |
| Miami – Industrial | $1.9 | 0.4% | 0.4% |
| Miami – Multifamily | $0.0 | 0.0% | 0.0% |
| Miami – Office | $4.0 | 0.2% | 0.0% |
| Miami – Other | $0.0 | 0.0% | 0.0% |
| Miami – Retail | $216.3 | 3.9% | -0.7% |
| Miami – Self Storage | $0.0 | 0.0% | 0.0% |
| Milwaukee – Milwaukee-Waukesha-West Allis, WI MSA | $216.6 | 8.6% | -0.4% |
| Milwaukee – Hotel | $16.7 | 10.4% | 0.0% |
| Milwaukee – Industrial | $0.0 | 0.0% | 0.0% |
| Milwaukee – Multifamily | $0.0 | 0.0% | 0.0% |
| Milwaukee – Office | $93.4 | 16.9% | -1.2% |
| Milwaukee – Other | $0.2 | 0.2% | -0.4% |
| Milwaukee – Retail | $106.3 | 23.6% | -1.3% |
| Milwaukee – Self Storage | $0.0 | 0.0% | 0.0% |
| Minneapolis – Minneapolis-St. Paul-Bloomington, MN-WI MSA | $1,717.3 | 20.3% | 0.1% |
| Minneapolis – Hotel | $242.3 | 38.8% | -5.0% |
| Minneapolis – Industrial | $0.0 | 0.0% | 0.0% |
| Minneapolis – Multifamily | $0.0 | 0.0% | 0.0% |
| Minneapolis – Office | $70.9 | 3.4% | 1.3% |
| Minneapolis – Other | $4.1 | 1.0% | -0.1% |
| Minneapolis – Retail | $1,400.0 | 77.1% | -0.3% |
| Minneapolis – Self Storage | $0.0 | 0.0% | 0.0% |
| Nashville – Nashville-Davidson-Murfreesboro-Franklin, TN MSA | $61.3 | 1.0% | 0.1% |
| Nashville – Hotel | $52.0 | 3.6% | 0.5% |
| Nashville – Industrial | $0.0 | 0.0% | 0.0% |
| Nashville – Multifamily | $0.0 | 0.0% | 0.0% |
| Nashville – Office | $0.0 | 0.0% | 0.0% |
| Nashville – Other | $0.0 | 0.0% | 0.0% |
| Nashville – Retail | $9.4 | 1.3% | 0.0% |
| Nashville – Self Storage | $0.0 | 0.0% | 0.0% |
| New Orleans – New Orleans-Metairie-Kenner, LA MSA | $132.2 | 3.6% | 0.1% |
| New Orleans – Hotel | $60.0 | 5.2% | 0.1% |
| New Orleans – Industrial | $0.0 | 0.0% | 0.0% |
| New Orleans – Multifamily | $8.3 | 0.9% | 0.9% |
| New Orleans – Office | $27.1 | 5.0% | 0.0% |
| New Orleans – Other | $14.7 | 9.5% | 0.0% |
| New Orleans – Retail | $22.0 | 3.1% | -0.3% |
| New Orleans – Self Storage | $0.0 | 0.0% | 0.0% |
| New York City – New York-Northern New Jersey-Long Island, NY-NJ-PA MSA | $6,421.4 | 5.0% | 0.1% |
| New York City – Hotel | $941.4 | 24.6% | -1.3% |
| New York City – Industrial | $98.8 | 2.4% | 0.8% |
| New York City – Multifamily | $208.8 | 0.6% | -0.6% |
| New York City – Office | $1,418.5 | 3.1% | 0.1% |
| New York City – Other | $1,675.2 | 7.6% | -0.3% |
| New York City – Retail | $2,078.7 | 16.0% | 2.6% |
| New York City – Self Storage | $0.0 | 0.0% | 0.0% |
| Orlando – Orlando-Kissimmee, FL MSA | $138.5 | 1.3% | 0.0% |
| Orlando – Hotel | $52.2 | 1.9% | 0.0% |
| Orlando – Industrial | $0.0 | 0.0% | 0.0% |
| Orlando – Multifamily | $0.0 | 0.0% | 0.0% |
| Orlando – Office | $57.7 | 13.0% | 0.1% |
| Orlando – Other | $0.0 | 0.0% | 0.0% |
| Orlando – Retail | $28.5 | 3.2% | 0.1% |
| Orlando – Self Storage | $0.0 | 0.0% | 0.0% |
| Philadelphia – Philadelphia-Camden-Wilmington, PA-NJ-DE-MD MSA | $780.9 | 3.7% | -0.2% |
| Philadelphia – Hotel | $69.4 | 7.7% | -3.8% |
| Philadelphia – Industrial | $10.4 | 0.3% | 0.3% |
| Philadelphia – Multifamily | $75.2 | 0.8% | -0.8% |
| Philadelphia – Office | $221.6 | 5.4% | 1.3% |
| Philadelphia – Other | $385.1 | 30.1% | 0.5% |
| Philadelphia – Retail | $19.2 | 0.9% | 0.0% |
| Philadelphia – Self Storage | $0.0 | 0.0% | 0.0% |
| Phoenix – Phoenix-Mesa-Scottsdale, AZ MSA | $234.2 | 1.2% | 0.2% |
| Phoenix – Hotel | $32.5 | 2.0% | -0.1% |
| Phoenix – Industrial | $0.0 | 0.0% | 0.0% |
| Phoenix – Multifamily | $0.0 | 0.0% | 0.0% |
| Phoenix – Office | $55.9 | 2.6% | 0.7% |
| Phoenix – Other | $0.0 | 0.0% | -1.0% |
| Phoenix – Retail | $145.8 | 8.4% | 1.2% |
| Phoenix – Self Storage | $0.0 | 0.0% | 0.0% |
| Pittsburgh – Pittsburgh, PA MSA | $245.6 | 5.2% | 4.0% |
| Pittsburgh – Hotel | $15.8 | 8.7% | 0.0% |
| Pittsburgh – Industrial | $0.0 | 0.0% | 0.0% |
| Pittsburgh – Multifamily | $0.1 | 0.0% | 0.0% |
| Pittsburgh – Office | $104.6 | 9.6% | 6.7% |
| Pittsburgh – Other | $117.3 | 33.1% | 30.5% |
| Pittsburgh – Retail | $7.8 | 1.3% | 1.3% |
| Pittsburgh – Self Storage | $0.0 | 0.0% | 0.0% |
| Portland – Portland-Vancouver-Beaverton, OR-WA MSA | $583.3 | 8.2% | 1.6% |
| Portland – Hotel | $348.4 | 38.3% | 7.2% |
| Portland – Industrial | $0.0 | 0.0% | 0.0% |
| Portland – Multifamily | $11.0 | 0.2% | 0.3% |
| Portland – Office | $12.9 | 3.1% | 0.0% |
| Portland – Other | $0.0 | 0.0% | 0.0% |
| Portland – Retail | $211.0 | 42.7% | 0.5% |
| Portland – Self Storage | $0.0 | 0.0% | 0.0% |
| Raleigh – Raleigh-Cary, NC MSA | $25.9 | 0.7% | 0.1% |
| Raleigh – Hotel | $15.3 | 7.2% | -0.2% |
| Raleigh – Industrial | $0.0 | 0.0% | 0.0% |
| Raleigh – Multifamily | $0.0 | 0.0% | 0.0% |
| Raleigh – Office | $0.0 | 0.0% | 0.0% |
| Raleigh – Other | $0.0 | 0.0% | -4.4% |
| Raleigh – Retail | $10.7 | 4.1% | 4.1% |
| Raleigh – Self Storage | $0.0 | 0.0% | 0.0% |
| Richmond – Richmond, VA MSA | $175.0 | 5.2% | 0.4% |
| Richmond – Hotel | $0.0 | 0.0% | 0.0% |
| Richmond – Industrial | $0.0 | 0.0% | 0.0% |
| Richmond – Multifamily | $0.0 | 0.0% | 0.0% |
| Richmond – Office | $16.3 | 2.6% | 2.6% |
| Richmond – Other | $12.9 | 8.9% | 0.0% |
| Richmond – Retail | $145.8 | 32.2% | -5.9% |
| Richmond – Self Storage | $0.0 | 0.0% | 0.0% |
| Riverside – Riverside-San Bernardino-Ontario, CA MSA | $289.9 | 2.8% | 0.0% |
| Riverside – Hotel | $51.9 | 11.5% | -0.2% |
| Riverside – Industrial | $0.0 | 0.0% | 0.0% |
| Riverside – Multifamily | $0.0 | 0.0% | 0.0% |
| Riverside – Office | $0.0 | 0.0% | 0.0% |
| Riverside – Other | $9.7 | 2.5% | 0.0% |
| Riverside – Retail | $228.4 | 11.4% | -0.1% |
| Riverside – Self Storage | $0.0 | 0.0% | 0.0% |
| Sacramento – Sacramento-Arden-Arcade-Roseville, CA MSA | $6.1 | 0.1% | -0.4% |
| Sacramento – Hotel | $0.0 | 0.0% | -2.4% |
| Sacramento – Industrial | $0.0 | 0.0% | 0.0% |
| Sacramento – Multifamily | $0.0 | 0.0% | 0.0% |
| Sacramento – Office | $6.1 | 0.8% | 0.8% |
| Sacramento – Other | $0.0 | 0.0% | -2.9% |
| Sacramento – Retail | $0.0 | 0.0% | -1.6% |
| Sacramento – Self Storage | $0.0 | 0.0% | 0.0% |
| Salt Lake City – Salt Lake City, UT MSA | $6.1 | 0.1% | 0.0% |
| Salt Lake City – Hotel | $6.1 | 2.1% | -0.1% |
| Salt Lake City – Industrial | $0.0 | 0.0% | 0.0% |
| Salt Lake City – Multifamily | $0.0 | 0.0% | 0.0% |
| Salt Lake City – Office | $0.0 | 0.0% | 0.0% |
| Salt Lake City – Other | $0.0 | 0.0% | 0.0% |
| Salt Lake City – Retail | $0.0 | 0.0% | 0.0% |
| Salt Lake City – Self Storage | $0.0 | 0.0% | 0.0% |
| San Antonio – San Antonio, TX MSA | $140.7 | 2.2% | 0.2% |
| San Antonio – Hotel | $17.1 | 6.3% | 3.1% |
| San Antonio – Industrial | $0.0 | 0.0% | 0.0% |
| San Antonio – Multifamily | $7.9 | 0.2% | 0.2% |
| San Antonio – Office | $0.0 | 0.0% | 0.0% |
| San Antonio – Other | $0.0 | 0.0% | 0.0% |
| San Antonio – Retail | $115.8 | 14.2% | 0.0% |
| San Antonio – Self Storage | $0.0 | 0.0% | 0.0% |
| San Diego – San Diego-Carlsbad-San Marcos, CA MSA | $55.6 | 0.5% | -0.1% |
| San Diego – Hotel | $39.4 | 3.4% | 1.5% |
| San Diego – Industrial | $0.0 | 0.0% | 0.0% |
| San Diego – Multifamily | $4.2 | 0.1% | 0.0% |
| San Diego – Office | $0.0 | 0.0% | 0.0% |
| San Diego – Other | $9.2 | 1.3% | -1.6% |
| San Diego – Retail | $2.9 | 0.2% | 0.0% |
| San Diego – Self Storage | $0.0 | 0.0% | 0.0% |
| San Francisco – San Francisco-Oakland-Fremont, CA MSA | $694.9 | 2.7% | -0.2% |
| San Francisco – Hotel | $100.7 | 3.4% | -0.7% |
| San Francisco – Industrial | $0.0 | 0.0% | 0.0% |
| San Francisco – Multifamily | $460.9 | 5.8% | -0.3% |
| San Francisco – Office | $32.1 | 0.3% | 0.0% |
| San Francisco – Other | $53.7 | 2.0% | 0.0% |
| San Francisco – Retail | $47.4 | 4.0% | -0.8% |
| San Francisco – Self Storage | $0.0 | 0.0% | 0.0% |
| San Jose – San Jose-Sunnyvale-Santa Clara, CA MSA | $55.6 | 0.3% | 0.0% |
| San Jose – Hotel | $32.0 | 0.5% | 0.0% |
| San Jose – Industrial | $0.0 | 0.0% | 0.0% |
| San Jose – Multifamily | $0.0 | 0.0% | 0.0% |
| San Jose – Office | $23.6 | 0.3% | 0.0% |
| San Jose – Other | $0.0 | 0.0% | 0.0% |
| San Jose – Retail | $0.0 | 0.0% | 0.0% |
| San Jose – Self Storage | $0.0 | 0.0% | 0.0% |
| Seattle – Seattle-Tacoma-Bellevue, WA MSA | $36.1 | 0.2% | -0.2% |
| Seattle – Hotel | $36.1 | 2.6% | -2.6% |
| Seattle – Industrial | $0.0 | 0.0% | 0.0% |
| Seattle – Multifamily | $0.0 | 0.0% | 0.0% |
| Seattle – Office | $0.0 | 0.0% | 0.0% |
| Seattle – Other | $0.0 | 0.0% | 0.0% |
| Seattle – Retail | $0.0 | 0.0% | 0.0% |
| Seattle – Self Storage | $0.0 | 0.0% | 0.0% |
| St. Louis – St. Louis, MO-IL MSA | $215.6 | 5.1% | -0.2% |
| St. Louis – Hotel | $1.7 | 0.5% | -0.1% |
| St. Louis – Industrial | $0.0 | 0.0% | 0.0% |
| St. Louis – Multifamily | $3.2 | 0.2% | 0.0% |
| St. Louis – Office | $0.0 | 0.0% | 0.0% |
| St. Louis – Other | $19.5 | 3.9% | 0.0% |
| St. Louis – Retail | $191.2 | 20.6% | -0.9% |
| St. Louis – Self Storage | $0.0 | 0.0% | 0.0% |
| Tampa – Tampa-St. Petersburg-Clearwater, FL | $120.2 | 1.2% | 0.0% |
| Tampa – Hotel | $59.0 | 8.5% | 0.1% |
| Tampa – Industrial | $0.0 | 0.0% | 0.0% |
| Tampa – Multifamily | $0.0 | 0.0% | 0.0% |
| Tampa – Office | $23.4 | 3.4% | -0.3% |
| Tampa – Other | $0.0 | 0.0% | 0.0% |
| Tampa – Retail | $37.9 | 5.1% | -0.1% |
| Tampa – Self Storage | $0.0 | 0.0% | 0.0% |
| Tucson – Tucson, AZ MSA | $158.9 | 4.7% | -0.2% |
| Tucson – Hotel | $0.0 | 0.0% | 0.0% |
| Tucson – Industrial | $0.0 | 0.0% | 0.0% |
| Tucson – Multifamily | $0.0 | 0.0% | 0.0% |
| Tucson – Office | $0.0 | 0.0% | 0.0% |
| Tucson – Other | $0.0 | 0.0% | 0.0% |
| Tucson – Retail | $158.9 | 19.4% | -3.6% |
| Tucson – Self Storage | $0.0 | 0.0% | 0.0% |
| Virginia Beach – Virginia Beach-Norfolk-Newport News, VA-NC MSA | $163.7 | 3.4% | 0.2% |
| Virginia Beach – Hotel | $0.0 | 0.0% | 0.0% |
| Virginia Beach – Industrial | $0.0 | 0.0% | 0.0% |
| Virginia Beach – Multifamily | $0.0 | 0.0% | 0.0% |
| Virginia Beach – Office | $0.0 | 0.0% | 0.0% |
| Virginia Beach – Other | $0.0 | 0.0% | 0.0% |
| Virginia Beach – Retail | $163.7 | 20.1% | -0.2% |
| Virginia Beach – Self Storage | $0.0 | 0.0% | 0.0% |
| Washington, DC – Washington-Arlington-Alexandria, DC-VA-MD-WV MSA | $835.8 | 2.6% | 1.1% |
| Washington, DC – Hotel | $36.2 | 3.3% | -0.2% |
| Washington, DC – Industrial | $0.0 | 0.0% | 0.0% |
| Washington, DC – Multifamily | $228.6 | 1.5% | 1.5% |
| Washington, DC – Office | $463.7 | 6.1% | 1.8% |
| Washington, DC – Other | $32.9 | 2.2% | 0.0% |
| Washington, DC – Retail | $74.5 | 2.3% | 0.0% |
| Washington, DC – Self Storage | $0.0 | 0.0% | 0.0% |
| Grand Total | $22,640.6 | 3.2% | 0.3% |
About CRED iQ
CRED iQ is a commercial real estate data, analytics, and valuation platform providing actionable intelligence to CRE and capital markets investors. Subscribers to CRED iQ use the platform to identify valuable leads for leasing, lending, refinancing, distressed debt, and acquisition opportunities. Our data platform is powered by over $2.0 trillion of CMBS, CRE CLO, SBLL, Ginnie Mae, FHA/HUD, and Freddie Mac loan and property data.
