
A point of interest among multifamily investors reviewing February 2023 reporting data for CMBS securitizations was the special servicing transfer of a $270.3 million floating-rate mortgage secured by a 637-unit, 11-property multifamily portfolio owned by Blackstone. CRED iQ anticipates the special servicing transfer to elevate the distressed rate for CMBS loans secured by multifamily properties within the New York City MSA. Prior to February 2023, CRED iQ’s distressed rate for NYC Multifamily was 0.71%. Distressed Rate is defined as the percentage of loans that are specially serviced, delinquent, or a combination of both. Although the distressed rate for NYC multifamily appears nominal at first glance, the New York MSA still ranked as the sixth-highest for multifamily distress among the Top 50 markets tracked by CRED iQ. Other notable distressed properties in the New York MSA include 1209 Dekalb, a 127-unit mid-rise property in Brooklyn. The property secures a $46 million mortgage that has been specially serviced since October 2020. Among multifamily markets with higher distress than New York were San Francisco (5.83%) and Los Angeles (1.24%).
To be fair, the New York MSA is by far the largest multifamily market in the U.S and is expected to continue to attract multifamily investment given vacancy rates that trend below national levels and favorable demographics. These positives are balanced by headwinds such as negative net migration away from the metro and geographical resident deterrence stemming from remote working alternatives.
Reframing our view of distress to a historical perspective, the New York MSA has improved on an absolute basis compared to 12 months prior when the multifamily distressed rate for the market was 1.41%. However, the distressed rate appears to have reached its apex in October 2022 when the distressed rate declined as low as 0.51%. After October 2022, the New York MSA multifamily distressed rate increased for three consecutive months, without yet accounting for the latest $270.3 million addition to the distressed bucket.
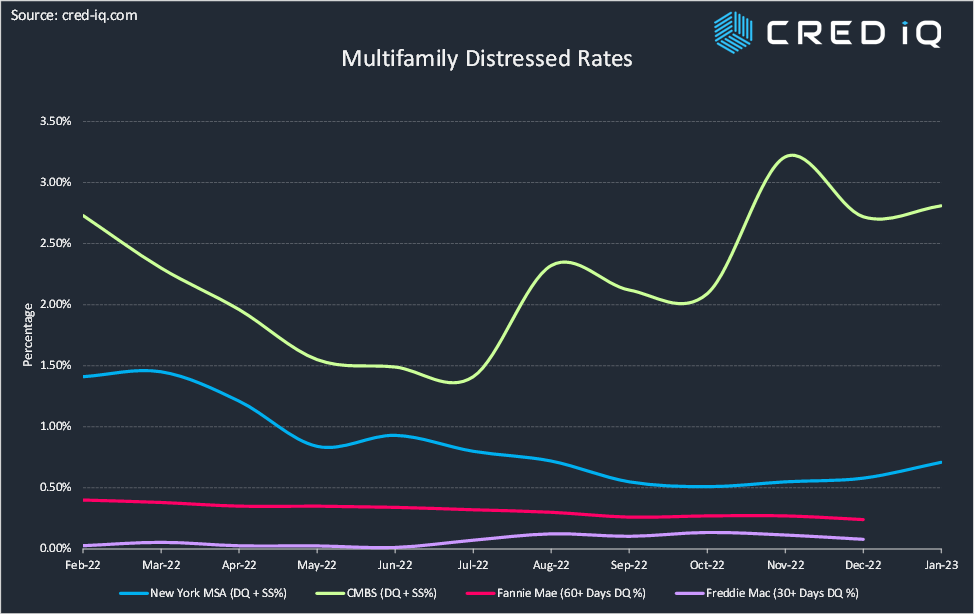
Compared to the overall CMBS distressed rate for multifamily loans, historical trends for the New York MSA have exhibited similar patterns over the past year. The multifamily distressed rate for CMBS has been trending higher for six months. The low-point for distress in CMBS multifamily loans over the past year occurred in July 2022 when the distressed rate was 1.41%. Notable, there were spikes in distress in August and November caused maturity defaults that were worked out by the next month. The multifamily distressed rate for CMBS has nearly doubled since July 2022.
Overall, the performance of the CMBS multifamily sector can be put into perspective when considering other property types and the broader multifamily market. Multifamily, along with industrial, have been the two best performing property types in recent history. Other property types like retail, lodging and more recently office have faced secular headwinds due to shifting usage trends. For comparison, Fannie Mae’s multifamily delinquency rate — defined as loans that are 60+ days delinquent – has consistently and steadily declined from its February 2022 mark of 0.40%. The Freddie Mac K-deal multifamily delinquency rate has barely registered with a delinquency rate – defined as loan that are 30+ days delinquent — of just eight basis points as of year-end 2022. CMBS multifamily collateral tends to have more idiosyncrasies than Fannie Mae and Freddie Mac collateral, partially explaining the variation in distressed rates. Additional idiosyncrasies and pockets of distress, such as the New York multifamily default, may materialize market by market as maturity balloon payments come due and floating-rate debt service continues to pressure coverage ratios.
About CRED iQ
CRED iQ is a commercial real estate data, analytics, and valuation platform providing actionable intelligence to CRE and capital markets investors. Subscribers use the platform to identify valuable leads for leasing, lending, refinancing, distressed debt, and acquisition opportunities.
The platform also offers a highly efficient valuation engine which can be leveraged across all property types and geographies. Our data platform is powered by over $2.0 trillion in transactions and data covering CRE, CMBS, CRE CLO, Single Asset Single Borrower (SASB), and all of GSE / Agency.
