
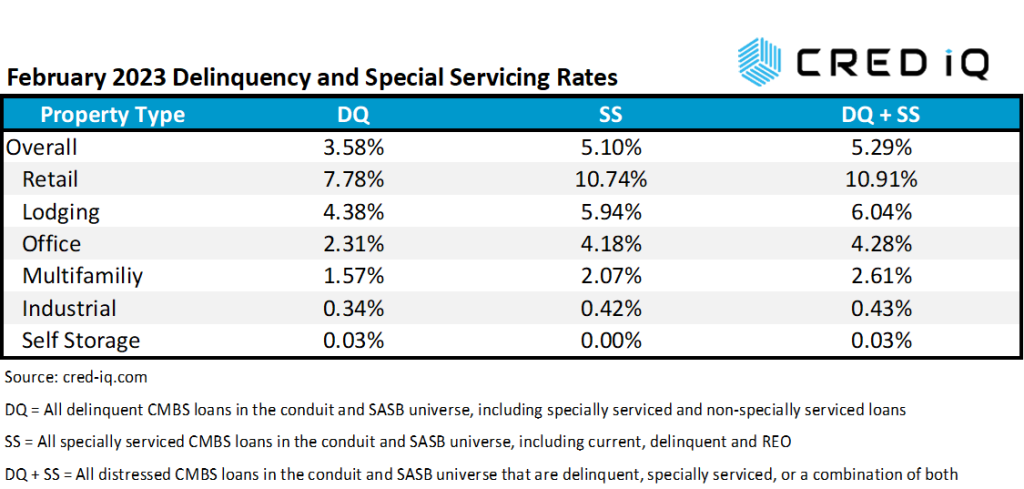
SS = All specially serviced CMBS loans in the conduit and SASB universe, including current, delinquent and REO
DQ + SS = All distressed CMBS loans in the conduit and SASB universe that are delinquent, specially serviced, or a combination of both
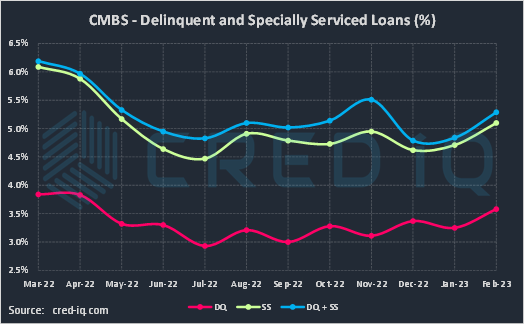
The CRED iQ delinquency rate for CMBS for the month of February 2023 increased to 3.58%. The delinquency rate was 33 basis points higher than the prior month when it stood at 3.25%. The month-over-month increase in delinquency pushed the rate to its highest level since April 2022. The delinquency rate is equal to the percentage of all delinquent specially serviced loans and delinquent non-specially serviced loans, for CRED iQ’s sample universe of $600+ billion in CMBS conduit and single asset single-borrower (SASB) loans. CRED iQ’s special servicing rate, equal to the percentage of CMBS loans that are with the special servicer (delinquent and non-delinquent), also increased month-over-month to 5.10% from 4.71%. Aggregating the two indicators of distress – delinquency rate and special servicing rate – into an overall distressed rate (DQ + SS%) equals 5.29% of CMBS loans that are specially serviced, delinquent, or a combination of both. In parallel with delinquency and special servicing rates, the overall distressed rate increased compared to the prior month’s distressed rate of 4.84%. Distressed rates generally track slightly higher than special servicing rates as most delinquent loans are also with the special servicer.
SS = All specially serviced CMBS loans in the conduit and SASB universe, including current, delinquent and REO
DQ + SS = All distressed CMBS loans in the conduit and SASB universe that are delinquent, specially serviced, or a combination of both
Congruent with prior months’ trends and recent headline risk, loans secured by office properties exhibited the sharpest month-over-month increase in delinquency. The delinquency rate for office increased to 2.31% in February 2023, compared to 2.16% as of January 2023. Office delinquency has increased for four consecutive months and is at its highest level since January 2022. One of the largest loans to be reported as delinquent this month was a $66 million loan secured by 375 Pearl Street, a 573,083-sf office tower located near City Hall in Manhattan, NY. The loan was previously reported delinquent in 2021 on multiple occasions. CBD office towers were not the only office sub-types showing increases in delinquency. A $31.3 million loan secured by an eight-property medical office portfolio owned by Global Medical REIT was also reported as 30 days delinquent in February 2023.
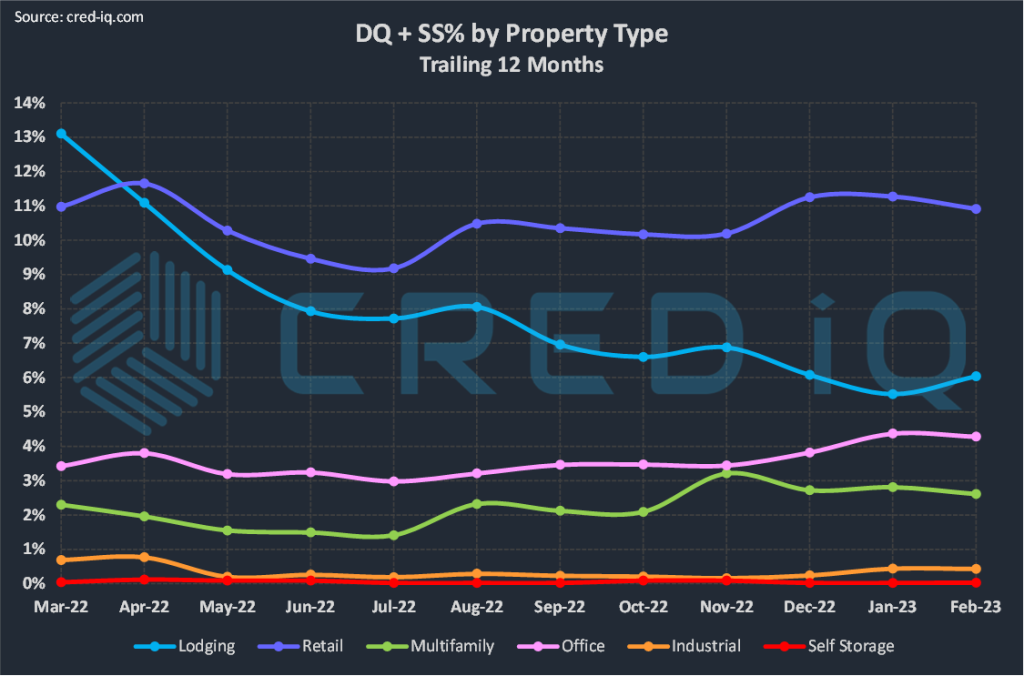
Retail had the highest delinquency rate among all property types, equal to 7.78%, as of February 2023. Over the trailing 12 months, retail delinquency was at its lowest point in July 2022 (5.38%) but consistently trended higher throughout the second half of 2022. The delinquency rate for lodging loans exhibited a modest month-over-month increase to 4.38%. The multifamily (1.57%) and industrial (0.34%) delinquency rates declined in February compared to January 2023.
Special servicing rates were impacted by several new transfers this month, including two notable regional malls. The $295 million Shops at Mission Viejo loan transferred to special servicing after a maturity default on February 1, 2023. Additionally, the Pyramid Management Group’s Crossgates Mall transferred to special servicing due to its $245 million mortgage facing imminent default ahead of the loan’s May 2023 maturity date. The retail special servicing rate was 10.74% as of February 2023, highest among all property types. The special servicing rate for lodging was second highest at 5.94% and was followed by office (4.18%), multifamily (2.07%), and industrial (0.42%).
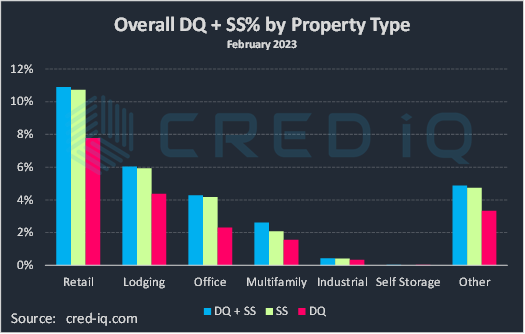
CRED iQ’s CMBS distressed rate (DQ + SS%) by property type accounts for loans that qualify for either delinquent or special servicing subsets. This month, the overall distressed rate for CMBS increased to 5.29%. The increase was driven by increases in delinquency rates for loans secured by office, retail, and lodging properties that became delinquent but have not yet transferred to special servicing. As such, the spread between the delinquency rate and special servicing rate widened modestly in February, compared to the prior month.
For additional information about two of this month’s largest loans that transferred to special servicing, click View Details below:
| [View Details] | [View Details] | |
| Loan | Shops at Mission Viejo | Crossgates Mall |
| Balance | $295 million | $245 million |
| Special Servicer Transfer Date | 2/1/2023 | 2/2/2023 |
About CRED iQ
CRED iQ is a commercial real estate data, analytics, and valuation platform providing actionable intelligence to CRE and capital markets investors. Subscribers use the platform to identify valuable leads for leasing, lending, refinancing, distressed debt, and acquisition opportunities.
The platform also offers a highly efficient valuation engine which can be leveraged across all property types and geographies. Our data platform is powered by over $2.0 trillion in transactions and data covering CRE, CMBS, CRE CLO, Single Asset Single Borrower (SASB), and all of GSE / Agency.
