
CRED iQ monitors distressed rates and market performance for nearly 400 MSAs across the United States, covering over $900 billion in outstanding commercial real estate (CRE) debt. Distressed rates (DQ + SS%) include loans that are specially serviced, delinquent, or a combination of both. Distressed rates and month-over-month changes for data reported as of February 2023 are presented below for the 50 largest MSAs, broken out by property type for a granular view of distress by market-sector.
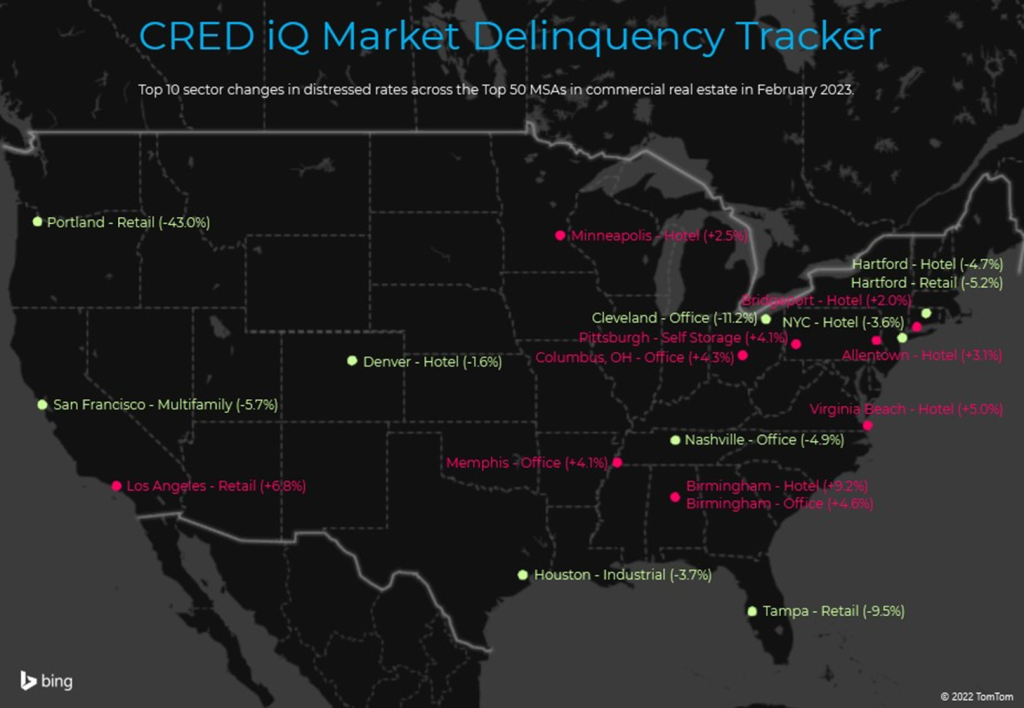
Distress became more prevalent in a majority of primary markets during February 2023. Of the 50 largest MSAs tracked by CRED iQ, 34 of those markets exhibited comparatively higher levels of distress in commercial real estate loans than one month prior. The average month-over-month increase in distressed rates for these 34 markets was approximately 21 basis points. The Birmingham, AL MSA (+1.0%) exhibited the highest month-over-month increase in distress. Other notable markets with increased levels of distress this month included Pittsburgh (+0.8%), Memphis (+0.7%), and Los Angeles (+0.7%).
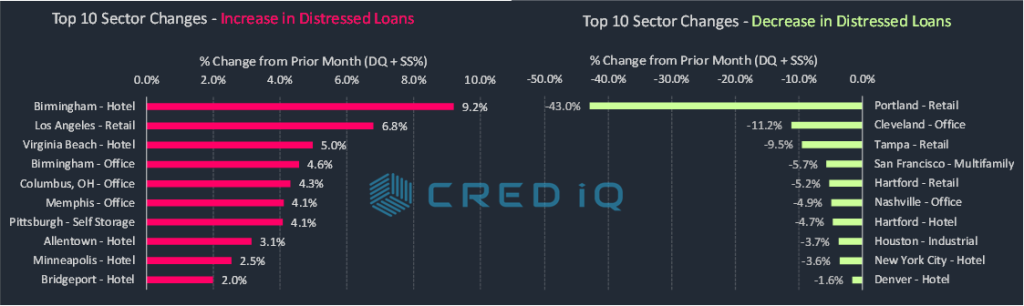
There were 16 MSAs among the Top 50 that exhibited month-over-month improvements in distressed rates. These included Portland (-2.4%), Cleveland (-2.3%), and San Francisco (-1.7%). Despite this month’s improvement, Cleveland continued to have one of the highest distressed rates among all markets that were tracked with 8.4% of commercial real estate loans that were either delinquent or specially serviced.
For a more granular analysis of the Top 50 markets, CRED iQ further delineated individual markets’ distressed rates by property type for a comprehensive view by market-sector. Headline risk from office markets have dominated news cycles since year-end 2022. Thematic evidence of office distress was apparent in February 2023 data with three office markets exhibiting significant month-over-month increases in distress — Birmingham, AL (+4.6%), Columbus, OH (+4.3%), and Memphis (+4.1%). The increase in distress in the Birmingham market was impacted by a $22.5 million loan secured by Chase Corporate Center, a 211,257-SF office property. The loan defaulted at maturity in February 2023 and subsequently transferred to special servicing. Refinancing efforts may have been hindered by the relatively short remaining lease term of the property’s largest tenant, Cigna, which accounts for 34% of the property’s GLA. Cigna’s lease is scheduled to expire in November 2024, less than two years after loan maturity.
Despite heightened attention on office market-sectors, five of the 10 largest month-over-month increases in distress were associated with hotel market-sectors. The lodging sector for Birmingham, AL exhibited the sharpest increase (+9.2%) in February following the special servicing transfer of a $10.4 million loan secured by Hotel Indigo Birmingham due to imminent monetary default. Additionally, two Virginia Beach hotel loans with the same sponsor, totaling $22.2 million, became 30 days delinquent in February. The delinquencies contributed to the distressed rate for the Virginia Beach hotel market increasing by 5.0%.
The Portland retail market and the Cleveland office market were among market-sectors that exhibited the highest levels of improvement in distress this month. With regards to the Portland retail market, a $211 million loan secured by the Clackamas Town Center returned to the master servicer in January 2023 after its maturity date was extended from November 2022 to October 2024. The loan is secured by a 1.4 million-SF regional mall located in Happy Valley, OR.
The Minneapolis MSA has the highest overall distressed rate at 20.7%, which was slightly higher than the previous month. Birmingham (11.4%), Milwaukee (8.9%), Cleveland (8.4%), and Charlotte (7.9%) comprise the remaining markets with the highest rates of distress. Office and lodging distress were primary drivers in the ascension of Birmingham’s ranking of distress. The Salt Lake City MSA (0.1%) displaced Sacramento as the market with the lowest percentage of distress among the Top 50 MSAs. A modest increase in distress in the Sacramento market pushed the MSA to the fourth-lowest ranking of distress among the Top 50 markets.
For the full Market DelinQuency Tracker Report, download here:
| MSA – Property Type | DQ/SS (millions) | DS/SS (%) | Monthly Change |
| Allentown-Bethlehem-Easton, PA-NJ MSA | $78.5 | 2.5% | 0.1% |
| Allentown – Hotel | $1.5 | 4.1% | 3.1% |
| Allentown – Industrial | $0.0 | 0.0% | 0.0% |
| Allentown – Multifamily | $0.0 | 0.0% | 0.0% |
| Allentown – Office | $58.1 | 18.1% | 0.2% |
| Allentown – Other | $0.0 | 0.0% | 0.0% |
| Allentown – Retail | $18.9 | 5.1% | 0.0% |
| Allentown – Self Storage | $0.0 | 0.0% | 0.0% |
| Atlanta-Sandy Springs-Marietta, GA MSA | $544.7 | 2.0% | 0.1% |
| Atlanta – Hotel | $81.9 | 3.3% | 0.0% |
| Atlanta – Industrial | $0.0 | 0.0% | 0.0% |
| Atlanta – Multifamily | $0.0 | 0.0% | 0.0% |
| Atlanta – Office | $83.6 | 3.5% | 0.5% |
| Atlanta – Other | $0.0 | 0.0% | 0.0% |
| Atlanta – Retail | $379.2 | 17.4% | 0.0% |
| Atlanta – Self Storage | $0.0 | 0.0% | 0.0% |
| Austin-Round Rock, TX MSA | $103.3 | 1.1% | -0.1% |
| Austin – Hotel | $50.2 | 5.7% | 0.0% |
| Austin – Industrial | $0.0 | 0.0% | 0.0% |
| Austin – Multifamily | $0.0 | 0.0% | 0.0% |
| Austin – Office | $0.0 | 0.0% | 0.0% |
| Austin – Other | $4.1 | 1.4% | 0.1% |
| Austin – Retail | $48.9 | 6.4% | -0.7% |
| Austin – Self Storage | $0.0 | 0.0% | 0.0% |
| Baltimore-Towson, MD MSA | $352.8 | 3.7% | 0.0% |
| Baltimore – Hotel | $43.7 | 9.1% | 0.1% |
| Baltimore – Industrial | $0.0 | 0.0% | 0.0% |
| Baltimore – Multifamily | $3.8 | 0.1% | 0.0% |
| Baltimore – Office | $46.5 | 5.3% | -0.2% |
| Baltimore – Other | $11.5 | 6.2% | 0.0% |
| Baltimore – Retail | $247.2 | 22.7% | -0.2% |
| Baltimore – Self Storage | $0.0 | 0.0% | 0.0% |
| Birmingham-Hoover, AL MSA | $354.6 | 11.4% | 1.0% |
| Birmingham – Hotel | $10.4 | 9.2% | 9.2% |
| Birmingham – Industrial | $0.0 | 0.0% | 0.0% |
| Birmingham – Multifamily | $63.2 | 4.5% | 0.0% |
| Birmingham – Office | $116.8 | 23.5% | 4.6% |
| Birmingham – Other | $0.0 | 0.0% | 0.0% |
| Birmingham – Retail | $164.2 | 23.0% | 0.0% |
| Birmingham – Self Storage | $0.0 | 0.0% | 0.0% |
| Boston-Cambridge-Quincy, MA-NH MSA | $122.9 | 0.6% | 0.0% |
| Boston – Hotel | $19.3 | 1.2% | 0.0% |
| Boston – Industrial | $0.0 | 0.0% | 0.0% |
| Boston – Multifamily | $0.0 | 0.0% | 0.0% |
| Boston – Office | $14.5 | 0.2% | 0.0% |
| Boston – Other | $0.0 | 0.0% | 0.0% |
| Boston – Retail | $89.1 | 5.0% | -0.1% |
| Boston – Self Storage | $0.0 | 0.0% | 0.0% |
| Bridgeport-Stamford-Norwalk, CT MSA | $200.4 | 4.9% | 0.0% |
| Bridgeport – Hotel | $39.4 | 26.3% | 2.0% |
| Bridgeport – Industrial | $17.8 | 15.0% | 0.0% |
| Bridgeport – Multifamily | $0.0 | 0.0% | 0.0% |
| Bridgeport – Office | $133.3 | 11.0% | 0.0% |
| Bridgeport – Other | $9.8 | 3.3% | 0.0% |
| Bridgeport – Retail | $0.0 | 0.0% | 0.0% |
| Bridgeport – Self Storage | $0.0 | 0.0% | 0.0% |
| Charlotte-Gastonia-Concord, NC-SC MSA | $600.4 | 7.9% | 0.4% |
| Charlotte – Hotel | $47.4 | 5.3% | 1.3% |
| Charlotte – Industrial | $0.0 | 0.0% | 0.0% |
| Charlotte – Multifamily | $0.0 | 0.0% | 0.0% |
| Charlotte – Office | $354.7 | 38.4% | 0.0% |
| Charlotte – Other | $114.9 | 36.3% | 5.2% |
| Charlotte – Retail | $83.5 | 9.0% | -0.2% |
| Charlotte – Self Storage | $0.0 | 0.0% | 0.0% |
| Chicago-Naperville-Joliet, IL-IN-WI MSA | $2,326.5 | 7.7% | -0.1% |
| Chicago – Hotel | $749.5 | 32.1% | 1.1% |
| Chicago – Industrial | $0.0 | 0.0% | 0.0% |
| Chicago – Multifamily | $62.8 | 0.7% | 0.1% |
| Chicago – Office | $1,082.8 | 12.5% | 0.1% |
| Chicago – Other | $208.3 | 8.2% | 0.0% |
| Chicago – Retail | $223.1 | 7.0% | -0.9% |
| Chicago – Self Storage | $0.0 | 0.0% | 0.0% |
| Cincinnati-Middletown, OH-KY-IN MSA | $137.3 | 3.6% | 0.0% |
| Cincinnati – Hotel | $87.1 | 30.2% | 0.2% |
| Cincinnati – Industrial | $0.0 | 0.0% | 0.0% |
| Cincinnati – Multifamily | $0.0 | 0.0% | 0.0% |
| Cincinnati – Office | $0.0 | 0.0% | 0.0% |
| Cincinnati – Other | $6.8 | 2.6% | 0.0% |
| Cincinnati – Retail | $43.4 | 7.9% | 0.0% |
| Cincinnati – Self Storage | $0.0 | 0.0% | 0.0% |
| Cleveland-Elyria-Mentor, OH MSA | $354.2 | 8.4% | -2.3% |
| Cleveland – Hotel | $84.7 | 46.5% | 0.1% |
| Cleveland – Industrial | $0.0 | 0.0% | 0.0% |
| Cleveland – Multifamily | $0.0 | 0.0% | 0.0% |
| Cleveland – Office | $89.7 | 10.1% | -11.2% |
| Cleveland – Other | $172.2 | 43.0% | 0.1% |
| Cleveland – Retail | $7.7 | 1.1% | 0.0% |
| Cleveland – Self Storage | $0.0 | 0.0% | 0.0% |
| Columbus, OH MSA | $185.2 | 2.7% | 0.4% |
| Columbus, OH – Hotel | $20.0 | 7.1% | 0.3% |
| Columbus, OH – Industrial | $0.0 | 0.0% | 0.0% |
| Columbus, OH – Multifamily | $0.0 | 0.0% | 0.0% |
| Columbus, OH – Office | $57.5 | 9.1% | 4.3% |
| Columbus, OH – Other | $0.0 | 0.0% | 0.0% |
| Columbus, OH – Retail | $107.7 | 12.9% | -0.1% |
| Columbus, OH – Self Storage | $0.0 | 0.0% | 0.0% |
| Dallas-Fort Worth-Arlington, TX MSA | $221.3 | 0.6% | 0.0% |
| Dallas – Hotel | $69.9 | 2.0% | -0.2% |
| Dallas – Industrial | $2.4 | 0.2% | 0.2% |
| Dallas – Multifamily | $8.5 | 0.0% | 0.0% |
| Dallas – Office | $109.8 | 3.8% | 0.6% |
| Dallas – Other | $4.9 | 0.2% | 0.0% |
| Dallas – Retail | $25.8 | 1.3% | -0.5% |
| Dallas – Self Storage | $0.0 | 0.0% | 0.0% |
| Denver-Aurora, CO MSA | $839.8 | 5.4% | 0.2% |
| Denver – Hotel | $19.2 | 2.5% | -1.6% |
| Denver – Industrial | $0.0 | 0.0% | 0.0% |
| Denver – Multifamily | $0.0 | 0.0% | 0.0% |
| Denver – Office | $680.3 | 32.9% | 0.6% |
| Denver – Other | $94.1 | 10.0% | 2.9% |
| Denver – Retail | $46.2 | 3.4% | 0.0% |
| Denver – Self Storage | $0.0 | 0.0% | 0.0% |
| Detroit-Warren-Livonia, MI MSA | $268.2 | 2.6% | 0.0% |
| Detroit – Hotel | $84.0 | 11.7% | 0.3% |
| Detroit – Industrial | $20.4 | 3.3% | 0.0% |
| Detroit – Multifamily | $0.0 | 0.0% | 0.0% |
| Detroit – Office | $21.0 | 0.8% | 0.1% |
| Detroit – Other | $0.0 | 0.0% | 0.0% |
| Detroit – Retail | $142.8 | 9.8% | 0.2% |
| Detroit – Self Storage | $0.0 | 0.0% | 0.0% |
| Hartford-West Hartford-East Hartford, CT MSA | $195.6 | 7.5% | -1.4% |
| Hartford – Hotel | $44.3 | 37.7% | -4.7% |
| Hartford – Industrial | $0.0 | 0.0% | 0.0% |
| Hartford – Multifamily | $0.0 | 0.0% | 0.0% |
| Hartford – Office | $25.0 | 9.2% | 0.0% |
| Hartford – Other | $0.0 | 0.0% | 0.0% |
| Hartford – Retail | $126.3 | 42.6% | -5.2% |
| Hartford – Self Storage | $0.0 | 0.0% | 0.0% |
| Houston-Sugar Land-Baytown, TX MSA | $1,146.9 | 4.5% | 0.1% |
| Houston – Hotel | $463.1 | 46.0% | 1.0% |
| Houston – Industrial | $32.7 | 5.2% | -3.7% |
| Houston – Multifamily | $12.1 | 0.1% | 0.0% |
| Houston – Office | $491.9 | 14.0% | -0.4% |
| Houston – Other | $62.8 | 10.8% | 5.7% |
| Houston – Retail | $84.2 | 2.1% | -0.1% |
| Houston – Self Storage | $0.0 | 0.0% | 0.0% |
| Indianapolis-Carmel, IN MSA | $175.6 | 3.0% | 0.0% |
| Indianapolis – Hotel | $110.0 | 18.1% | 0.9% |
| Indianapolis – Industrial | $0.0 | 0.0% | 0.0% |
| Indianapolis – Multifamily | $0.0 | 0.0% | 0.0% |
| Indianapolis – Office | $60.0 | 10.3% | 0.0% |
| Indianapolis – Other | $0.0 | 0.0% | 0.0% |
| Indianapolis – Retail | $5.6 | 1.6% | 0.0% |
| Indianapolis – Self Storage | $0.0 | 0.0% | 0.0% |
| Jacksonville, FL MSA | $111.9 | 2.0% | 0.0% |
| Jacksonville – Hotel | $0.0 | 0.0% | 0.0% |
| Jacksonville – Industrial | $0.0 | 0.0% | 0.0% |
| Jacksonville – Multifamily | $0.0 | 0.0% | 0.0% |
| Jacksonville – Office | $0.0 | 0.0% | 0.0% |
| Jacksonville – Other | $0.0 | 0.0% | 0.0% |
| Jacksonville – Retail | $111.9 | 28.6% | 0.0% |
| Jacksonville – Self Storage | $0.0 | 0.0% | 0.0% |
| Kansas City, MO-KS MSA | $82.6 | 1.4% | 0.0% |
| Kansas City – Hotel | $30.3 | 12.6% | 1.1% |
| Kansas City – Industrial | $0.0 | 0.0% | 0.0% |
| Kansas City – Multifamily | $3.8 | 0.1% | 0.0% |
| Kansas City – Office | $0.0 | 0.0% | 0.0% |
| Kansas City – Other | $0.0 | 0.0% | 0.0% |
| Kansas City – Retail | $48.4 | 8.5% | 0.0% |
| Kansas City – Self Storage | $0.0 | 0.0% | 0.0% |
| Las Vegas-Paradise, NV MSA | $245.3 | 1.1% | 0.0% |
| Las Vegas – Hotel | $0.0 | 0.0% | 0.0% |
| Las Vegas – Industrial | $0.0 | 0.0% | 0.0% |
| Las Vegas – Multifamily | $0.0 | 0.0% | 0.0% |
| Las Vegas – Office | $0.0 | 0.0% | 0.0% |
| Las Vegas – Other | $0.0 | 0.0% | 0.0% |
| Las Vegas – Retail | $245.3 | 6.5% | 0.0% |
| Las Vegas – Self Storage | $0.0 | 0.0% | 0.0% |
| Los Angeles-Long Beach-Santa Ana, CA MSA | $1,336.9 | 2.5% | 0.7% |
| Los Angeles – Hotel | $84.2 | 1.5% | 0.1% |
| Los Angeles – Industrial | $0.0 | 0.0% | 0.0% |
| Los Angeles – Multifamily | $270.0 | 1.3% | 0.0% |
| Los Angeles – Office | $34.3 | 0.3% | 0.0% |
| Los Angeles – Other | $89.3 | 2.7% | 1.0% |
| Los Angeles – Retail | $859.1 | 13.6% | 6.8% |
| Los Angeles – Self Storage | $0.0 | 0.0% | 0.0% |
| Louisville/Jefferson County, KY-IN MSA | $70.7 | 2.3% | 0.0% |
| Louisville – Hotel | $0.0 | 0.0% | 0.0% |
| Louisville – Industrial | $0.0 | 0.0% | 0.0% |
| Louisville – Multifamily | $0.0 | 0.0% | 0.0% |
| Louisville – Office | $0.0 | 0.0% | 0.0% |
| Louisville – Other | $0.0 | 0.0% | 0.0% |
| Louisville – Retail | $70.7 | 14.4% | 0.1% |
| Louisville – Self Storage | $0.0 | 0.0% | 0.0% |
| Memphis, TN-AR-MS MSA | $89.9 | 3.7% | 0.7% |
| Memphis – Hotel | $13.7 | 6.2% | 0.8% |
| Memphis – Industrial | $0.0 | 0.0% | 0.0% |
| Memphis – Multifamily | $0.0 | 0.0% | 0.0% |
| Memphis – Office | $10.5 | 4.1% | 4.1% |
| Memphis – Other | $5.3 | 18.0% | 18.0% |
| Memphis – Retail | $60.4 | 16.6% | -0.1% |
| Memphis – Self Storage | $0.0 | 0.0% | 0.0% |
| Miami-Fort Lauderdale-Pompano Beach, FL MSA | $267.6 | 1.1% | 0.0% |
| Miami – Hotel | $40.5 | 0.8% | 0.0% |
| Miami – Industrial | $0.0 | 0.0% | 0.0% |
| Miami – Multifamily | $0.0 | 0.0% | 0.0% |
| Miami – Office | $4.1 | 0.2% | 0.0% |
| Miami – Other | $0.0 | 0.0% | 0.0% |
| Miami – Retail | $223.1 | 4.3% | 0.2% |
| Miami – Self Storage | $0.0 | 0.0% | 0.0% |
| Milwaukee-Waukesha-West Allis, WI MSA | $219.1 | 8.9% | 0.2% |
| Milwaukee – Hotel | $16.6 | 11.2% | 0.8% |
| Milwaukee – Industrial | $0.0 | 0.0% | 0.0% |
| Milwaukee – Multifamily | $0.0 | 0.0% | 0.0% |
| Milwaukee – Office | $96.7 | 17.7% | 0.0% |
| Milwaukee – Other | $0.0 | 0.0% | -0.2% |
| Milwaukee – Retail | $105.9 | 23.2% | 0.1% |
| Milwaukee – Self Storage | $0.0 | 0.0% | 0.0% |
| Minneapolis-St. Paul-Bloomington, MN-WI MSA | $1,736.6 | 20.7% | 0.3% |
| Minneapolis – Hotel | $247.4 | 41.6% | 2.5% |
| Minneapolis – Industrial | $0.0 | 0.0% | 0.0% |
| Minneapolis – Multifamily | $20.5 | 0.7% | 0.0% |
| Minneapolis – Office | $64.5 | 3.3% | 0.1% |
| Minneapolis – Other | $4.1 | 0.8% | 0.0% |
| Minneapolis – Retail | $1,400.0 | 74.9% | 0.7% |
| Minneapolis – Self Storage | $0.0 | 0.0% | 0.0% |
| Nashville-Davidson-Murfreesboro-Franklin, TN MSA | $64.8 | 1.1% | -0.4% |
| Nashville – Hotel | $51.8 | 3.5% | -0.1% |
| Nashville – Industrial | $0.0 | 0.0% | 0.0% |
| Nashville – Multifamily | $0.0 | 0.0% | 0.0% |
| Nashville – Office | $0.0 | 0.0% | -4.9% |
| Nashville – Other | $0.0 | 0.0% | 0.0% |
| Nashville – Retail | $13.1 | 1.8% | 0.0% |
| Nashville – Self Storage | $0.0 | 0.0% | 0.0% |
| New Orleans-Metairie-Kenner, LA MSA | $131.9 | 3.7% | 0.0% |
| New Orleans – Hotel | $59.9 | 5.2% | 0.2% |
| New Orleans – Industrial | $0.0 | 0.0% | 0.0% |
| New Orleans – Multifamily | $8.3 | 0.9% | 0.0% |
| New Orleans – Office | $27.1 | 5.3% | -0.2% |
| New Orleans – Other | $14.7 | 9.6% | 0.0% |
| New Orleans – Retail | $21.9 | 3.3% | 0.0% |
| New Orleans – Self Storage | $0.0 | 0.0% | 0.0% |
| New York-Northern New Jersey-Long Island, NY-NJ-PA MSA | $6,450.8 | 4.8% | -0.2% |
| New York City – Hotel | $751.6 | 19.6% | -3.6% |
| New York City – Industrial | $120.4 | 3.0% | 0.7% |
| New York City – Multifamily | $564.7 | 1.4% | 0.7% |
| New York City – Office | $1,462.4 | 3.0% | -0.8% |
| New York City – Other | $1,507.6 | 6.6% | 0.3% |
| New York City – Retail | $2,044.0 | 15.7% | 0.6% |
| New York City – Self Storage | $0.0 | 0.0% | 0.0% |
| Orlando-Kissimmee, FL MSA | $114.0 | 1.1% | 0.0% |
| Orlando – Hotel | $27.8 | 1.0% | 0.0% |
| Orlando – Industrial | $0.0 | 0.0% | 0.0% |
| Orlando – Multifamily | $0.0 | 0.0% | 0.0% |
| Orlando – Office | $57.7 | 13.5% | 0.0% |
| Orlando – Other | $0.0 | 0.0% | 0.0% |
| Orlando – Retail | $28.4 | 3.1% | 0.0% |
| Orlando – Self Storage | $0.0 | 0.0% | 0.0% |
| Philadelphia-Camden-Wilmington, PA-NJ-DE-MD MSA | $840.4 | 4.0% | 0.1% |
| Philadelphia – Hotel | $102.0 | 11.4% | 0.7% |
| Philadelphia – Industrial | $10.4 | 0.3% | 0.0% |
| Philadelphia – Multifamily | $41.1 | 0.4% | 0.0% |
| Philadelphia – Office | $274.4 | 7.1% | 0.4% |
| Philadelphia – Other | $389.0 | 31.6% | 1.0% |
| Philadelphia – Retail | $23.5 | 1.1% | 0.2% |
| Philadelphia – Self Storage | $0.0 | 0.0% | 0.0% |
| Phoenix-Mesa-Scottsdale, AZ MSA | $232.4 | 1.2% | 0.1% |
| Phoenix – Hotel | $33.5 | 2.0% | 0.0% |
| Phoenix – Industrial | $0.0 | 0.0% | 0.0% |
| Phoenix – Multifamily | $0.0 | 0.0% | 0.0% |
| Phoenix – Office | $55.7 | 2.5% | 0.0% |
| Phoenix – Other | $8.6 | 0.9% | 0.9% |
| Phoenix – Retail | $134.6 | 6.2% | 0.0% |
| Phoenix – Self Storage | $0.0 | 0.0% | 0.0% |
| Pittsburgh, PA MSA | $296.1 | 6.3% | 0.8% |
| Pittsburgh – Hotel | $26.7 | 12.8% | 0.0% |
| Pittsburgh – Industrial | $0.0 | 0.0% | 0.0% |
| Pittsburgh – Multifamily | $36.3 | 1.6% | 1.6% |
| Pittsburgh – Office | $104.2 | 10.0% | 0.0% |
| Pittsburgh – Other | $116.2 | 33.0% | 0.0% |
| Pittsburgh – Retail | $7.8 | 1.3% | 0.0% |
| Pittsburgh – Self Storage | $4.8 | 4.1% | 4.1% |
| Portland-Vancouver-Beaverton, OR-WA MSA | $321.4 | 3.6% | -2.4% |
| Portland – Hotel | $296.1 | 33.2% | -0.8% |
| Portland – Industrial | $0.0 | 0.0% | 0.0% |
| Portland – Multifamily | $0.0 | 0.0% | 0.0% |
| Portland – Office | $25.2 | 5.1% | -0.3% |
| Portland – Other | $0.0 | 0.0% | 0.0% |
| Portland – Retail | $0.0 | 0.0% | -43.0% |
| Portland – Self Storage | $0.0 | 0.0% | 0.0% |
| Raleigh-Cary, NC MSA | $32.5 | 0.9% | 0.2% |
| Raleigh – Hotel | $15.3 | 6.7% | 0.2% |
| Raleigh – Industrial | $0.0 | 0.0% | 0.0% |
| Raleigh – Multifamily | $0.0 | 0.0% | 0.0% |
| Raleigh – Office | $0.0 | 0.0% | 0.0% |
| Raleigh – Other | $6.6 | 3.6% | 3.6% |
| Raleigh – Retail | $10.6 | 3.9% | 0.0% |
| Raleigh – Self Storage | $0.0 | 0.0% | 0.0% |
| Richmond, VA MSA | $158.4 | 4.8% | 0.0% |
| Richmond – Hotel | $0.0 | 0.0% | 0.0% |
| Richmond – Industrial | $0.0 | 0.0% | 0.0% |
| Richmond – Multifamily | $0.0 | 0.0% | 0.0% |
| Richmond – Office | $0.0 | 0.0% | 0.0% |
| Richmond – Other | $12.9 | 8.8% | 0.0% |
| Richmond – Retail | $145.5 | 31.1% | 0.4% |
| Richmond – Self Storage | $0.0 | 0.0% | 0.0% |
| Riverside-San Bernardino-Ontario, CA MSA | $302.1 | 2.9% | -0.1% |
| Riverside – Hotel | $52.8 | 11.7% | 0.4% |
| Riverside – Industrial | $0.0 | 0.0% | 0.0% |
| Riverside – Multifamily | $0.0 | 0.0% | 0.0% |
| Riverside – Office | $0.0 | 0.0% | 0.0% |
| Riverside – Other | $0.0 | 0.0% | 0.0% |
| Riverside – Retail | $249.3 | 12.3% | -0.6% |
| Riverside – Self Storage | $0.0 | 0.0% | 0.0% |
| Sacramento-Arden-Arcade-Roseville, CA MSA | $17.0 | 0.3% | 0.2% |
| Sacramento – Hotel | $0.0 | 0.0% | 0.0% |
| Sacramento – Industrial | $0.0 | 0.0% | 0.0% |
| Sacramento – Multifamily | $0.0 | 0.0% | 0.0% |
| Sacramento – Office | $6.1 | 0.8% | -0.1% |
| Sacramento – Other | $10.9 | 2.8% | 2.8% |
| Sacramento – Retail | $0.0 | 0.0% | 0.0% |
| Sacramento – Self Storage | $0.0 | 0.0% | 0.0% |
| Salt Lake City, UT MSA | $6.1 | 0.1% | 0.0% |
| Salt Lake City – Hotel | $6.1 | 2.1% | 0.0% |
| Salt Lake City – Industrial | $0.0 | 0.0% | 0.0% |
| Salt Lake City – Multifamily | $0.0 | 0.0% | 0.0% |
| Salt Lake City – Office | $0.0 | 0.0% | 0.0% |
| Salt Lake City – Other | $0.0 | 0.0% | 0.0% |
| Salt Lake City – Retail | $0.0 | 0.0% | 0.0% |
| Salt Lake City – Self Storage | $0.0 | 0.0% | 0.0% |
| San Antonio, TX MSA | $132.9 | 2.1% | 0.0% |
| San Antonio – Hotel | $17.7 | 6.9% | 0.7% |
| San Antonio – Industrial | $0.0 | 0.0% | 0.0% |
| San Antonio – Multifamily | $0.0 | 0.0% | -0.2% |
| San Antonio – Office | $0.0 | 0.0% | 0.0% |
| San Antonio – Other | $0.0 | 0.0% | 0.0% |
| San Antonio – Retail | $115.2 | 14.7% | 0.0% |
| San Antonio – Self Storage | $0.0 | 0.0% | 0.0% |
| San Diego-Carlsbad-San Marcos, CA MSA | $46.4 | 0.4% | 0.0% |
| San Diego – Hotel | $39.4 | 2.0% | -1.3% |
| San Diego – Industrial | $0.0 | 0.0% | 0.0% |
| San Diego – Multifamily | $4.1 | 0.1% | 0.0% |
| San Diego – Office | $0.0 | 0.0% | 0.0% |
| San Diego – Other | $0.0 | 0.0% | 0.0% |
| San Diego – Retail | $2.9 | 0.2% | 0.0% |
| San Diego – Self Storage | $0.0 | 0.0% | 0.0% |
| San Francisco-Oakland-Fremont, CA MSA | $261.4 | 1.0% | -1.7% |
| San Francisco – Hotel | $100.7 | 3.3% | 0.9% |
| San Francisco – Industrial | $0.0 | 0.0% | 0.0% |
| San Francisco – Multifamily | $11.9 | 0.2% | -5.7% |
| San Francisco – Office | $47.8 | 0.5% | -0.4% |
| San Francisco – Other | $38.6 | 1.4% | 0.0% |
| San Francisco – Retail | $62.4 | 5.3% | 1.0% |
| San Francisco – Self Storage | $0.0 | 0.0% | 0.0% |
| San Jose-Sunnyvale-Santa Clara, CA MSA | $58.8 | 0.3% | 0.0% |
| San Jose – Hotel | $35.4 | 0.5% | 0.0% |
| San Jose – Industrial | $0.0 | 0.0% | 0.0% |
| San Jose – Multifamily | $0.0 | 0.0% | 0.0% |
| San Jose – Office | $23.4 | 0.3% | 0.0% |
| San Jose – Other | $0.0 | 0.0% | 0.0% |
| San Jose – Retail | $0.0 | 0.0% | 0.0% |
| San Jose – Self Storage | $0.0 | 0.0% | 0.0% |
| Seattle-Tacoma-Bellevue, WA MSA | $61.4 | 0.3% | 0.0% |
| Seattle – Hotel | $61.4 | 4.3% | -0.1% |
| Seattle – Industrial | $0.0 | 0.0% | 0.0% |
| Seattle – Multifamily | $0.0 | 0.0% | 0.0% |
| Seattle – Office | $0.0 | 0.0% | 0.0% |
| Seattle – Other | $0.0 | 0.0% | 0.0% |
| Seattle – Retail | $0.0 | 0.0% | 0.0% |
| Seattle – Self Storage | $0.0 | 0.0% | 0.0% |
| St. Louis, MO-IL MSA | $209.2 | 4.9% | -0.2% |
| St. Louis – Hotel | $1.7 | 0.5% | -0.1% |
| St. Louis – Industrial | $0.0 | 0.0% | 0.0% |
| St. Louis – Multifamily | $3.2 | 0.2% | 0.0% |
| St. Louis – Office | $0.0 | 0.0% | 0.0% |
| St. Louis – Other | $14.0 | 2.8% | -1.1% |
| St. Louis – Retail | $190.3 | 20.3% | -0.4% |
| St. Louis – Self Storage | $0.0 | 0.0% | 0.0% |
| Tampa-St. Petersburg-Clearwater, FL | $116.4 | 1.1% | -0.9% |
| Tampa – Hotel | $58.9 | 8.2% | 0.0% |
| Tampa – Industrial | $0.0 | 0.0% | 0.0% |
| Tampa – Multifamily | $0.0 | 0.0% | 0.0% |
| Tampa – Office | $19.7 | 2.6% | -0.5% |
| Tampa – Other | $0.0 | 0.0% | 0.0% |
| Tampa – Retail | $37.8 | 5.1% | -9.5% |
| Tampa – Self Storage | $0.0 | 0.0% | 0.0% |
| Tucson, AZ MSA | $157.3 | 4.6% | 0.3% |
| Tucson – Hotel | $0.0 | 0.0% | 0.0% |
| Tucson – Industrial | $0.0 | 0.0% | 0.0% |
| Tucson – Multifamily | $0.0 | 0.0% | 0.0% |
| Tucson – Office | $0.0 | 0.0% | 0.0% |
| Tucson – Other | $0.0 | 0.0% | 0.0% |
| Tucson – Retail | $157.3 | 18.9% | 3.6% |
| Tucson – Self Storage | $0.0 | 0.0% | 0.0% |
| Virginia Beach-Norfolk-Newport News, VA-NC MSA | $203.8 | 4.1% | 0.5% |
| Virginia Beach – Hotel | $35.8 | 8.0% | 5.0% |
| Virginia Beach – Industrial | $0.0 | 0.0% | 0.0% |
| Virginia Beach – Multifamily | $0.0 | 0.0% | 0.0% |
| Virginia Beach – Office | $0.0 | 0.0% | 0.0% |
| Virginia Beach – Other | $4.5 | 3.4% | 3.4% |
| Virginia Beach – Retail | $163.6 | 19.2% | 0.3% |
| Virginia Beach – Self Storage | $0.0 | 0.0% | 0.0% |
| Washington-Arlington-Alexandria, DC-VA-MD-WV MSA | $652.4 | 2.0% | 0.2% |
| Washington, DC – Hotel | $37.0 | 3.2% | 0.1% |
| Washington, DC – Industrial | $0.0 | 0.0% | 0.0% |
| Washington, DC – Multifamily | $0.0 | 0.0% | 0.0% |
| Washington, DC – Office | $501.5 | 6.6% | 0.5% |
| Washington, DC – Other | $38.7 | 2.7% | 0.6% |
| Washington, DC – Retail | $75.3 | 2.2% | 0.0% |
| Washington, DC – Self Storage | $0.0 | 0.0% | 0.0% |
| Grand Total | $23,236.4 | 3.2% | 0.0% |
About CRED iQ
CRED iQ is a commercial real estate data, analytics, and valuation platform providing actionable intelligence to CRE and capital markets investors. Subscribers use the platform to identify valuable leads for leasing, lending, refinancing, distressed debt, and acquisition opportunities.
The platform also offers a highly efficient valuation engine which can be leveraged across all property types and geographies. Our data platform is powered by over $2.0 trillion in transactions and data covering CRE, CMBS, CRE CLO, Single Asset Single Borrower (SASB), and all of GSE / Agency.
