

Our first post of our brand new blog series with Lakebrook Capital and CRED iQ. This first post covers the following topics, Interest Rates, Agency Pricing Grids, Notable Trends Survey, and a new Podcast.
CRED iQ is pleased to welcome Lakebrook Capital to our affiliate series! Lakebrook Capital and Brandon Roth have over 17 years in experience in commercial real estate spanning appraisal, banking, and brokerage, 120 deals and nearly $10 billion in capital raised.
Lakebrook Capital bring together surveys, rate data, and market sentiment from various capital providers. CRED iQ is arming the Lakebrook team with our precise data and research, market opportunities, real-time distressed assets, and recent closed loans and their granular details.
Interest Rates
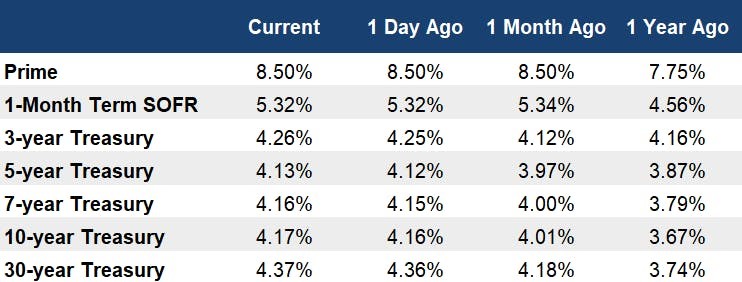
The chart below shows the 10-year treasury yield over the past 30 days. The rate fell to 3.86% by the end of January, but has since climbed back 31 basis points to 4.17%.
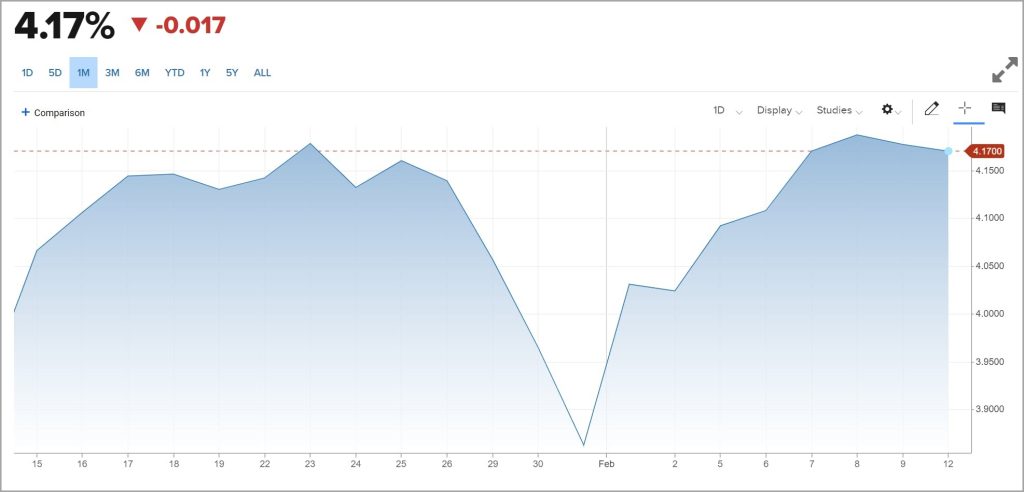
Treasury yields were falling at the end of January as negative data was released that gave investors the belief that the Fed would start reducing rates soon.
However, yields reversed direction once payroll data was released on February 2nd showing 353K jobs were added in January instead of the 180K that were expected. In addition, several members of the Federal Reserve started pushing back on the idea that they’re going to be reducing rates in the near-term.
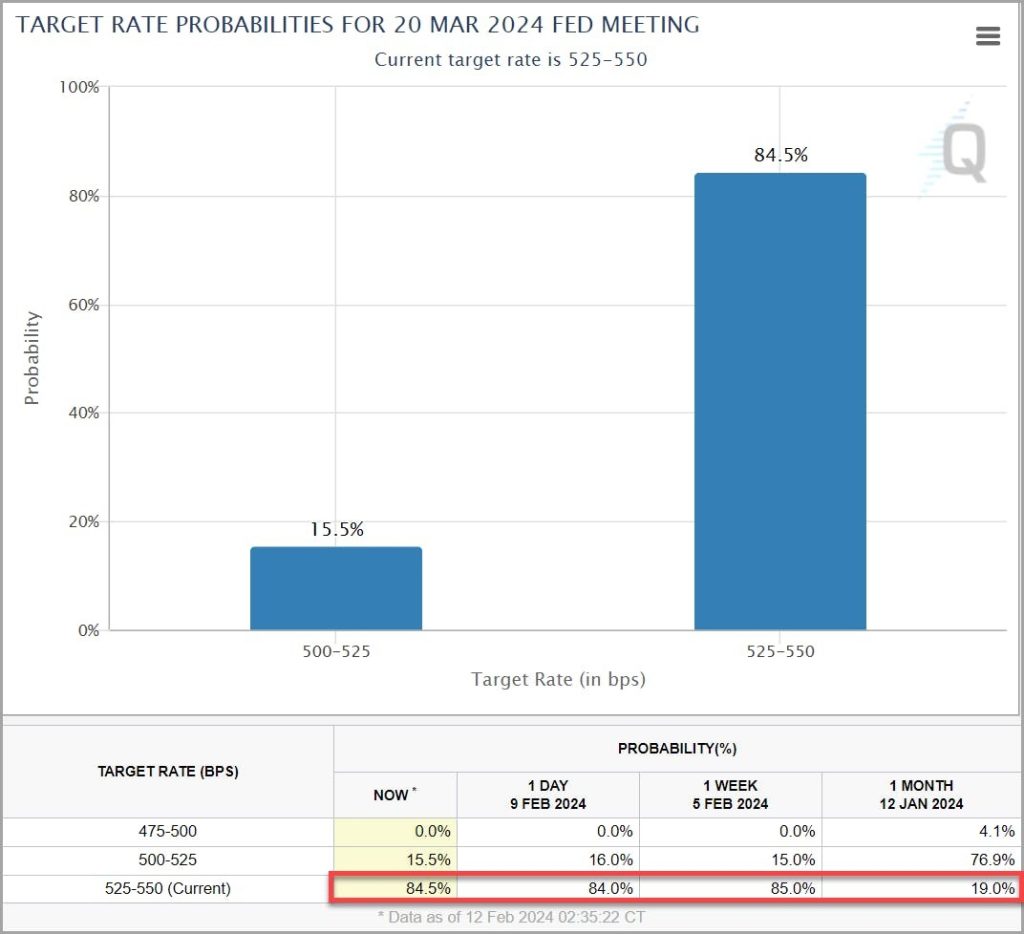
The chart below shows the projections for the Fed meeting in March. A month ago, the market was betting that there was only a 19% chance that the Fed would continue to leave rates unchanged through the March meeting, but that has now increased to 85%.
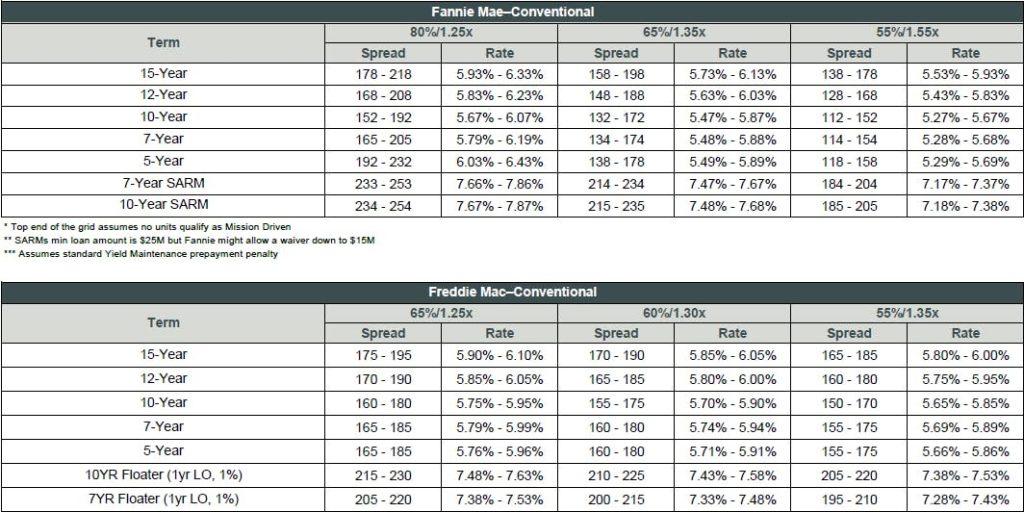
Agency Pricing Grids
The grid below was updated based on today’s rates. There are many factors influencing agency pricing including loan size, vintage, location, level of affordability, acquisition vs refi, etc. If you need a soft quote showing the loan sizing and pricing for your property, then please reply to this email.
Notable Trends
Last Friday, I reached out to GP’s and LP’s to ask if they saw any notable trends in January. Here are the top responses, grouped by asset type:
MULTIFAMILY
West Coast MF Investment Firm
• Although there’s a lot of variability, in general Bay Area rental traffic was seasonally slow, leading to greater than historical use of concessions and slightly negative rent growth.
• More coming to market; however, greater off-market activity as owners needing to sell are hoping to avoid airing their “dirty laundry.”
• Large bid/ask spread remains for most properties on the market.
• Majority of transactions closing are a “basis” play, so while the market talks about 5%+ cap rates, in-place cap rates are still sub-5% (at least in infill coastal markets).
Pacific Northwest Private Investor
• Vacancy up 2-3% – traffic has slowed and going back to having to work to get vacant units rented.
• Rehabbing all of our garden style assets (1990’s) and construction costs have gone up probably 15-20% since we began a couple years ago.
• I anticipate slowing NOI growth across our portfolio as expenses are increasing across the board. I’m underwriting flat to 3% NOI growth. Onsite staff is costing more. Our insurance premiums went up 15% YOY and are up 59% from 2022. Our stuff is mostly 90’s, and the one newer (2018) asset we have is flat since 2020 regarding premiums.
Large Institutional LP
• Groups are underwriting outsized rent growth in the outer years to reflect the supply drop off predicted in 2025+.
• Everyone at NMHC is a net buyer this year – no net sellers.
• Market may be overly optimistic on rate cuts this year.
• Insurance costs continue to rise and are a big issue on expense mgmt.
• Bad debt is increasing across our whole portfolio.
Multifamily Investor
• I’m seeing continued uptick of ongoing expenses especially insurance and sellers are becoming impatient with rising costs of inflation and debt, which is leading to conversations about selling and leaving what they perceive as money on the table.
National Developer
• I’ve seen increased LP equity and lender appetite. Equity groups are tired of sitting on the sidelines and want to find a way to make deals work. That said, the YOC needs to be 6.5%+ for urban MF, 6.75%+ for suburban MF, and 7%+ for industrial with a first or second band location.
• Banks are trying to get back in, but need to be realistic when it comes to requesting deposits. This should be good for life co’s that are doing construction loans – we are going to try to tap into that more this year, but find that life co’s can be a little tight on proceeds.
LP Equity Fund
• In general for multifamily I’ve seen operating expenses putting serious pressure on NOI. Repairs and maintenance are up and our forthcoming insurance premiums are up at minimum 25%.
• We have begun to see bad debt starting to increase.
Institutional Investor
• In general we are seeing construction costs dropping slightly in most markets (south FL being the exception where pricing is generally flat). Markets with less MF product in their pipeline as a % of the total product are seeing some of the sharpest cost decreases nationally.
• Denver continues to see modest rent growth despite the record supply. I was recently there with a few of our local partners and think that the record number of migrants are helping support the overall rental market.
Utah Developer
• In Salt Lake City, construction costs haven’t dropped much if at all, which has led to a lot of developers still remaining on pause. There are rumors of a few starts but we haven’t really seen them. If they are starting it has to be from very patient or long-term capital.
• Cap rates here seems to be somewhere between 5.25-5.5%. The only yield on cost that people are interested in for ground-up development is 6.5-7% which is very rare to find.
Large Institutional Investor
• In TX and FL, we’re finally seeing insurance renewals flatten out and in some cases retrace a bit.
California MF Property Manager
• There is a challenge with Class A property demand and supply. Class A property rent is stabilizing, but still lower than last year…and, the use of concessions of 6 to 8 weeks is common in core markets.
• Workforce, Class B and C properties, are performing; however, new Class A supply has created market rotation as tenants seek the best value for high-end properties that have great amenities.
California Developer
• It feels like asset management fires are waning and there is a renewed focus on new acquisitions.
• Development yields make no sense when compared to yields on existing product.
• Some of the most attractive deals today are the ones that started marketing processes 18 to 24 months ago.
• Institutional equity remains herded and unwilling to stretch.
Georgia Developer
• January was a fairly quiet month in the Savannah market, but has started picking up in February.
• Some lenders appetites are increasing, albeit solely relationship driven for the powder they do have.
• Construction costs are still high and starts of new projects continues to slow or not exist at the moment.
• Tenant demand in the Savannah market is still present, but tenants are starting to control the terms and demands as vacancy rates continue to increase.
Private Multifamily Investment Company
• Las Vegas has been really interesting. After months of being backed up with the courts, problematic tenants are finally out and our delinquent balances at each property have gone from $50-100k down to pretty much 0. The courts are working quickly in our favor and people are paying rent. We are seeing this across LV and cash flow is dramatically improving despite the fact that rents are still low.
• We are seeing increases in both physical and economic occupancy. January has been our best month in the last 12+ months. Traffic/tours/leasing is the best I’ve seen since pre-COVID.
• We are getting SLAMMED on insurance in Vegas. In properties where we have densely occupied buildings (ex: two buildings with 150 units each), we are getting crushed. Florida-type insurance increases.
Institutional LP Equity
• In land constrained/infill submarkets there continues to be such strong demand that pricing for core, stabilized acquisitions is well below accretive debt.
• Development remains difficult as land capitulation has been slow in core markets (really only looking at industrial/multi) while there has been some land price reduction it doesn’t seem to be enough for most deals to pencil.
• On a recent MF development deal in the Bay Area that we originally saw in Fall 2022, we’re seeing it again now and the developer got a significant land price reduction. They also saw low double digit reduction in total project costs over the past 1.5 years. This is one of the first tangible examples we’ve seen of a large decrease in construction costs. This is a trend folks have been postulating on for awhile as land pricing and financing costs have made development quite challenging – smaller pipelines means more availability of GC’s and more aggressive bids from subs.
West Coast Multifamily Investment Firm
• Not as many launches in the new year as hoped; holding or otherwise working it out behind the scenes still feels like the primary choice among potential sellers.
• Operations holding on better than expected (less concessions than anticipated, good leasing activity) but still expecting largely flat NOI in 2024
• Increased lender appetite seems to be compressing spreads by ~10 bps, but won’t know until it’s time to execute if that is real.
• Fading optimism for significant rate cuts in 2024, closer to the “higher for longer” mentality from last fall.
Family Office (LP Equity)
• New supply in Class A has led to flat or deteriorating rent growth in our Class A properties across most of the country for 2023 and 2024 expectations.
• On the other hand, we have seen a continuation of 5%+ rent growth at many of our Class B & C properties. We hypothesize that there will be a trickledown effect on our Class B & C properties from the new Class A supply, but this has yet to materialize.
West Coast Developer
• We saw a large uptick in traffic and transactions in the beginning of January, but then fell off a cliff. The SF market is still seeing a lot of concessions. Trade-outs / renewals are averaging around -10% at a lot of our properties.
• Operating expense ratios are off from what is traditionally expected (30%-40%), which is due to many reasons but some are increased need for longer security hours, rising payroll costs, and rising property insurance cost.
National Developer
• We’re seeing variations in construction costs for senior and multifamily housing across different markets, with a focus on Southern California and Seattle as we’re actively pricing development deals there.
• Recently, there’s been a noticeable softening in costs, indicated by subcontractors seeking work due to a slowdown in their late 2024 pipeline, a trend I’ve heard from other developers and architects. However, this softening is not uniform.
• In Southern California, construction costs continue to rise, albeit more slowly. I’d say this is due to the high cost of doing business in the state raising the floor on pricing.
• Conversely, Seattle is experiencing a willingness among subcontractors to lower their prices, attributed to a more pronounced decrease in housing starts compared to Southern California. I see some potential for further cost reductions as the market adjusts to the surplus from the 2021/2022 pipeline.
OFFICE
East Coast Investor
• While a lot has been said about the office slowdown and the precipitous drop in values (which are all true and real), over the last 6 months I’ve noticed smaller tenants (5-10k SF) be the most active I’ve ever seen. They’re snapping up pre-built suites at a record pace, driving pricing on Class A-/B+ commodity product up and providing a mini lifeline for a lot of landlords. The activity is not only prevalent in New York, but I’m also seeing it across the country.
• Coworking space is being snapped up extremely quickly too, and even in cities like SF which dominate the headlines, coworking is on average 90%+ occupied and spec suites are doing well.
So, is this enough to make a dramatic dent in both direct and shadow inventory – definitely not. However, it is a small bright spot in the office leasing market and something I see lenders paying attention to although many are still hesitant to fund pre-built inventory simply just because of their already-inflated bases in these assets.
The reality is that trophy product is doing well and large blocks are largely all occupied, so we’re seeing some trickle down to other parts of the market and this is one of them. Doesn’t mean there aren’t loads of obsolete buildings that have no potential, because there are. But I see a comeback for some levels of well-located and managed commodity office product.
Office Property Manager
• I’ve been a property manager in Washington, DC for 3+ years now. I’ve had responsibilities at 20+ office buildings (class A&B) totaling 3M+ sq ft of office/retail. In January, I finally saw a broker close on a deal for the first time in my career.
• I’ve seen lots of tenant move-outs and mortgage defaults, but will be completing my first tenant move-in in over 3 years.
California Developer
• Lots of interest in San Francisco office basis plays.
Bay Area Investor/Operator
• With owners of office in the Bay Area, there seems to be a common thread of “2024 is a really important year for us”. As in a make-or-break year, there isn’t going to be any more kicking the can, the rubber is meeting the road. I only note this as a change in trend because since the start of COVID the narrative has been to buy more time for the office market to improve via short term loan extensions, etc., but it feels like that time is officially running out, and this year is becoming critical for those with office exposure. Feels like we will see a big uptick in office distress by the end of this year.
INDUSTRIAL
West Coast Investor and Operator
• Industrial rent growth projections slowed is the most meaningful trend for January. Primarily I’m thinking of Sacramento, Reno, and especially Phoenix. Drivers are both slower leasing demand and a lot of supply being delivered spec.
• Leasing slipped for industrial as of last year, starting to see more activity late January into February. For the leasing we’ve been trading paper on this year, the rent escalations have slowed too. In Sacramento market was still 4% last year, this year down to 3%. Similar story in Reno.
• Flurry of marketed deals at the end of last year and the seasonal holiday lull, seeing more come to market late January, which is typical, but the trend continues for deals to come back to market after not hitting their price albeit less frequently for well positioned assets.
Institutional LP Equity
• Investor appetite for infill, Class A industrial remains very strong, a deal which Clarion is selling (Eden Rock – Hayward, CA) is tied up in the market now – had significant interest from our institutional peer set.
• Lender appetite, specifically in the debt fund space for core location class A industrial lease up plays (such as this) appears to be quite strong. This deal has a tenant paying well below market rent which will either vacate or downsize to +/- 50% (or less) of the building at their LEX in 11 months. As such many groups are underwriting debt fund style execution at closing – lots of capital chasing this deal profile, expected to be 60-65% LTV with 60-100% future funding of capex and leasing capital – expecting SOFR + low 300s.
Bay Area Industrial Developer/Operator
• Acceptance by sellers and selling brokers that exit caps are in the 6% range for underwriting purposes.
• General agreement that a speculative development deal needs to pencil to a return on cost of 7.0% or greater.
• Certain sellers who bought using yesterday’s assumptions such as ROC of 5% and exit cap of 4% are looking to exit their land positions at a loss.
• Sellers who are realistic on sale cap rates are able to transact as there is plenty of capital out there looking to buy industrial.
• The market is coming to accept that the current cap rate for sales of industrial is plus or minus 6%. Very few buyers are willing to take on negative leverage so I would say the fact that the 10-year treasury has ticked up in the last couple weeks is pushing cap rates up further than 6%.
California Developer
• It’s a tale of two cities in the Inland Empire big box industrial market. Lots of vacancy in the small box size range (i.e. <300k sq ft). Very little vacancy in the large box size range (>800k sq ft) with significant increases in tenant activity over the last month or so, tilting supply/demand dynamics in the favor of landlords.
• Banks continue to be choosy in the construction lending universe, mostly lending to existing relationships or to new relationships that bring material new deposits over to the bank. LifeCos remain active, but generally in the larger check size range. As a result, it’s generally difficult / expensive to get construction financing for mid-sized projects.
MISCELLANEOUS
Self-storage Developer
• We are seeing plenty of continued interest from small local/regional banks to lend on storage, both construction loans and perm loans.
• We are getting fixed rate pricing between 6.75% (stabilized) and 8.20% (construction).
• Purchases are generally stipped to 75% of as-stabilized value (will not include closing costs/fees)
• Loan sizing for construction is shaking out to +/- 65% LTC. Overall I’m just encouraged by the availability of bank debt for small storage deals in secondary & tertiary markets.
Family Office (LP Equity)
• On the hotel side, expenses have far outpaced RevPAR growth over the past few years at our full-service hotels. We are finally seeing expenses start to level out lending to some optimism around growing NOI and increasing margins.
About Brandon Roth & Lakebrook Capital
I’ve worked in the commercial real estate industry for 17 years. The last 10 years were spent with the #1 debt capital markets firm in the country (HFF/JLL) where I arranged debt and equity for all asset types. During this time, I had the opportunity to raise over $9.7B in capital for both institutional and private clients.
On May 1st, I left the nest and started Lakebrook Capital, Inc. I’m continuing to help clients with their financing needs, which most recently has been heavily focused on sourcing preferred equity and bridge debt.
In addition, I’m also spending time with lending relationships to assist with the distressed loans in their portfolio by either connecting them to a buyer to purchase the note/asset off-market, or to a local developer if a property needs to be managed or re-entitled (e.g. office to multifamily).

Recap Podcast
I started a podcast last week where I interview CRE capital providers about their company, buckets of capital, how they’re sizing and pricing deals, market outlook, etc. You can check out the first episode using the links below.
Spotify: https://t.co/XKQnIibJn2
Apple: https://podcasts.apple.com/us/podcast/recap-with-brandon-roth/id1729873750
About CRED iQ
CRED iQ is a commercial real estate data, analytics, and valuation platform providing actionable intelligence to CRE and capital markets investors. Subscribers use the platform to identify valuable leads for leasing, lending, refinancing, distressed debt, and acquisition opportunities.
The platform also offers a highly efficient valuation engine which can be leveraged across all property types and geographies. Our data platform is powered by over $2.0 trillion in transactions and data covering CRE, CMBS, CRE CLO, Single Asset Single Borrower (SASB), and all of GSE / Agency.
