
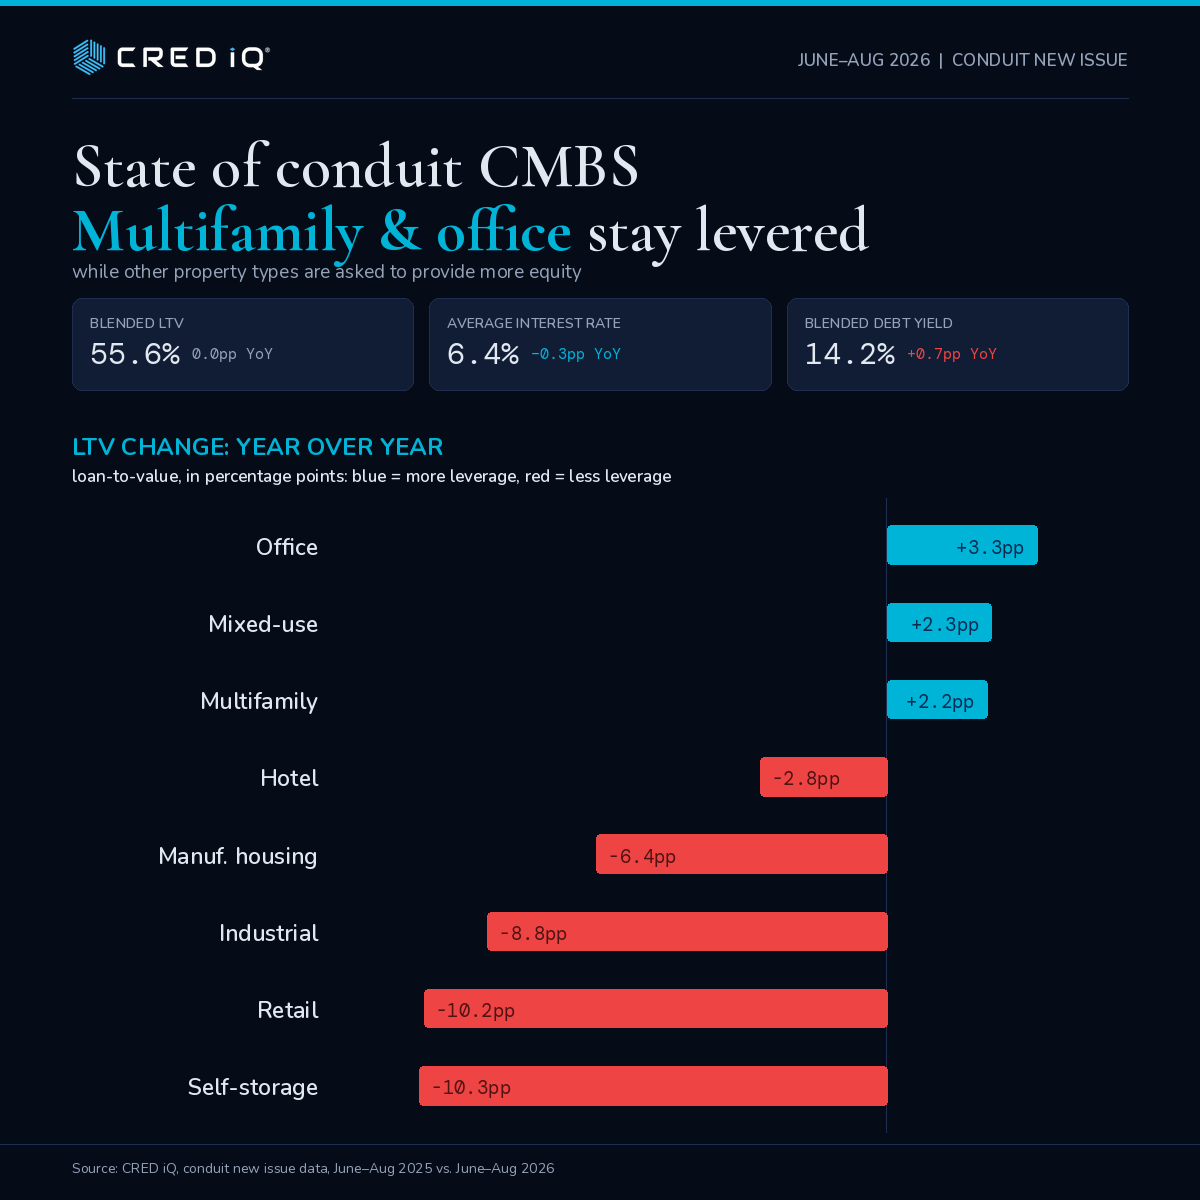
The latest conduit CMBS data reveal a lending market that has grown more selective, not more cautious. Rates broadly eased over the past year, yet borrowers in most property types are being asked to bring more equity to the table than they were twelve months ago. Multifamily and office are the exceptions, for different reasons, and increasingly the exceptions that define the cycle.

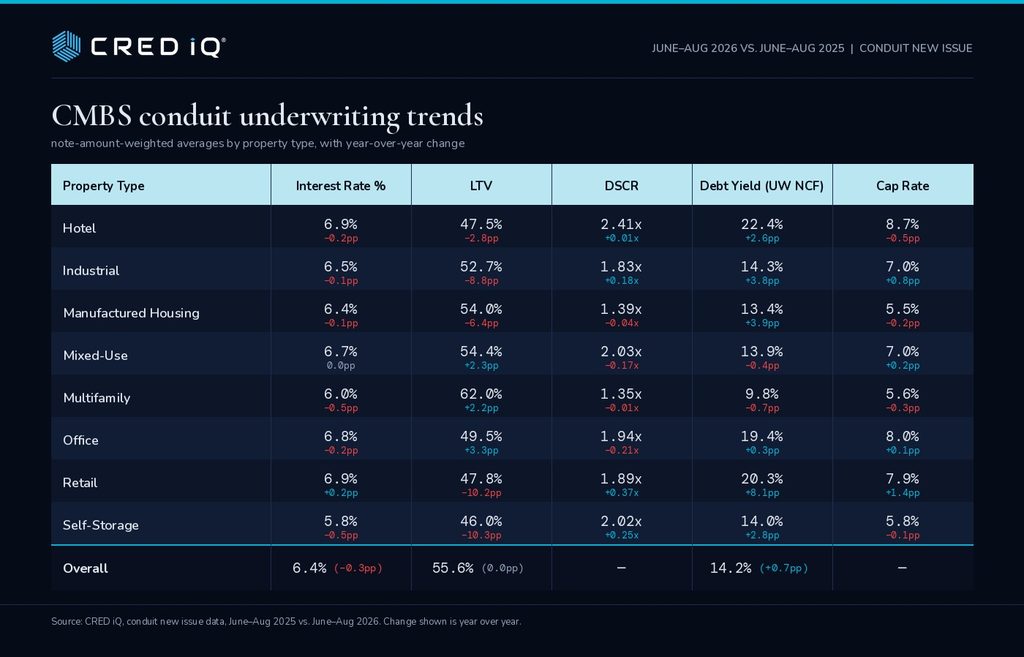
Source: CRED iQ, conduit new issue data, June–August 2025 vs. June–August 2026. Figures are note-amount-weighted averages.
Multifamily is the sector where issuers extended more credit on better terms. LTV climbed to 62.0%, up 2.2 points and the highest of any property type, while the rate on those loans fell the most in the entire sample, down a full half-point to 6.0%. Debt yield actually dropped slightly, meaning borrowers are covering less cushion per dollar borrowed even as leverage rose. That is about as clean a vote of confidence as a lending market gives.
Office also gained leverage, but the mechanics look different. LTV rose 3.3 points, to 49.5%, yet DSCR fell by more than two tenths of a turn, to 1.94x, and debt yield ticked up rather than down. Issuers are willing to lend more against office collateral, but they’re pricing that leverage with thinner coverage and a smaller margin for error, a bet that office cash flows have stabilized enough to underwrite more aggressively, not a wholesale return of confidence in the sector.
Everywhere else, the ask went the other direction, and more sharply. Retail’s LTV fell 10.2 points, to 47.8%, while its debt yield jumped 8.1 points, to 20.3%, the single largest swing in the table. Self-storage and industrial told a similar story: leverage down 6 to 10 points, debt yield and DSCR both up. None of these sectors are in distress; DSCR actually improved in each case. But issuers are structuring deals that require meaningfully more sponsor equity than they did a year ago, even as the underlying cost of debt got a little cheaper.
Hotel remains the market’s most watched holdout. Its debt yield, at 22.4%, is the highest of any category by a wide margin, and it rose again this year even as rate and LTV both eased at the edges. Lenders are still pricing in more downside than the headline rate suggests.
The blended LTV held flat at 55.6% both years, but that’s an artifact of mix, not stability. Multifamily’s share of loan count rose from roughly 31% to 43%. Strip that shift out, and the underlying message is unambiguous: capital is concentrating in multifamily and, more cautiously, office, while every other property type is being asked to fund the gap themselves.
This analysis reflects CRED iQ’s proprietary conduit new issue surveillance data for the periods indicated and is provided for informational purposes only. It does not constitute investment, legal, or financial advice. Figures are subject to revision as additional deal data becomes available.
About CRED iQ
CRED iQ is a commercial real estate data and analytics platform providing loan surveillance, valuation, and risk analytics across CMBS, agency (Fannie Mae, Freddie Mac, Ginnie Mae), and private-label CRE loan portfolios. Our proprietary data covers conduit, single-asset/single-borrower, and CRE CLO transactions, supporting investors, servicers, and researchers with timely, granular market intelligence.