
CRED iQ monitors distressed rates and market performance for nearly 400 MSAs across the United States, covering over $900 billion in outstanding commercial real estate (CRE) debt. Distressed rates (DQ + SS%) include loans that are specially serviced, delinquent, or a combination of both. Distressed rates and month-over-month changes for data reported as of March 2023 are presented below for the 50 largest MSAs, broken out by property type for a granular view of distress by market-sector.
Of the 50 largest MSAs tracked by CRED iQ, there were 28 markets that exhibited month-over-month decreases in the percentage of distressed CRE loans with an average individual market decline of 24 basis points compared to February 2023. Of the 22 MSAs exhibiting month-over-month increases in distressed rates, the average increase by market was 60 basis points. Notable markets with the largest improvements in the levels of distress this month included Birmingham, AL (-1.6%) and Pittsburgh (-1.2%). The San Francisco (+2.2%), Minneapolis (+2.0%), Chicago (+1.9%) MSAs were among the markets that exhibited the sharpest percentage increases in distressed commercial real estate loans during March 2023.
The Minneapolis MSA, with the second-highest increase in CRE distress during March 2023, notably ranked as the worst performing MSA among markets tracked by CRED iQ and has held that position since December 2022. Nearly 23% of commercial real estate loans in CRED iQ’s database that are secured by properties located in the Minneapolis MSA are delinquent or specially serviced. The outlying distressed rate for Minneapolis was reinforced this month by an impending maturity default of a loan secured by a 57-story downtown office tower with a significant retail component. In late-February 2023, a $154.4 million mortgage secured by the IDS Center transferred to special servicing due to an anticipated maturity default ahead of the loan’s May 2023 maturity date. The IDS Center is a 1.4 million-SF mixed-use property located in the Minneapolis Central Business District that consists primarily of office space with a sizeable retail component. Occupancy of the property has averaged approximately 75% for the past three years.
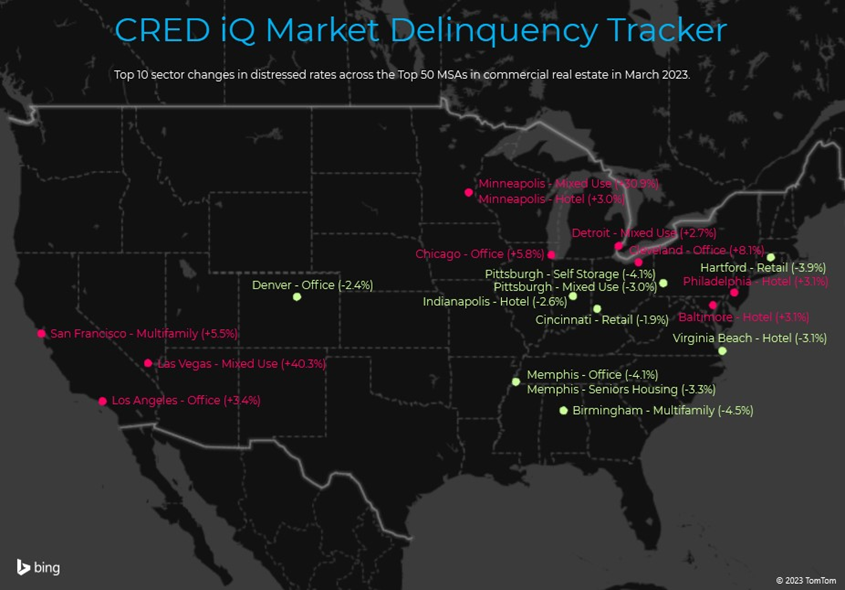
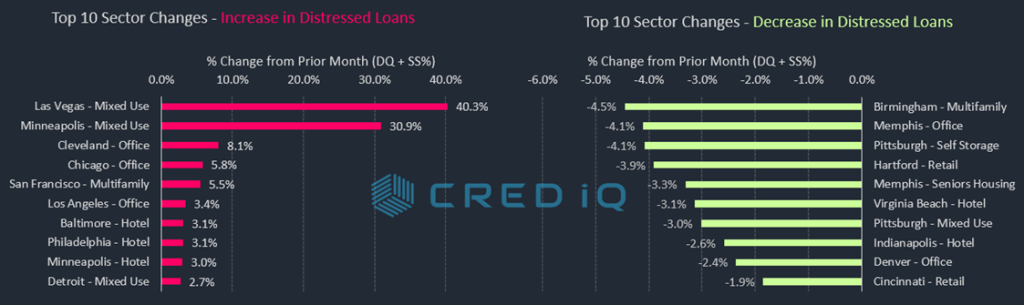
For additional granular analysis of the Top 50 markets, CRED iQ further delineated individual markets’ distressed rates by property type for a comprehensive view by market-sector. Increased distress in the mixed-use property type across major markets was a primary theme for March 2023. Three of the 10 highest increases in distress by market-sector across all property types and markets were mixed-use markets: Las Vegas – Mixed Use (+40.3%), Minneapolis – Mixed Use (+30.9%), and Detroit – Mixed Use (+2.7%). The Las Vegas – Mixed Use market-sector was impacted by a $325 million mortgage secured by fee and leasehold interests in the Hughes Center, a 20-property 1.5 million-SF office/retail campus located just off The Strip. The loan transferred to special servicing in March 2023. Occupancy at the Hughes Center was approximately 71% as of year-end 2022.
Aside from the Minneapolis MSA highlighted earlier, the following markets had the highest overall rates of distress among the Top 50 markets tracked by CRED iQ: Cleveland (10.2%), Birmingham (9.9%), Chicago (9.5%), and Milwaukee (8.9%). Compared to the prior month, Chicago displaced Charlotte in the list of Top 5 markets with the highest commercial real estate distress. The Salt Lake City market (0.2%) had the lowest percentage of distress among the Top 50 MSAs for the second consecutive month.
View commercial real estate distressed rates broken out by market and property type below:
| MSA – Property Type | DQ/SS (millions) | DS/SS (%) | Monthly Change |
| Allentown-Bethlehem-Easton, PA-NJ MSA | $78.0 | 2.4% | 0.0% |
| Allentown – Hotel | $1.2 | 3.3% | -0.9% |
| Allentown – Industrial | $0.0 | 0.0% | 0.0% |
| Allentown – Multifamily | $0.0 | 0.0% | 0.0% |
| Allentown – Office | $58.0 | 18.5% | 0.3% |
| Allentown – Other | $0.0 | 0.0% | 0.0% |
| Allentown – Retail | $18.9 | 5.1% | 0.0% |
| Allentown – Self Storage | $0.0 | 0.0% | 0.0% |
| Atlanta-Sandy Springs-Marietta, GA MSA | $454.4 | 1.6% | -0.3% |
| Atlanta – Hotel | $67.4 | 2.7% | -0.6% |
| Atlanta – Industrial | $0.0 | 0.0% | 0.0% |
| Atlanta – Multifamily | $0.0 | 0.0% | 0.0% |
| Atlanta – Office | $83.6 | 3.9% | 0.4% |
| Atlanta – Other | $0.0 | 0.0% | 0.0% |
| Atlanta – Retail | $303.4 | 14.5% | -2.9% |
| Atlanta – Self Storage | $0.0 | 0.0% | 0.0% |
| Austin-Round Rock, TX MSA | $117.1 | 1.2% | 0.1% |
| Austin – Hotel | $57.9 | 6.5% | 0.8% |
| Austin – Industrial | $0.0 | 0.0% | 0.0% |
| Austin – Multifamily | $0.0 | 0.0% | 0.0% |
| Austin – Office | $0.0 | 0.0% | 0.0% |
| Austin – Other | $4.1 | 1.0% | -0.4% |
| Austin – Retail | $55.1 | 6.9% | 0.5% |
| Austin – Self Storage | $0.0 | 0.0% | 0.0% |
| Baltimore-Towson, MD MSA | $307.6 | 3.2% | -0.5% |
| Baltimore – Hotel | $58.5 | 12.2% | 3.1% |
| Baltimore – Industrial | $0.0 | 0.0% | 0.0% |
| Baltimore – Multifamily | $3.8 | 0.1% | 0.0% |
| Baltimore – Office | $65.9 | 7.4% | 2.1% |
| Baltimore – Other | $11.5 | 5.5% | -0.6% |
| Baltimore – Retail | $168.0 | 15.4% | -7.3% |
| Baltimore – Self Storage | $0.0 | 0.0% | 0.0% |
| Birmingham-Hoover, AL MSA | $301.0 | 9.8% | -1.6% |
| Birmingham – Hotel | $10.3 | 9.2% | 0.0% |
| Birmingham – Industrial | $0.0 | 0.0% | 0.0% |
| Birmingham – Multifamily | $0.0 | 0.0% | -4.5% |
| Birmingham – Office | $120.8 | 23.6% | 0.1% |
| Birmingham – Other | $0.0 | 0.0% | 0.0% |
| Birmingham – Retail | $169.9 | 23.3% | 0.3% |
| Birmingham – Self Storage | $0.0 | 0.0% | 0.0% |
| Boston-Cambridge-Quincy, MA-NH MSA | $199.4 | 1.0% | 0.4% |
| Boston – Hotel | $56.3 | 3.3% | 2.1% |
| Boston – Industrial | $0.0 | 0.0% | 0.0% |
| Boston – Multifamily | $0.0 | 0.0% | 0.0% |
| Boston – Office | $50.3 | 0.7% | 0.5% |
| Boston – Other | $4.0 | 0.1% | 0.1% |
| Boston – Retail | $88.8 | 7.0% | 2.0% |
| Boston – Self Storage | $0.0 | 0.0% | 0.0% |
| Bridgeport-Stamford-Norwalk, CT MSA | $199.5 | 4.5% | -0.3% |
| Bridgeport – Hotel | $38.9 | 26.1% | -0.2% |
| Bridgeport – Industrial | $17.8 | 15.0% | 0.0% |
| Bridgeport – Multifamily | $0.0 | 0.0% | 0.0% |
| Bridgeport – Office | $133.0 | 11.0% | 0.0% |
| Bridgeport – Other | $9.8 | 2.6% | -0.7% |
| Bridgeport – Retail | $0.0 | 0.0% | 0.0% |
| Bridgeport – Self Storage | $0.0 | 0.0% | 0.0% |
| Charlotte-Gastonia-Concord, NC-SC MSA | $599.8 | 7.8% | 0.0% |
| Charlotte – Hotel | $47.3 | 5.3% | 0.0% |
| Charlotte – Industrial | $0.0 | 0.0% | 0.0% |
| Charlotte – Multifamily | $0.0 | 0.0% | 0.0% |
| Charlotte – Office | $354.2 | 36.7% | -1.8% |
| Charlotte – Other | $114.8 | 36.3% | 0.0% |
| Charlotte – Retail | $83.4 | 8.7% | -0.3% |
| Charlotte – Self Storage | $0.0 | 0.0% | 0.0% |
| Chicago-Naperville-Joliet, IL-IN-WI MSA | $2,798.1 | 9.5% | 1.9% |
| Chicago – Hotel | $739.3 | 40.6% | 8.6% |
| Chicago – Industrial | $0.0 | 0.0% | 0.0% |
| Chicago – Multifamily | $54.4 | 0.6% | -0.1% |
| Chicago – Office | $1,562.9 | 18.4% | 5.8% |
| Chicago – Other | $208.2 | 8.6% | 0.4% |
| Chicago – Retail | $233.2 | 7.2% | 0.3% |
| Chicago – Self Storage | $0.0 | 0.0% | 0.0% |
| Cincinnati-Middletown, OH-KY-IN MSA | $126.9 | 3.1% | -0.4% |
| Cincinnati – Hotel | $86.9 | 30.2% | 0.0% |
| Cincinnati – Industrial | $0.0 | 0.0% | 0.0% |
| Cincinnati – Multifamily | $0.0 | 0.0% | 0.0% |
| Cincinnati – Office | $0.0 | 0.0% | 0.0% |
| Cincinnati – Other | $6.8 | 2.6% | 0.0% |
| Cincinnati – Retail | $33.3 | 6.1% | -1.9% |
| Cincinnati – Self Storage | $0.0 | 0.0% | 0.0% |
| Cleveland-Elyria-Mentor, OH MSA | $428.4 | 10.2% | 1.8% |
| Cleveland – Hotel | $84.5 | 46.5% | 0.0% |
| Cleveland – Industrial | $0.0 | 0.0% | 0.0% |
| Cleveland – Multifamily | $0.0 | 0.0% | 0.0% |
| Cleveland – Office | $164.5 | 18.2% | 8.1% |
| Cleveland – Other | $171.7 | 43.0% | 0.0% |
| Cleveland – Retail | $7.6 | 1.1% | 0.0% |
| Cleveland – Self Storage | $0.0 | 0.0% | 0.0% |
| Columbus, OH MSA | $184.5 | 2.7% | 0.0% |
| Columbus, OH – Hotel | $19.7 | 6.8% | -0.4% |
| Columbus, OH – Industrial | $0.0 | 0.0% | 0.0% |
| Columbus, OH – Multifamily | $0.0 | 0.0% | 0.0% |
| Columbus, OH – Office | $57.4 | 8.3% | -0.8% |
| Columbus, OH – Other | $0.0 | 0.0% | 0.0% |
| Columbus, OH – Retail | $107.4 | 12.8% | -0.1% |
| Columbus, OH – Self Storage | $0.0 | 0.0% | 0.0% |
| Dallas-Fort Worth-Arlington, TX MSA | $264.3 | 0.7% | 0.1% |
| Dallas – Hotel | $68.7 | 2.0% | 0.0% |
| Dallas – Industrial | $0.0 | 0.0% | -0.2% |
| Dallas – Multifamily | $8.5 | 0.0% | 0.0% |
| Dallas – Office | $139.3 | 4.7% | 0.9% |
| Dallas – Other | $10.2 | 0.5% | 0.2% |
| Dallas – Retail | $37.6 | 1.8% | 0.6% |
| Dallas – Self Storage | $0.0 | 0.0% | 0.0% |
| Denver-Aurora, CO MSA | $811.7 | 5.0% | -0.4% |
| Denver – Hotel | $18.8 | 2.1% | -0.4% |
| Denver – Industrial | $0.0 | 0.0% | 0.0% |
| Denver – Multifamily | $0.0 | 0.0% | 0.0% |
| Denver – Office | $652.7 | 30.6% | -2.4% |
| Denver – Other | $94.0 | 9.9% | 0.0% |
| Denver – Retail | $46.2 | 3.5% | 0.0% |
| Denver – Self Storage | $0.0 | 0.0% | 0.0% |
| Detroit-Warren-Livonia, MI MSA | $291.6 | 2.7% | 0.2% |
| Detroit – Hotel | $83.9 | 11.8% | 0.1% |
| Detroit – Industrial | $19.7 | 3.2% | -0.1% |
| Detroit – Multifamily | $3.2 | 0.1% | 0.1% |
| Detroit – Office | $20.3 | 0.8% | 0.0% |
| Detroit – Other | $22.5 | 2.7% | 2.7% |
| Detroit – Retail | $142.2 | 9.6% | -0.2% |
| Detroit – Self Storage | $0.0 | 0.0% | 0.0% |
| Hartford-West Hartford-East Hartford, CT MSA | $193.9 | 7.5% | 0.0% |
| Hartford – Hotel | $43.0 | 37.0% | -0.7% |
| Hartford – Industrial | $0.0 | 0.0% | 0.0% |
| Hartford – Multifamily | $0.0 | 0.0% | 0.0% |
| Hartford – Office | $24.9 | 8.7% | -0.4% |
| Hartford – Other | $0.0 | 0.0% | 0.0% |
| Hartford – Retail | $126.0 | 38.7% | -3.9% |
| Hartford – Self Storage | $0.0 | 0.0% | 0.0% |
| Houston-Sugar Land-Baytown, TX MSA | $1,237.0 | 4.7% | 0.3% |
| Houston – Hotel | $472.0 | 48.3% | 2.4% |
| Houston – Industrial | $28.3 | 4.6% | -0.6% |
| Houston – Multifamily | $22.6 | 0.1% | 0.1% |
| Houston – Office | $564.2 | 16.1% | 2.1% |
| Houston – Other | $65.9 | 11.2% | 0.5% |
| Houston – Retail | $84.0 | 2.1% | 0.0% |
| Houston – Self Storage | $0.0 | 0.0% | 0.0% |
| Indianapolis-Carmel, IN MSA | $157.8 | 2.6% | -0.4% |
| Indianapolis – Hotel | $95.7 | 15.6% | -2.6% |
| Indianapolis – Industrial | $0.0 | 0.0% | 0.0% |
| Indianapolis – Multifamily | $0.0 | 0.0% | 0.0% |
| Indianapolis – Office | $59.9 | 9.6% | -0.7% |
| Indianapolis – Other | $0.0 | 0.0% | 0.0% |
| Indianapolis – Retail | $2.3 | 0.6% | -1.0% |
| Indianapolis – Self Storage | $0.0 | 0.0% | 0.0% |
| Jacksonville, FL MSA | $111.9 | 2.1% | 0.1% |
| Jacksonville – Hotel | $0.0 | 0.0% | 0.0% |
| Jacksonville – Industrial | $0.0 | 0.0% | 0.0% |
| Jacksonville – Multifamily | $0.0 | 0.0% | 0.0% |
| Jacksonville – Office | $0.0 | 0.0% | 0.0% |
| Jacksonville – Other | $0.0 | 0.0% | 0.0% |
| Jacksonville – Retail | $111.9 | 28.9% | 0.3% |
| Jacksonville – Self Storage | $0.0 | 0.0% | 0.0% |
| Kansas City, MO-KS MSA | $102.9 | 1.8% | 0.3% |
| Kansas City – Hotel | $29.8 | 12.4% | -0.2% |
| Kansas City – Industrial | $0.0 | 0.0% | 0.0% |
| Kansas City – Multifamily | $3.8 | 0.1% | 0.0% |
| Kansas City – Office | $0.0 | 0.0% | 0.0% |
| Kansas City – Other | $20.9 | 10.5% | 10.5% |
| Kansas City – Retail | $48.4 | 8.5% | 0.0% |
| Kansas City – Self Storage | $0.0 | 0.0% | 0.0% |
| Las Vegas-Paradise, NV MSA | $582.2 | 2.5% | 1.4% |
| Las Vegas – Hotel | $0.0 | 0.0% | 0.0% |
| Las Vegas – Industrial | $0.0 | 0.0% | 0.0% |
| Las Vegas – Multifamily | $0.0 | 0.0% | 0.0% |
| Las Vegas – Office | $0.0 | 0.0% | 0.0% |
| Las Vegas – Other | $325.0 | 40.3% | 40.3% |
| Las Vegas – Retail | $257.2 | 7.0% | 0.4% |
| Las Vegas – Self Storage | $0.0 | 0.0% | 0.0% |
| Los Angeles-Long Beach-Santa Ana, CA MSA | $1,661.8 | 3.1% | 0.6% |
| Los Angeles – Hotel | $84.0 | 1.5% | 0.0% |
| Los Angeles – Industrial | $0.0 | 0.0% | 0.0% |
| Los Angeles – Multifamily | $1.6 | 0.0% | -1.3% |
| Los Angeles – Office | $453.1 | 3.7% | 3.4% |
| Los Angeles – Other | $116.4 | 3.4% | 0.8% |
| Los Angeles – Retail | $999.0 | 15.6% | 2.0% |
| Los Angeles – Self Storage | $7.7 | 0.9% | 0.9% |
| Louisville/Jefferson County, KY-IN MSA | $70.4 | 2.3% | 0.0% |
| Louisville – Hotel | $0.0 | 0.0% | 0.0% |
| Louisville – Industrial | $0.0 | 0.0% | 0.0% |
| Louisville – Multifamily | $0.0 | 0.0% | 0.0% |
| Louisville – Office | $0.0 | 0.0% | 0.0% |
| Louisville – Other | $0.0 | 0.0% | 0.0% |
| Louisville – Retail | $70.4 | 13.9% | -0.6% |
| Louisville – Self Storage | $0.0 | 0.0% | 0.0% |
| Memphis, TN-AR-MS MSA | $78.9 | 3.2% | -0.5% |
| Memphis – Hotel | $13.3 | 6.0% | -0.2% |
| Memphis – Industrial | $0.0 | 0.0% | 0.0% |
| Memphis – Multifamily | $0.0 | 0.0% | 0.0% |
| Memphis – Office | $0.0 | 0.0% | -4.1% |
| Memphis – Other | $5.3 | 14.7% | -3.3% |
| Memphis – Retail | $60.3 | 16.4% | -0.2% |
| Memphis – Self Storage | $0.0 | 0.0% | 0.0% |
| Miami-Fort Lauderdale-Pompano Beach, FL MSA | $260.9 | 1.0% | -0.1% |
| Miami – Hotel | $40.4 | 0.8% | 0.0% |
| Miami – Industrial | $0.0 | 0.0% | 0.0% |
| Miami – Multifamily | $0.0 | 0.0% | 0.0% |
| Miami – Office | $4.1 | 0.1% | 0.0% |
| Miami – Other | $0.0 | 0.0% | 0.0% |
| Miami – Retail | $216.4 | 3.8% | -0.6% |
| Miami – Self Storage | $0.0 | 0.0% | 0.0% |
| Milwaukee-Waukesha-West Allis, WI MSA | $218.6 | 8.9% | 0.0% |
| Milwaukee – Hotel | $16.6 | 10.3% | -0.8% |
| Milwaukee – Industrial | $0.0 | 0.0% | 0.0% |
| Milwaukee – Multifamily | $0.0 | 0.0% | 0.0% |
| Milwaukee – Office | $96.5 | 17.7% | 0.0% |
| Milwaukee – Other | $0.0 | 0.0% | 0.0% |
| Milwaukee – Retail | $105.6 | 23.1% | -0.1% |
| Milwaukee – Self Storage | $0.0 | 0.0% | 0.0% |
| Minneapolis-St. Paul-Bloomington, MN-WI MSA | $1,918.7 | 22.7% | 2.0% |
| Minneapolis – Hotel | $272.1 | 44.6% | 3.0% |
| Minneapolis – Industrial | $0.0 | 0.0% | 0.0% |
| Minneapolis – Multifamily | $0.0 | 0.0% | -0.7% |
| Minneapolis – Office | $88.0 | 4.4% | 1.1% |
| Minneapolis – Other | $158.6 | 31.8% | 30.9% |
| Minneapolis – Retail | $1,400.0 | 74.1% | -0.8% |
| Minneapolis – Self Storage | $0.0 | 0.0% | 0.0% |
| Nashville-Davidson-Murfreesboro-Franklin, TN MSA | $64.7 | 1.1% | 0.0% |
| Nashville – Hotel | $51.6 | 3.5% | 0.0% |
| Nashville – Industrial | $0.0 | 0.0% | 0.0% |
| Nashville – Multifamily | $0.0 | 0.0% | 0.0% |
| Nashville – Office | $0.0 | 0.0% | 0.0% |
| Nashville – Other | $0.0 | 0.0% | 0.0% |
| Nashville – Retail | $13.1 | 1.8% | 0.0% |
| Nashville – Self Storage | $0.0 | 0.0% | 0.0% |
| New Orleans-Metairie-Kenner, LA MSA | $122.1 | 3.4% | -0.3% |
| New Orleans – Hotel | $59.9 | 5.2% | -0.1% |
| New Orleans – Industrial | $0.0 | 0.0% | 0.0% |
| New Orleans – Multifamily | $8.3 | 0.9% | 0.0% |
| New Orleans – Office | $27.0 | 5.0% | -0.3% |
| New Orleans – Other | $14.7 | 9.6% | 0.0% |
| New Orleans – Retail | $12.2 | 1.8% | -1.4% |
| New Orleans – Self Storage | $0.0 | 0.0% | 0.0% |
| New York-Northern New Jersey-Long Island, NY-NJ-PA MSA | $7,097.6 | 5.3% | 0.6% |
| New York City – Hotel | $832.7 | 20.2% | 0.6% |
| New York City – Industrial | $120.3 | 3.0% | -0.1% |
| New York City – Multifamily | $771.4 | 2.1% | 0.7% |
| New York City – Office | $1,428.9 | 2.9% | -0.1% |
| New York City – Other | $1,577.9 | 6.9% | 0.2% |
| New York City – Retail | $2,366.3 | 18.2% | 2.4% |
| New York City – Self Storage | $0.0 | 0.0% | 0.0% |
| Orlando-Kissimmee, FL MSA | $106.9 | 1.0% | -0.1% |
| Orlando – Hotel | $20.9 | 0.8% | -0.3% |
| Orlando – Industrial | $0.0 | 0.0% | 0.0% |
| Orlando – Multifamily | $0.0 | 0.0% | 0.0% |
| Orlando – Office | $57.7 | 13.3% | -0.3% |
| Orlando – Other | $0.0 | 0.0% | 0.0% |
| Orlando – Retail | $28.4 | 3.2% | 0.0% |
| Orlando – Self Storage | $0.0 | 0.0% | 0.0% |
| Philadelphia-Camden-Wilmington, PA-NJ-DE-MD MSA | $900.2 | 4.3% | 0.2% |
| Philadelphia – Hotel | $134.1 | 14.4% | 3.1% |
| Philadelphia – Industrial | $10.3 | 0.3% | 0.0% |
| Philadelphia – Multifamily | $41.1 | 0.4% | 0.0% |
| Philadelphia – Office | $306.6 | 7.7% | 0.6% |
| Philadelphia – Other | $389.0 | 31.0% | -0.6% |
| Philadelphia – Retail | $19.1 | 0.9% | -0.2% |
| Philadelphia – Self Storage | $0.0 | 0.0% | 0.0% |
| Phoenix-Mesa-Scottsdale, AZ MSA | $236.4 | 1.2% | 0.0% |
| Phoenix – Hotel | $33.0 | 1.9% | 0.0% |
| Phoenix – Industrial | $0.0 | 0.0% | 0.0% |
| Phoenix – Multifamily | $0.0 | 0.0% | 0.0% |
| Phoenix – Office | $55.6 | 2.4% | -0.1% |
| Phoenix – Other | $8.5 | 0.9% | 0.0% |
| Phoenix – Retail | $139.3 | 6.5% | 0.4% |
| Phoenix – Self Storage | $0.0 | 0.0% | 0.0% |
| Pittsburgh, PA MSA | $243.8 | 5.1% | -1.2% |
| Pittsburgh – Hotel | $26.6 | 12.8% | 0.0% |
| Pittsburgh – Industrial | $0.0 | 0.0% | 0.0% |
| Pittsburgh – Multifamily | $0.0 | 0.0% | -1.6% |
| Pittsburgh – Office | $104.0 | 9.3% | -0.7% |
| Pittsburgh – Other | $105.4 | 30.0% | -3.0% |
| Pittsburgh – Retail | $7.8 | 1.3% | 0.0% |
| Pittsburgh – Self Storage | $0.0 | 0.0% | -4.1% |
| Portland-Vancouver-Beaverton, OR-WA MSA | $359.3 | 4.1% | 0.4% |
| Portland – Hotel | $296.0 | 33.3% | 0.0% |
| Portland – Industrial | $0.0 | 0.0% | 0.0% |
| Portland – Multifamily | $38.1 | 0.9% | 0.9% |
| Portland – Office | $25.2 | 5.1% | -0.1% |
| Portland – Other | $0.0 | 0.0% | 0.0% |
| Portland – Retail | $0.0 | 0.0% | 0.0% |
| Portland – Self Storage | $0.0 | 0.0% | 0.0% |
| Raleigh-Cary, NC MSA | $32.4 | 0.9% | 0.0% |
| Raleigh – Hotel | $15.3 | 6.2% | -0.5% |
| Raleigh – Industrial | $0.0 | 0.0% | 0.0% |
| Raleigh – Multifamily | $0.0 | 0.0% | 0.0% |
| Raleigh – Office | $0.0 | 0.0% | 0.0% |
| Raleigh – Other | $6.6 | 3.6% | 0.0% |
| Raleigh – Retail | $10.6 | 3.8% | -0.1% |
| Raleigh – Self Storage | $0.0 | 0.0% | 0.0% |
| Richmond, VA MSA | $157.6 | 4.7% | -0.1% |
| Richmond – Hotel | $0.0 | 0.0% | 0.0% |
| Richmond – Industrial | $0.0 | 0.0% | 0.0% |
| Richmond – Multifamily | $0.0 | 0.0% | 0.0% |
| Richmond – Office | $0.0 | 0.0% | 0.0% |
| Richmond – Other | $12.8 | 8.8% | 0.0% |
| Richmond – Retail | $144.7 | 30.9% | -0.2% |
| Richmond – Self Storage | $0.0 | 0.0% | 0.0% |
| Riverside-San Bernardino-Ontario, CA MSA | $301.4 | 2.9% | 0.0% |
| Riverside – Hotel | $52.2 | 11.6% | -0.1% |
| Riverside – Industrial | $0.0 | 0.0% | 0.0% |
| Riverside – Multifamily | $0.0 | 0.0% | 0.0% |
| Riverside – Office | $0.0 | 0.0% | 0.0% |
| Riverside – Other | $0.0 | 0.0% | 0.0% |
| Riverside – Retail | $249.2 | 12.4% | 0.1% |
| Riverside – Self Storage | $0.0 | 0.0% | 0.0% |
| Sacramento-Arden-Arcade-Roseville, CA MSA | $17.0 | 0.3% | 0.0% |
| Sacramento – Hotel | $0.0 | 0.0% | 0.0% |
| Sacramento – Industrial | $0.0 | 0.0% | 0.0% |
| Sacramento – Multifamily | $0.0 | 0.0% | 0.0% |
| Sacramento – Office | $6.1 | 0.8% | 0.0% |
| Sacramento – Other | $10.9 | 2.8% | 0.0% |
| Sacramento – Retail | $0.0 | 0.0% | 0.0% |
| Sacramento – Self Storage | $0.0 | 0.0% | 0.0% |
| Salt Lake City, UT MSA | $9.3 | 0.2% | 0.1% |
| Salt Lake City – Hotel | $6.1 | 1.9% | -0.2% |
| Salt Lake City – Industrial | $0.0 | 0.0% | 0.0% |
| Salt Lake City – Multifamily | $0.0 | 0.0% | 0.0% |
| Salt Lake City – Office | $0.0 | 0.0% | 0.0% |
| Salt Lake City – Other | $0.0 | 0.0% | 0.0% |
| Salt Lake City – Retail | $3.2 | 0.4% | 0.4% |
| Salt Lake City – Self Storage | $0.0 | 0.0% | 0.0% |
| San Antonio, TX MSA | $132.3 | 2.0% | -0.1% |
| San Antonio – Hotel | $17.4 | 6.9% | -0.1% |
| San Antonio – Industrial | $0.0 | 0.0% | 0.0% |
| San Antonio – Multifamily | $0.0 | 0.0% | 0.0% |
| San Antonio – Office | $0.0 | 0.0% | 0.0% |
| San Antonio – Other | $0.0 | 0.0% | 0.0% |
| San Antonio – Retail | $114.9 | 14.8% | 0.1% |
| San Antonio – Self Storage | $0.0 | 0.0% | 0.0% |
| San Diego-Carlsbad-San Marcos, CA MSA | $46.3 | 0.4% | 0.0% |
| San Diego – Hotel | $39.3 | 2.0% | 0.0% |
| San Diego – Industrial | $0.0 | 0.0% | 0.0% |
| San Diego – Multifamily | $4.1 | 0.1% | 0.0% |
| San Diego – Office | $0.0 | 0.0% | 0.0% |
| San Diego – Other | $0.0 | 0.0% | 0.0% |
| San Diego – Retail | $2.9 | 0.2% | 0.0% |
| San Diego – Self Storage | $0.0 | 0.0% | 0.0% |
| San Francisco-Oakland-Fremont, CA MSA | $836.2 | 3.2% | 2.2% |
| San Francisco – Hotel | $100.6 | 3.3% | 0.0% |
| San Francisco – Industrial | $0.0 | 0.0% | 0.0% |
| San Francisco – Multifamily | $447.6 | 5.7% | 5.5% |
| San Francisco – Office | $197.8 | 2.0% | 1.5% |
| San Francisco – Other | $38.6 | 1.4% | 0.0% |
| San Francisco – Retail | $51.6 | 4.5% | -0.9% |
| San Francisco – Self Storage | $0.0 | 0.0% | 0.0% |
| San Jose-Sunnyvale-Santa Clara, CA MSA | $58.5 | 0.3% | 0.0% |
| San Jose – Hotel | $35.3 | 0.5% | 0.0% |
| San Jose – Industrial | $0.0 | 0.0% | 0.0% |
| San Jose – Multifamily | $0.0 | 0.0% | 0.0% |
| San Jose – Office | $23.2 | 0.3% | 0.0% |
| San Jose – Other | $0.0 | 0.0% | 0.0% |
| San Jose – Retail | $0.0 | 0.0% | 0.0% |
| San Jose – Self Storage | $0.0 | 0.0% | 0.0% |
| Seattle-Tacoma-Bellevue, WA MSA | $61.3 | 0.3% | 0.0% |
| Seattle – Hotel | $61.3 | 4.3% | 0.0% |
| Seattle – Industrial | $0.0 | 0.0% | 0.0% |
| Seattle – Multifamily | $0.0 | 0.0% | 0.0% |
| Seattle – Office | $0.0 | 0.0% | 0.0% |
| Seattle – Other | $0.0 | 0.0% | 0.0% |
| Seattle – Retail | $0.0 | 0.0% | 0.0% |
| Seattle – Self Storage | $0.0 | 0.0% | 0.0% |
| St. Louis, MO-IL MSA | $208.7 | 4.8% | 0.0% |
| St. Louis – Hotel | $1.7 | 0.5% | 0.0% |
| St. Louis – Industrial | $0.0 | 0.0% | 0.0% |
| St. Louis – Multifamily | $3.2 | 0.2% | 0.0% |
| St. Louis – Office | $0.0 | 0.0% | 0.0% |
| St. Louis – Other | $14.0 | 2.8% | 0.0% |
| St. Louis – Retail | $189.8 | 19.8% | -0.5% |
| St. Louis – Self Storage | $0.0 | 0.0% | 0.0% |
| Tampa-St. Petersburg-Clearwater, FL MSA | $116.2 | 1.1% | 0.0% |
| Tampa – Hotel | $58.9 | 8.2% | 0.1% |
| Tampa – Industrial | $0.0 | 0.0% | 0.0% |
| Tampa – Multifamily | $0.0 | 0.0% | 0.0% |
| Tampa – Office | $19.6 | 2.6% | 0.0% |
| Tampa – Other | $0.0 | 0.0% | 0.0% |
| Tampa – Retail | $37.7 | 5.0% | -0.1% |
| Tampa – Self Storage | $0.0 | 0.0% | 0.0% |
| Tucson, AZ MSA | $156.9 | 4.4% | -0.1% |
| Tucson – Hotel | $0.0 | 0.0% | 0.0% |
| Tucson – Industrial | $0.0 | 0.0% | 0.0% |
| Tucson – Multifamily | $0.0 | 0.0% | 0.0% |
| Tucson – Office | $0.0 | 0.0% | 0.0% |
| Tucson – Other | $0.0 | 0.0% | 0.0% |
| Tucson – Retail | $156.9 | 18.9% | 0.1% |
| Tucson – Self Storage | $0.0 | 0.0% | 0.0% |
| Virginia Beach-Norfolk-Newport News, VA-NC MSA | $190.2 | 3.9% | -0.3% |
| Virginia Beach – Hotel | $22.1 | 4.9% | -3.1% |
| Virginia Beach – Industrial | $0.0 | 0.0% | 0.0% |
| Virginia Beach – Multifamily | $0.0 | 0.0% | 0.0% |
| Virginia Beach – Office | $0.0 | 0.0% | 0.0% |
| Virginia Beach – Other | $4.4 | 3.5% | 0.1% |
| Virginia Beach – Retail | $163.6 | 19.1% | 0.0% |
| Virginia Beach – Self Storage | $0.0 | 0.0% | 0.0% |
| Washington-Arlington-Alexandria, DC-VA-MD-WV MSA | $844.9 | 2.6% | 0.6% |
| Washington, DC – Hotel | $31.2 | 2.9% | -0.4% |
| Washington, DC – Industrial | $0.0 | 0.0% | 0.0% |
| Washington, DC – Multifamily | $0.0 | 0.0% | 0.0% |
| Washington, DC – Office | $640.5 | 8.4% | 1.8% |
| Washington, DC – Other | $38.7 | 2.7% | 0.0% |
| Washington, DC – Retail | $134.5 | 3.9% | 1.7% |
| Washington, DC – Self Storage | $0.0 | 0.0% | 0.0% |
| Grand Total | $26,057.8 | 3.5% | 0.4% |
About CRED iQ
CRED iQ is a commercial real estate data, analytics, and valuation platform providing actionable intelligence to CRE and capital markets investors. Subscribers use the platform to identify valuable leads for leasing, lending, refinancing, distressed debt, and acquisition opportunities.
The platform also offers a highly efficient valuation engine which can be leveraged across all property types and geographies. Our data platform is powered by over $2.0 trillion in transactions and data covering CRE, CMBS, CRE CLO, Single Asset Single Borrower (SASB), and all of GSE / Agency.
