Home Blog Page 3

Comparing REO Levels (Today vs Great Financial Crisis)

0

Today’s Q2 2025 REO (real estate owned) balances across property sectors are substantially lower than the peaks witnessed during the great financial crisis of 2008-2012, signaling a more resilient CRE environment and improved asset quality for lenders and investors. As a reminder, REO assets refers to properties (such as office buildings, retail spaces, industrial facilities, or multifamily units) that have been foreclosed upon by a lender—typically a bank or financial institution—and are now directly owned by that lender after an unsuccessful foreclosure auction or when the borrower defaults on their loan.

Q2 2025 vs. GFC REO Levels

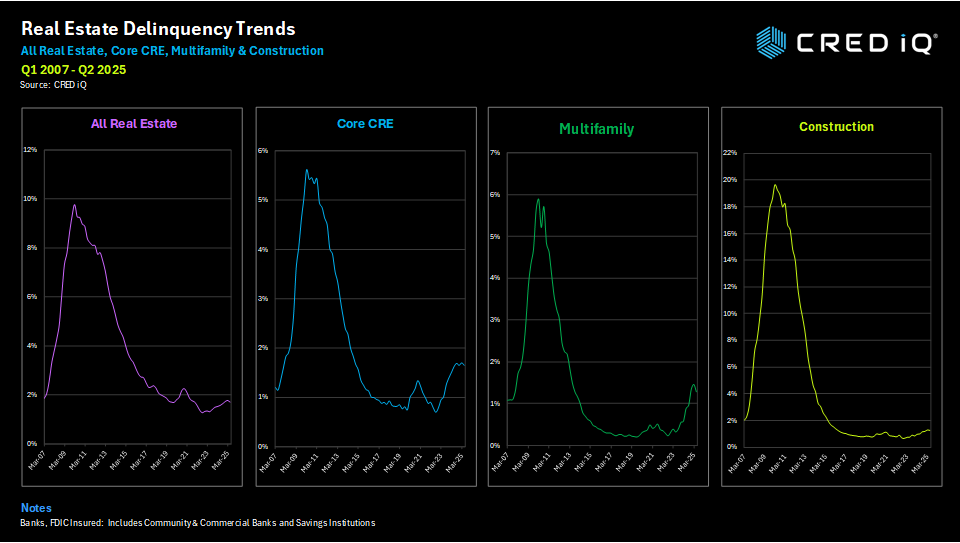
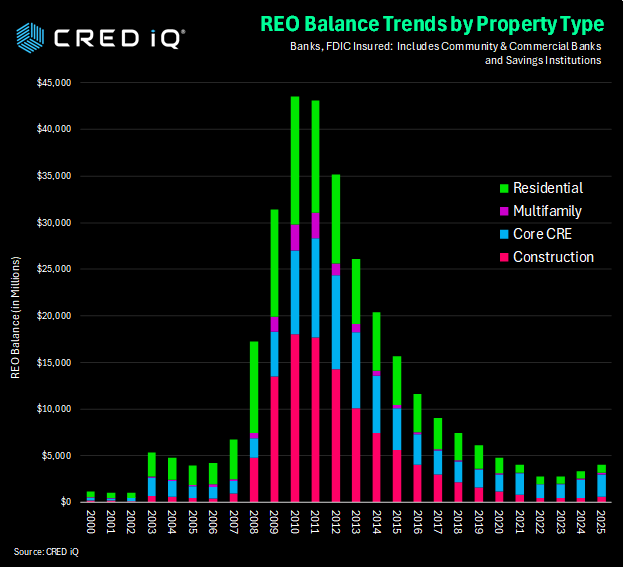
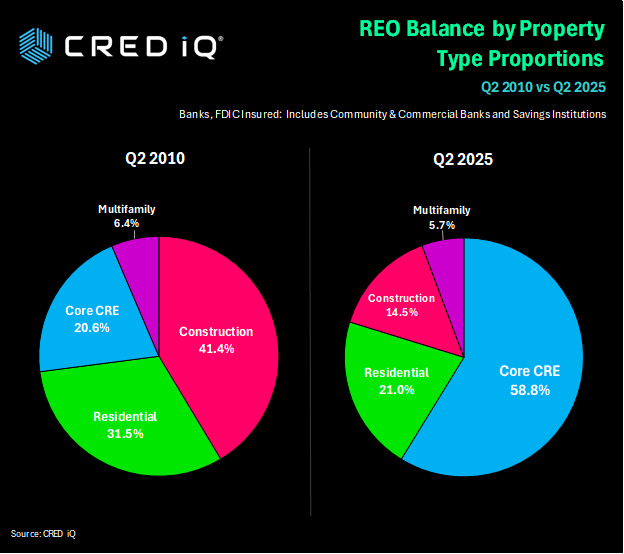
REO balances reached extraordinary heights between 2008 and 2012, with total real estate owned surging up to over $51 billion in Q2 2011. Each major property type saw dramatic increases: nonfarm nonresidential peaked above $17 billion, with multifamily, construction, and residential sectors all seeing multi-billion dollar REO volumes. By comparison, Q2 2025 shows markedly lower balances: total REO is about $4.1 billion, with core CRE (nonfarm nonresidential) at $2.4 billion, construction at $588 million, and multifamily at $231 million.

Sector Breakdown and Trends

Core CRE: After cresting above $17 billion in Q2 2011, this sector now holds only $2.38 billion of REO, showing how far distress has receded.

Construction: The current $588 million in construction REO is a fraction of the GFC peak of over $18 billion, as riskier development loans have been managed more conservatively in recent cycles.

Multifamily and Residential: Multifamily REO hit over $2.7 billion during crisis years but sits at $231 million in 2025. 1-4 Unit Residential peaked above $13 billion in 2010, now just $852 million, reflecting more robust borrower performance and tighter underwriting.

Office Example

A four-story, 137,731-square-foot office building at 120 Mountain View Blvd in Basking Ridge, NJ, entered foreclosure after a failed balloon payment upon loan maturity in June 2024, resulting in REO status. Originally valued at $27.2 million in 2014, the property’s value plummeted to $7.7 million by mid-2025 as its occupancy dropped from 100% in 2022 to just 45.64% in March 2025, contributing to a low DSCR of 0.46 as of May 2025. With amenities like a cafeteria and garage, the asset’s financial distress led to the appointment of a receiver and foreclosure proceedings as the lender moved to resolve the non-performing matured loan transferred from the JPMBB 2014-C22 conduit

Macro Implications for Investors and Lenders

REO levels are now in line with—or lower than—pre-GFC averages, confirming that lenders are carrying far fewer distressed real estate assets on their books than before. This shrinkage reflects not only the economic growth following the crisis, but also dramatic improvements in risk management, property valuation, and loan workout strategies that have reduced the systemic build-up of troubled assets.

Opportunity and Risk Outlook

While lower REO supply suggests fewer forced-sale buying opportunities for opportunistic investors, it also signals healthier loan books for lenders and higher confidence in collateral values. Should economic headwinds intensify, early detection and workout mechanisms in today’s market will likely prevent a repeat of GFC-level asset distress, offering greater stability for commercial real estate stakeholders.

Overall, today’s REO environment tells a story of cautious optimism, where lessons from the GFC have reduced risks and left both lenders and investors better positioned to weather future shocks.

About CRED iQ

CRED iQ is a market data provider that offers a robust suite of data and software solutions tailored for commercial real estate and finance professionals.

With over $2.3 trillion of CRE loans, CRED iQ delivers instant access to a comprehensive range of financial data and analytics for millions of properties in every market. CRED iQ’s data and analytical capabilities are instrumental in helping investors, lenders and brokers make informed and strategic decisions critical to their business.

THE DATA, INFORMATION AND/OR RELATED MATERAL (“DELIVERABLES”) IS BEING OFFERED AS-IS/WHERE-AS CONDITION. CRED-IQ MAKES NO REPRESENTATION OR WARRANTY AS TO QUALITY OR ACCURACY OF SUCH DELIVERABLES BEING PURCHASED, WHETHER EXPRESS OR IMPLIED, EITHER IN FACT OR BY OPERATION OF LAW, STATUTE, OR OTHERWISE, AND CRED-IQ SPECIFICALLY DISCLAIMS ANY AND ALL IMPLIED OR STATUTORY WARRANTIES INCLUDING WARRANTIES OF MERCHANTABILITY AND OF FITNESS FOR A PARTICULAR PURPOSE, TECHNICAL PERFORMANCE, AND NON-INFRINGEMENT. WITHOUT LIMITING THE FOREGOING, YOU AS CUSTOMER ACKNOWLEDGE THAT YOU HAVE NOT AND ARE NOT RELYING UPON ANY IMPLIED WARRANTY OF MERCHANTABILITY OR OF FITNESS FOR A PARTICULAR PURPOSE OR OTHERWISE, OR UPON ANY REPRESENTATION OR WARRANTY WHATSOEVER AS TO THE DELIVERABLES  IN ANY REGARDS WHATSOEVER, AND ACKNOWLEDGE  THAT CRED-IQ MAKES NO, AND HEREBY DISCLAIMS ANY, REPRESENTATION, WARRANTY OR GUARANTEE THAT THE PURCHASE, USE OR COMMERCIALIZATION OF ANY DELIVERABLES WILL BE USEFUL TO YOU OR FREE FROM INTERFERENCE. BY ACCEPTANCE OF THE DELIVERABLES, YOU HEREBY RELEASE CRED-IQ AND ITS AFFILIATES AND AGENTS FROM ALL CLAIMS, DAMAGES AND LIABILITY ARISING HEREUNDER.

Announcing BMARK 2025-V17

0

A CRED iQ Preliminary Analysis

Deal Overview

The BMARK 2025-V17 CMBS deal is a new issuance securitization for the CMBS market, with a total pooled balance of $629 million. The deal is jointly managed by prominent financial institutions including Deutsche Bank, Goldman Sachs, Barclays, BMO, and Citigroup. The deal is collateralized by 27 loans and secured by 145 properties across a variety of sectors, including multifamily, hospitality, and office. The strategic geographic distribution of these properties ensures balanced exposure across major markets. The deal’s weighted average loan-to-value (LTV) ratio of 58.0%, and the weighted average mortgage interest rate is 6.49%.

Key Metrics

The loan pool for BMARK 2025-V17 is structured with interest-only loans, offering investors a steady income stream. The pool boasts a weighted average debt service coverage ratio (DSCR) of 1.82. The weighted average net operating income (NOI) debt yield is 12.4%.

Geography & Property Types

A key strength of the BMARK 2025-V17 CMBS deal is its diverse property type distribution, which enhances portfolio resilience. Multifamily properties constitute 35.6% of the total balance, while hospitality properties account for 20.0% of the balance. The geographic distribution of the properties across prime markets, including high-growth areas in New York City, Washington, DC, and Houston.

About CRED iQ

CRED iQ is a market data provider that offers a robust suite of data and software solutions tailored for commercial real estate and finance professionals.

With over $2.3 trillion of CRE loans, CRED iQ delivers instant access to a comprehensive range of financial data and analytics for millions of properties in every market. CRED iQ’s data and analytical capabilities are instrumental in helping investors, lenders and brokers make informed and strategic decisions critical to their business.

THE DATA, INFORMATION AND/OR RELATED MATERAL (“DELIVERABLES”) IS BEING OFFERED AS-IS/WHERE-AS CONDITION. CRED-IQ MAKES NO REPRESENTATION OR WARRANTY AS TO QUALITY OR ACCURACY OF SUCH DELIVERABLES BEING PURCHASED, WHETHER EXPRESS OR IMPLIED, EITHER IN FACT OR BY OPERATION OF LAW, STATUTE, OR OTHERWISE, AND CRED-IQ SPECIFICALLY DISCLAIMS ANY AND ALL IMPLIED OR STATUTORY WARRANTIES INCLUDING WARRANTIES OF MERCHANTABILITY AND OF FITNESS FOR A PARTICULAR PURPOSE, TECHNICAL PERFORMANCE, AND NON-INFRINGEMENT. WITHOUT LIMITING THE FOREGOING, YOU AS CUSTOMER ACKNOWLEDGE THAT YOU HAVE NOT AND ARE NOT RELYING UPON ANY IMPLIED WARRANTY OF MERCHANTABILITY OR OF FITNESS FOR A PARTICULAR PURPOSE OR OTHERWISE, OR UPON ANY REPRESENTATION OR WARRANTY WHATSOEVER AS TO THE DELIVERABLES  IN ANY REGARDS WHATSOEVER, AND ACKNOWLEDGE  THAT CRED-IQ MAKES NO, AND HEREBY DISCLAIMS ANY, REPRESENTATION, WARRANTY OR GUARANTEE THAT THE PURCHASE, USE OR COMMERCIALIZATION OF ANY DELIVERABLES WILL BE USEFUL TO YOU OR FREE FROM INTERFERENCE. BY ACCEPTANCE OF THE DELIVERABLES, YOU HEREBY RELEASE CRED-IQ AND ITS AFFILIATES AND AGENTS FROM ALL CLAIMS, DAMAGES AND LIABILITY ARISING HEREUNDER.

Announcing BMO 2025-5C12

0

A CRED iQ Preliminary Analysis

Deal Overview

The BMO 2025-5C12 CMBS deal is a new issuance securitization for the CMBS market, with a total pooled balance of $638.2 million. The deal is jointly managed by prominent financial institutions including BMO, Deutsche Bank, KeyBanc, UBS and Citigroup. The deal is collateralized by 45 loans and secured by 168 properties across a variety of sectors, including multifamily, office, and retail. The strategic geographic distribution of these properties ensures balanced exposure across major markets. The deal’s weighted average loan-to-value (LTV) ratio of 58.6%, and the weighted average mortgage interest rate is 6.58%.

Key Metrics

The loan pool for BMO 2025-5C12 is structured to include a mix of amortizing and interest-only loans, with 4.3% of the mortgage pool having scheduled amortization. The remainder of the pool (95.7%) consists of interest-only payments throughout the loan term, offering investors a steady income stream. The pool boasts a weighted average debt service coverage ratio (DSCR) of 1.58. The weighted average net operating income (NOI) debt yield is 10.9%.

Geography & Property Types

A key strength of the BMO 2025-5C12 CMBS deal is its diverse property type distribution, which enhances portfolio resilience. Multifamily properties constitute 28.4% of the total balance, while office properties account for 18.1% of the balance. The geographic distribution of the properties across prime markets, including high-growth areas in New York City, Houston, and Dallas.

About CRED iQ

CRED iQ is a market data provider that offers a robust suite of data and software solutions tailored for commercial real estate and finance professionals.

With over $2.3 trillion of CRE loans, CRED iQ delivers instant access to a comprehensive range of financial data and analytics for millions of properties in every market. CRED iQ’s data and analytical capabilities are instrumental in helping investors, lenders and brokers make informed and strategic decisions critical to their business.

THE DATA, INFORMATION AND/OR RELATED MATERAL (“DELIVERABLES”) IS BEING OFFERED AS-IS/WHERE-AS CONDITION. CRED-IQ MAKES NO REPRESENTATION OR WARRANTY AS TO QUALITY OR ACCURACY OF SUCH DELIVERABLES BEING PURCHASED, WHETHER EXPRESS OR IMPLIED, EITHER IN FACT OR BY OPERATION OF LAW, STATUTE, OR OTHERWISE, AND CRED-IQ SPECIFICALLY DISCLAIMS ANY AND ALL IMPLIED OR STATUTORY WARRANTIES INCLUDING WARRANTIES OF MERCHANTABILITY AND OF FITNESS FOR A PARTICULAR PURPOSE, TECHNICAL PERFORMANCE, AND NON-INFRINGEMENT. WITHOUT LIMITING THE FOREGOING, YOU AS CUSTOMER ACKNOWLEDGE THAT YOU HAVE NOT AND ARE NOT RELYING UPON ANY IMPLIED WARRANTY OF MERCHANTABILITY OR OF FITNESS FOR A PARTICULAR PURPOSE OR OTHERWISE, OR UPON ANY REPRESENTATION OR WARRANTY WHATSOEVER AS TO THE DELIVERABLES  IN ANY REGARDS WHATSOEVER, AND ACKNOWLEDGE  THAT CRED-IQ MAKES NO, AND HEREBY DISCLAIMS ANY, REPRESENTATION, WARRANTY OR GUARANTEE THAT THE PURCHASE, USE OR COMMERCIALIZATION OF ANY DELIVERABLES WILL BE USEFUL TO YOU OR FREE FROM INTERFERENCE. BY ACCEPTANCE OF THE DELIVERABLES, YOU HEREBY RELEASE CRED-IQ AND ITS AFFILIATES AND AGENTS FROM ALL CLAIMS, DAMAGES AND LIABILITY ARISING HEREUNDER.

CRED iQ’s Analysis of CRE Balance Sheet Loans –Q2 2025 Update

0

CRED iQ’s analysis of the most recent banking data for the second quarter of 2025 provides a comprehensive snapshot of the U.S. banking industry’s financial health. Covering 4,421 FDIC-insured commercial banks and savings institutions, including community banks with total assets of $25 trillion, the report highlights stable but modestly declining profitability, resilient deposit growth, and generally favorable asset quality amid persistent pressures in select loan portfolios.

This summary draws from the report’s key findings, with a targeted focus on commercial real estate (CRE) metrics relevant to investors and lenders. While overall banking conditions remain sound, the report flags ongoing weaknesses in CRE segments like non-owner-occupied properties and multifamily, where delinquency rates exceed pre-pandemic averages (defined as Q1 2015–Q4 2019). These insights are particularly pertinent as they underscore potential risks in CRE lending amid elevated interest rates and economic uncertainty.

Key Industry Highlights

CRED iQ’s analysis provides detailed delinquency, and net loss metrics for loans as of June 30, 2025, segmented by property types. For CRE investors and lenders, the data reveals moderate stress in key subsectors—construction and development (C&D), Core CRE (e.g., office, retail, industrial, hotel), and multifamily—amid high borrowing costs and softening demand in segments like office. Total CRE loans outstanding reached approximately $3 trillion (sum of C&D, Core CRE, and multifamily), representing about 23% of all loans. Let’s dive into these CRE metrics for all FDIC-insured banking institutions.

Core CRE (Office, Retail, Industrial, Hotel) Performance

  • 30-89 Days Delinquent: This delinquency bucket is at 0.27% for Core CRE, down from 0.34% from prior quarter, and in line with a year ago.  
  • 90+ Days Delinquent:  The 90+ days delinquency bucket is at 1.38% for Core CRE, up slightly from 1.36% from prior quarter, and in line with a year ago.   Total balance of 90+ day delinquent loans amounts to $25.8 billion for the Core CRE asset group.
  • Overall Delinquent: Combining these two delinquent buckets amounts to 1.65% overall, which is down 5 basis points from the quarter earlier.  A year ago overall delinquency for Core CRE was 1.62%, and was 0.75% in December 2019. 
  • Net Losses:  Net losses across the Core CRE properties totaled $3.92 billion (0.21%) in Q2 2025, which is up slightly from $3.88 billion last quarter, and is down from $6.0 billion (0.33%) in Q2 2024, which represents the highest amount of losses since March 2012).

Multifamily Performance

  • 30-89 Days Delinquent: This delinquency bucket is at 0.24% for multifamily loans, down from 0.42% from prior quarter, and down from 0.39% a year ago.  
  • 90+ Days Delinquent:  The 90+ days delinquency bucket remains at 1.05% for multifamily loans, the same as prior quarter, but up significantly from a year ago (0.50%).   Total balance of 90+ day delinquent loans amounts to $6.8 billion for the multifamily asset group.
  • Overall Delinquent: Combining these two delinquent buckets amounts to 1.29% overall, which is down 18 basis points from the quarter earlier.  A year ago overall delinquency for multifamily loans was 0.89%, and was 0.25% in December 2019. 
  • Net Losses:  Net losses across the multifamily properties totaled $902 million (0.14%) in Q2 2025, which is up slightly from $767 million last quarter, and doubled the amount in (0.07%) in Q2 2024.  The highest quarterly amount of losses for multifamily totaled $2.66 billion in Q4 2010. 

Construction & Development Performance

  • 30-89 Days Delinquent: This delinquency bucket is at 0.42% for C&D loans, down from 0.48% from prior quarter, and up from 0.40% a year ago.  
  • 90+ Days Delinquent:  The 90+ days delinquency bucket remains at 0.84% for C&D, up from 0.81% the prior quarter, and also up significantly from a year ago (0.59%).  Total balance of 90+ day delinquent loans amounts to $3.94 billion for the C&D asset group.
  • Overall Delinquent: Combining these two delinquent buckets amounts to 1.26% overall, which is up 3 basis points from the quarter earlier.  A year ago overall delinquency for C&D loans was 0.99%, and was 0.82% in December 2019. 
  • Net Losses:  Net losses across the C&D assets totaled $375 million (0.08%) in Q2 2025, which is up slightly from $335 million last quarter, and up from $198 million (0.04%) in Q2 2024.  The highest quarterly amount of losses for C&D totaled $24.4 billion in Q4 2009.


Implications for CRE Investors and Lenders

CRED iQ’s Bank Data analysis underscores a bifurcated CRE landscape: While total loan growth supports optimism, elevated noncurrent rates in Core CRE (office-heavy) and multifamily highlight refinance risks in a high-rate environment. Investors should monitor large banks’ provisioning trends, as acquisitions could mask underlying weaknesses. For lenders, focus on mid-tier and regional institutions where 90+ Day Delinquent rates are rising, and stress-test portfolios against potential net losses increases. Community banks’ strong income growth offers opportunities for partnerships, but their higher CRE concentrations warrant caution. Overall, the industry’s stability mitigates systemic risks, but selective underwriting in stressed subsectors remains critical.

About CRED iQ

CRED iQ is a market data provider that offers a robust suite of data and software solutions tailored for commercial real estate and finance professionals.

With over $2.3 trillion of CRE loans, CRED iQ delivers instant access to a comprehensive range of financial data and analytics for millions of properties in every market. CRED iQ’s data and analytical capabilities are instrumental in helping investors, lenders and brokers make informed and strategic decisions critical to their business.

THE DATA, INFORMATION AND/OR RELATED MATERAL (“DELIVERABLES”) IS BEING OFFERED AS-IS/WHERE-AS CONDITION. CRED-IQ MAKES NO REPRESENTATION OR WARRANTY AS TO QUALITY OR ACCURACY OF SUCH DELIVERABLES BEING PURCHASED, WHETHER EXPRESS OR IMPLIED, EITHER IN FACT OR BY OPERATION OF LAW, STATUTE, OR OTHERWISE, AND CRED-IQ SPECIFICALLY DISCLAIMS ANY AND ALL IMPLIED OR STATUTORY WARRANTIES INCLUDING WARRANTIES OF MERCHANTABILITY AND OF FITNESS FOR A PARTICULAR PURPOSE, TECHNICAL PERFORMANCE, AND NON-INFRINGEMENT. WITHOUT LIMITING THE FOREGOING, YOU AS CUSTOMER ACKNOWLEDGE THAT YOU HAVE NOT AND ARE NOT RELYING UPON ANY IMPLIED WARRANTY OF MERCHANTABILITY OR OF FITNESS FOR A PARTICULAR PURPOSE OR OTHERWISE, OR UPON ANY REPRESENTATION OR WARRANTY WHATSOEVER AS TO THE DELIVERABLES  IN ANY REGARDS WHATSOEVER, AND ACKNOWLEDGE  THAT CRED-IQ MAKES NO, AND HEREBY DISCLAIMS ANY, REPRESENTATION, WARRANTY OR GUARANTEE THAT THE PURCHASE, USE OR COMMERCIALIZATION OF ANY DELIVERABLES WILL BE USEFUL TO YOU OR FREE FROM INTERFERENCE. BY ACCEPTANCE OF THE DELIVERABLES, YOU HEREBY RELEASE CRED-IQ AND ITS AFFILIATES AND AGENTS FROM ALL CLAIMS, DAMAGES AND LIABILITY ARISING HEREUNDER.

Announcing BBCMS 2025-5C37

0

A CRED iQ Preliminary Analysis

Deal Overview

The BBCMS 2025-5C37 CMBS deal is a new issuance securitization for the CMBS market, with a total pooled balance of $741.5 million. The deal is jointly managed by prominent financial institutions including Barclays, BMO, Citigroup, Goldman Sachs, Societe Generale, and UBS. The deal is collateralized by 30 loans and secured by 143 properties across a variety of sectors, including multifamily, hospitality, and retail. The strategic geographic distribution of these properties ensures balanced exposure across major markets. The deal’s weighted average loan-to-value (LTV) ratio of 57.9%, and the weighted average mortgage interest rate is 6.83%.

Key Metrics

The loan pool for BBCMS 2025-5C37 is structured to include a mix of amortizing and interest-only loans, with 7.5% of the mortgage pool having scheduled amortization. The remainder of the pool (92.5%) consists of interest-only payments throughout the loan term, offering investors a steady income stream. The pool boasts a weighted average debt service coverage ratio (DSCR) of 1.75. The weighted average net operating income (NOI) debt yield is 12.2%.

Geography & Property Types

A key strength of the BBCMS 2025-5C37 CMBS deal is its diverse property type distribution, which enhances portfolio resilience. Multifamily properties constitute 26.1% of the total balance, while hospitality properties account for 22.6% of the balance. The geographic distribution of the properties across prime markets, including high-growth areas in New York City, Boston, Detroit.

About CRED iQ

CRED iQ is a market data provider that offers a robust suite of data and software solutions tailored for commercial real estate and finance professionals.

With over $2.3 trillion of CRE loans, CRED iQ delivers instant access to a comprehensive range of financial data and analytics for millions of properties in every market. CRED iQ’s data and analytical capabilities are instrumental in helping investors, lenders and brokers make informed and strategic decisions critical to their business.

THE DATA, INFORMATION AND/OR RELATED MATERAL (“DELIVERABLES”) IS BEING OFFERED AS-IS/WHERE-AS CONDITION. CRED-IQ MAKES NO REPRESENTATION OR WARRANTY AS TO QUALITY OR ACCURACY OF SUCH DELIVERABLES BEING PURCHASED, WHETHER EXPRESS OR IMPLIED, EITHER IN FACT OR BY OPERATION OF LAW, STATUTE, OR OTHERWISE, AND CRED-IQ SPECIFICALLY DISCLAIMS ANY AND ALL IMPLIED OR STATUTORY WARRANTIES INCLUDING WARRANTIES OF MERCHANTABILITY AND OF FITNESS FOR A PARTICULAR PURPOSE, TECHNICAL PERFORMANCE, AND NON-INFRINGEMENT. WITHOUT LIMITING THE FOREGOING, YOU AS CUSTOMER ACKNOWLEDGE THAT YOU HAVE NOT AND ARE NOT RELYING UPON ANY IMPLIED WARRANTY OF MERCHANTABILITY OR OF FITNESS FOR A PARTICULAR PURPOSE OR OTHERWISE, OR UPON ANY REPRESENTATION OR WARRANTY WHATSOEVER AS TO THE DELIVERABLES  IN ANY REGARDS WHATSOEVER, AND ACKNOWLEDGE  THAT CRED-IQ MAKES NO, AND HEREBY DISCLAIMS ANY, REPRESENTATION, WARRANTY OR GUARANTEE THAT THE PURCHASE, USE OR COMMERCIALIZATION OF ANY DELIVERABLES WILL BE USEFUL TO YOU OR FREE FROM INTERFERENCE. BY ACCEPTANCE OF THE DELIVERABLES, YOU HEREBY RELEASE CRED-IQ AND ITS AFFILIATES AND AGENTS FROM ALL CLAIMS, DAMAGES AND LIABILITY ARISING HEREUNDER.

CRE CLO Distress Metrics: Rising Pressures in a Volatile Market

0

In the ever-evolving landscape of commercial real estate (CRE) collateralized loan obligations (CLOs), monitoring delinquency (DQ), special servicing (SS), and overall distress rates remains crucial for investors and lenders. Data from CRED iQ, a leading provider of CRE analytics, reveals notable trends through August 2025, highlighting a market grappling with economic headwinds like rising interest rates and sector-specific challenges in office and retail properties.

As of August 2025, the DQ rate for CRE CLOs stood at 10.65%, up from 9.22% in July, marking a 143 basis point (bps) increase month-over-month (MoM). This uptick reflects growing payment struggles, with 30-day delinquencies comprising a significant portion of distressed loans at 14.43% of the distressed allocated loan amount (ALA). Similarly, the SS rate climbed to 8.15% from 6.90%, a 125 bps rise, indicating more loans requiring specialized workout strategies. The combined distress rate (DQ and/or SS) reached 13.32%, up 153 bps MoM, underscoring broader portfolio stress.

Looking at recent trends, the past few months show volatility but an upward trajectory overall. July 2025 saw DQ rise 82 bps from June’s 8.40%, while SS edged up 23 bps. June, however, bucked the trend with a 264 bps drop in DQ from May’s 11.04%, suggesting temporary relief possibly from seasonal factors or restructurings. Year-over-year, comparing August 2025 to August 2024 (10.37% DQ, 5.67% SS, 11.77% distress), rates have escalated, with DQ up over 28 bps and SS surging 149 bps. This acceleration aligns with maturing loans—over 59% of distressed ALA in August fell under matured categories, split between performing (22.56%) and non-performing (36.74%)—pointing to refinance difficulties in a high-rate environment.

Deeper into the data, payment status breakdowns reveal persistent issues. In August, 90+ day delinquencies accounted for 5.54% of distressed loans, while non-performing matured loans dominated at 36.74%. Earlier months like March 2025 peaked at 11.86% DQ, driven by similar maturity walls. These trends signal caution for CRE CLO stakeholders. With office vacancies lingering and multifamily pressures from oversupply, distress could intensify if rates remain elevated. However, opportunities exist in workouts and value-add strategies. Investors should prioritize granular analysis via platforms like CRED iQ to navigate this cycle effectively.

About CRED iQ

CRED iQ is a market data provider that offers a robust suite of data and software solutions tailored for commercial real estate and finance professionals.

With over $2.3 trillion of CRE loans, CRED iQ delivers instant access to a comprehensive range of financial data and analytics for millions of properties in every market. CRED iQ’s data and analytical capabilities are instrumental in helping investors, lenders and brokers make informed and strategic decisions critical to their business.

CMBS Distress Rate Reaches a New Record at 11.8%

0

The CRED iQ research team analyzed the payment status of approximately $61.1 billion in CMBS loans as part of our monthly distress reporting.  Our latest print saw the CRED iQ distress rate climb by 70 basis points to 11.78%, the second consecutive increase.  CMBS distress rates exceed the previous record high of 11.5%, set in January, establishing a new historic high in August. 

With these new record highs following increases during 3 of the 4 last months, we wanted to understand if this foretells an upward trajectory as we move into the fall months.  Let’s dive in and see what the data tells us.

Distress Rate Trends

The commercial mortgage-backed securities (“CMBS”) distress rate added 70 basis points reaching a new record high of 11.8% in August according to CRED iQ’s latest analysis.

This second consecutive increase was matched by increases across the underlying metrics for the second month in a row. The delinquency rate saw a 78 BPS increase to reach 9.44%, while the special servicing rate increased from 10.33% to 10.95%.  

Payment Terms

Our team explored each payment status reason from a historical perspective.

We wanted to understand the trending/evolution of each category dating back to March of 2024. Our team built a heat map which reveals trends for each category, to potential argument current forecasting models.

Current Loans: $8.4 billion (13.7%)  of CMBS loans were current in August, down $721 million from the July print of $9.1 billion (15.5%), notching the third consecutive decrease in this fundamental metric 

Late Loans: $3.8 billion (6.2%) of loans are late but not yet delinquent, down slightly from 6.4% last month

Delinquent Loans: $10.2 billion (16.6%) of CMBS  loans are 30+ days delinquent, down from $10.3 billion (17.5%) in July

Matured Loans: $38.8 billion (63.5%) in CMBS loans have passed their maturity date (up from $35.8 billion last month). Of these, 22.8% are performing (up from 21.7%), while 40.7% are non-performing (up from 38.9%)

Loan Highlight

Estates at Palm Bay is a 300-unit multifamily property in Fort Walton Beach, part of the Florida panhandle. The garden style property is backed by a $61 million loan that fell 30 days delinquent in August 2025. The interest only loan is scheduled to mature in September 2029. The asset was most recently performed with a DSCR of 1.43 and 88% occupancy.

CRED iQ’s Methodology: A Comprehensive Approach

CRED iQ’s distress rate provides a holistic view of CMBS performance by combining delinquency (30+ days past due) and special servicing activity, including both performing and non-performing loans that fail to pay off at maturity. Our analysis focuses on conduit and single-borrower large loan structures, while separately tracking Freddie Mac, Fannie Mae, Ginnie Mae, and CRE CLO metrics. This granular approach ensures CRE professionals have a clear, actionable understanding of market dynamics.

Informed with CRED iQ

As the CRE sector continues to adapt to macroeconomic shifts, CRED iQ’s comprehensive analytics offer a critical resource for decision-makers. For a deeper dive into our data or to discuss how these trends impact your portfolio, contact our team today. Stay tuned for our next update, where we’ll continue to track the metrics driving the CMBS market.

For more information, visit CRED-iQ.com  or reach out to our research team at Team@CRED-iQ.com.

About CRED iQ

CRED iQ is a market data provider that offers a robust suite of data and software solutions tailored for commercial real estate and finance professionals.

With over $2.3 trillion of CRE loans, CRED iQ delivers instant access to a comprehensive range of financial data and analytics for millions of properties in every market. CRED iQ’s data and analytical capabilities are instrumental in helping investors, lenders and brokers make informed and strategic decisions critical to their business.

THE DATA, INFORMATION AND/OR RELATED MATERAL (“DELIVERABLES”) IS BEING OFFERED AS-IS/WHERE-AS CONDITION. CRED-IQ MAKES NO REPRESENTATION OR WARRANTY AS TO QUALITY OR ACCURACY OF SUCH DELIVERABLES BEING PURCHASED, WHETHER EXPRESS OR IMPLIED, EITHER IN FACT OR BY OPERATION OF LAW, STATUTE, OR OTHERWISE, AND CRED-IQ SPECIFICALLY DISCLAIMS ANY AND ALL IMPLIED OR STATUTORY WARRANTIES INCLUDING WARRANTIES OF MERCHANTABILITY AND OF FITNESS FOR A PARTICULAR PURPOSE, TECHNICAL PERFORMANCE, AND NON-INFRINGEMENT. WITHOUT LIMITING THE FOREGOING, YOU AS CUSTOMER ACKNOWLEDGE THAT YOU HAVE NOT AND ARE NOT RELYING UPON ANY IMPLIED WARRANTY OF MERCHANTABILITY OR OF FITNESS FOR A PARTICULAR PURPOSE OR OTHERWISE, OR UPON ANY REPRESENTATION OR WARRANTY WHATSOEVER AS TO THE DELIVERABLES  IN ANY REGARDS WHATSOEVER, AND ACKNOWLEDGE  THAT CRED-IQ MAKES NO, AND HEREBY DISCLAIMS ANY, REPRESENTATION, WARRANTY OR GUARANTEE THAT THE PURCHASE, USE OR COMMERCIALIZATION OF ANY DELIVERABLES WILL BE USEFUL TO YOU OR FREE FROM INTERFERENCE. BY ACCEPTANCE OF THE DELIVERABLES, YOU HEREBY RELEASE CRED-IQ AND ITS AFFILIATES AND AGENTS FROM ALL CLAIMS, DAMAGES AND LIABILITY ARISING HEREUNDER.

30 Questions with CRED: Jordan Cailliarec

0

About 30 Questions with CRED

Quick Background on Jordan:

Meet Jordan Cailliarec, a seasoned principal at Pantigo Advisors, where he’s been driving opportunistic real estate investments since 2009. With over 15 years in thematic real estate finance, Jordan specializes in debt asset management and credit risk mitigation, transforming high-risk loan portfolios into high-performing assets for maximum returns. 

His hands-on approach has made him a go-to expert for CRE investors navigating Northeast submarkets, from spotting undervalued opportunities to executing sharp repositioning strategies. Currently, Jordan serves as Portfolio Manager at Habitat Portfolio Management, overseeing diverse real estate debt and equity plays since 2021.  He previously managed assets for a confidential private fund, honing his skills in risk assessment and value enhancement. 

At Pantigo Advisors—a firm he helped shape since its founding—Jordan leverages deep local expertise to build lasting relationships and mitigate market volatilities, focusing on inventive, pragmatic investments that deliver for stakeholders. Whether discussing distressed debt workouts or emerging CRE trends on podcasts, Jordan’s insights blend street-smart tactics with strategic foresight, making him an invaluable voice for investors eyeing resilient portfolios in today’s dynamic market. Connect with him to unlock your next big opportunity.

Also, here was one of Jordan’s guest blogs from May 2024 about CRE CLOs: Structural Considerations When Analyzing Distress & Searching for Opportunity Using CRED iQ Analytics

1. What do you think of the trends in office properties?

I think there are still many further opportunities for valuations to step down meaningfully. Recently we have the Worldwide Plaza sasb deal in the news for all the wrong reasons, but there have been several situations in the last 18-24 months where opportunistic purchasers of previously distressed office properties in NY metro are now in distress themselves. We had looked at a NPL in Q1 with a judgment pending for a midtown east loft style office just outside of the MSMX zone, $6.8m UPB against a claimed $7.5m appraised value, and when it came up on the auction block several months later the upset was approximately $5.5m which was 10% or so lower than the loan sale whisper. So obviously some eleventh hour second guessing by the lender in that specific scenario to avoid OREO, but I think there are a lot of losses yet to be fully realized.

Despite positive recent leasing activity data for core midtown, I’m also extremely wary of the notion that demand will necessarily spill over to adjacent submarkets.

2. Has the current market caused you to think differently about any property types?

NYC rent stabilized MF, but that’s for a whole host of reasons beyond just the current market.

3. The CRE CLO ecosystem has shown some impressive growth with the demand of shorter-term loans being in heavy demand. How do you think about the CMBS market outlook over the next 12-24 months?

Doom and gloom makes for good headlines, but I’m most interested in monitoring that subset of cmbs that is both in the money to refinance and has remaining extension options; how cmbs borrowers in that scenario choose to behave will prove to be a bit of a representative tell I think.

4. What is keeping you up at night?

I tend to be a bit sanguine about these sorts of concerns; we can only react to that which is out of our control and there is a healthy middle ground between apocalyptic doom and naivete in the face of objective concerns. So, nothing specific keeping me up and night but I do believe there are sufficient issues to give rise to opportunities for those with the gumption in the next 18-24 months.

5. Any thoughts with respect to how AI will impact CRE and CRE Finance?

I think it will be helpful in simplifying certain processes at this point; screening, data scraping, things of that nature just from an efficiency standpoint. I’m sure its role in real estate and real estate finance will continue to evolve and use cases will expand. For me, it seems to be a promising yet incomplete tool at this juncture.

6. Where do you think interest rates will be at year-end.

Bit of a fools errand to try to predict with specificity, but incrementally lower, which after the last 24 months very well may have more of an outsize effect on transaction activity than otherwise warranted.

7. How do we solve the housing crisis? Does the federal government need to play a key role?

I’m going to offer a bit of a fatalistic take on this one; from a policy standpoint, all just window dressing. Housing is going to be an ongoing pain point for the country for the foreseeable future, and there are realistically few solutions. Banging on about specific actions that in a vacuum won’t effectuate a material change doesn’t seem productive.

8. What is your outlook on traditional malls as a potential investment?

As far as the stereotypical suburban mall replete with an Auntie Anne’s and Hot Topic, I think for the most part there isn’t much left to suck out of what remains on a national level.  A handful of groups specialized in wringing out the last bits of value from the dying suburban mall; acquisition velocity by those groups has slowed in the last couple years and they have started moving onto other asset classes, which I take as an indication there isn’t much juice left to squeeze.

9. What is your 12 month outlook on deal volumes?

Obviously I assume they’re going to be elevated from todays levels. At this point I believe the impact of just a nominal rate cut in terms of market stimulation will be relatively meaningful.

10. With Apartment construction at a decade low, how do you feel about multifamily unit pricing trends over the coming 18 months?

Positive. But I’ve always been more positive about this question than what seems to be the prevailing industry sentiment.  People seemed so drawn to the ridiculous syndications of several years ago and seemed so emotionally committed to the schadenfreude of seeing the syndicators go down in flames that their analysis often missed the forest through the trees. I chuckled to myself while reading a lot of the commentary as absorption remained strong.

Fun Facts About Jordan Cailliarec

  1. Favorite food? I’m a steak guy. NY Strip, rare
  2. Best Sports movie of all time? Moneyball
  3. What’s your favorite band? Blink 182
  4. What is your favorite quote from the movie Airplane? “Flying a plane is no different than riding a bicycle, just a lot harder to put baseball cards in the spokes”
  5. What should be a new Olympic Sport? Dodgeball. Such a beautifully simple and adversarial concept that’s bigger than any one nation or culture; you throw the ball, you try and hit somebody with the ball. You hit them, you’re out, they catch it, you’re out.
  6. What was your first aol screen name or email? jordyc13. I guess some other people are using that handle nowadays elsewhere, but I was the first.
  7. Who’s the best person to follow on Twitter / X? @CECL_Allowance and @iBladesi for niche credit commentary
  8. Top Golf Course ever played? Maidstone. Definitely not the best course I’ve played or even close, and frankly an objectively unremarkable course, but what is special about it can’t be measured.
  9. Costar or CRED iQ? CredIQ, obviously
  10. Name the person (present, historical or even fiction) you’d love to have dinner with? Henry Kissinger.  Just an incredible breath of geopolitical knowledge from a time of massive world upheaval and was respected by leaders of all political inclinations alike.
  11. What’s your go-to Karaoke song? Mr. Brightside
  12. What’s the best city in the USA? New York, only right answer
  13. What’s the best trip you’ve been on? I wouldn’t necessarily say there is any specific “best”, but I’ve gotten the most satisfaction over the last several out of last minute trips to northern Vermont to chase snow with my girlfriend.
  14. What is a really solid life lesson that you’d teach others? “Yesterday you were clever so you wanted to change the world. Today you are wise so you’re changing yourself” -Rumi
  15. Insta, LinkedIn, twitter, facebook or old school texts or phone calls? Phone calls first. Texts are old school now I guess, those are second preference.
  16. What’s the best meal you can cook? I make a mean porcini risotto
  17. What’s your favorite professional sports team? Second favorite? Yankees then Rangers
  18. Did you get a higher verbal or math score on your SAT and why? Verbal, 20 point delta as I recall. Why? No idea. I was always a decent test taker and didn’t prep much.
  19. What’s your favorite fast food restaurant? I love fast food, McDonalds and Wendys specifically. Big Mac and Chili are my go-tos
  20. Favorite quote from Happy Gilmore, Billy Madison or Zoolander? You pay the quarter, you get on the horse, it goes up and down, and around. It’s circular. Circle, with the music, the flow. All good things.

About CRED iQ

CRED iQ is a market data provider that offers a robust suite of data and software solutions tailored for commercial real estate and finance professionals.

With over $2.3 trillion of CRE loans, CRED iQ delivers instant access to a comprehensive range of financial data and analytics for millions of properties in every market. CRED iQ’s data and analytical capabilities are instrumental in helping investors, lenders and brokers make informed and strategic decisions critical to their business.

CRED iQ Distress Rankings: Which U.S. Markets Are Under the Most Pressure in Commercial Real Estate?

0

As we gear up for the Labor Day weekend, the CRED iQ research team has taken a deep dive into the state of commercial real estate across the nation. We’ve analyzed a staggering $341.1 billion in loans spanning the top 50 U.S. markets, focusing on signs of distress. Specifically, we flagged loans that are either delinquent or have been handed off to special servicers. From there, we calculated a “distress rate” for each market—the percentage of loans falling into these troubled categories.

This snapshot reveals stark regional differences, with some markets showing alarming levels of strain while others remain remarkably resilient. Leading the pack in distress is Minneapolis-St. Paul-Bloomington, MN-WI, where a whopping 56.7% of loans are flagged. Close on its heels are Rochester, NY (44.3%), and Portland-Vancouver-Beaverton, OR-WA (42.8%). Rounding out the top five are Austin-Round Rock, TX (26.7%), and Denver-Aurora, CO (23.5%)—highlighting a cluster of Midwestern and Western markets feeling the heat.

On the flip side, several markets are holding strong with minimal distress. Stockton, CA tops the list of least distressed at 0.0%, followed closely by Columbus, OH (0.2%) and San Diego-Carlsbad-San Marcos, CA (0.2%). Salt Lake City, UT (0.6%) and Oxnard-Thousand Oaks-Ventura, CA (0.9%) also stand out for their low rates.

These rankings underscore the uneven recovery in commercial real estate, influenced by factors like office vacancies, economic shifts, and tenant dynamics. For a full breakdown, check out the table below, sorted from highest to lowest distress rate.

Spotlight on a Distressed Loan: 7700 Parmer in Austin

To put these numbers into perspective, let’s zoom in on a key example from one of the top distressed markets. The 7700 Parmer office property in Austin—a 911,579 square-foot asset—is backed by a $177 million loan that’s recently been transferred to the special servicer due to an imminent monetary default. This interest-only loan is set to mature in December 2025, with no extensions noted at origination.

Major tenants include Google (33% of gross leasable area, lease expires September 2027), Electronic Arts (19%, expires August 2026), and eBay Inc. (10%, expires May 2028). Occupancy stands at 74%, with a debt service coverage ratio (DSCR) of 1.96—solid on paper, but clearly not enough to avoid trouble amid broader market pressures.

Stories like this highlight why Austin ranks high on our distress list and serve as a reminder of the vulnerabilities in office-heavy portfolios.

What Does This Mean for CRE Investors?

These rankings offer valuable insights for investors, lenders, and stakeholders navigating the post-pandemic landscape. Markets like Minneapolis and Rochester may require extra due diligence, while low-distress areas like Stockton and Columbus could present more stable opportunities. As always, at CRED iQ, we’re committed to providing data-driven analysis to help you stay ahead. Stay tuned for more updates, and enjoy your Labor Day weekend!

About CRED iQ

CRED iQ is a market data provider that offers a robust suite of data and software solutions tailored for commercial real estate and finance professionals.

With over $2.3 trillion of CRE loans, CRED iQ delivers instant access to a comprehensive range of financial data and analytics for millions of properties in every market. CRED iQ’s data and analytical capabilities are instrumental in helping investors, lenders and brokers make informed and strategic decisions critical to their business.

THE DATA, INFORMATION AND/OR RELATED MATERAL (“DELIVERABLES”) IS BEING OFFERED AS-IS/WHERE-AS CONDITION. CRED-IQ MAKES NO REPRESENTATION OR WARRANTY AS TO QUALITY OR ACCURACY OF SUCH DELIVERABLES BEING PURCHASED, WHETHER EXPRESS OR IMPLIED, EITHER IN FACT OR BY OPERATION OF LAW, STATUTE, OR OTHERWISE, AND CRED-IQ SPECIFICALLY DISCLAIMS ANY AND ALL IMPLIED OR STATUTORY WARRANTIES INCLUDING WARRANTIES OF MERCHANTABILITY AND OF FITNESS FOR A PARTICULAR PURPOSE, TECHNICAL PERFORMANCE, AND NON-INFRINGEMENT. WITHOUT LIMITING THE FOREGOING, YOU AS CUSTOMER ACKNOWLEDGE THAT YOU HAVE NOT AND ARE NOT RELYING UPON ANY IMPLIED WARRANTY OF MERCHANTABILITY OR OF FITNESS FOR A PARTICULAR PURPOSE OR OTHERWISE, OR UPON ANY REPRESENTATION OR WARRANTY WHATSOEVER AS TO THE DELIVERABLES  IN ANY REGARDS WHATSOEVER, AND ACKNOWLEDGE  THAT CRED-IQ MAKES NO, AND HEREBY DISCLAIMS ANY, REPRESENTATION, WARRANTY OR GUARANTEE THAT THE PURCHASE, USE OR COMMERCIALIZATION OF ANY DELIVERABLES WILL BE USEFUL TO YOU OR FREE FROM INTERFERENCE. BY ACCEPTANCE OF THE DELIVERABLES, YOU HEREBY RELEASE CRED-IQ AND ITS AFFILIATES AND AGENTS FROM ALL CLAIMS, DAMAGES AND LIABILITY ARISING HEREUNDER.

Announcing BANK5 2025-5YR16

0

A CRED iQ Preliminary Analysis

Deal Overview

The BANK5 2025-5YR16 CMBS deal is a new issuance securitization for the CMBS market, with a total pooled balance of $656 million. The deal is jointly managed by prominent financial institutions including Bank of America, Morgan Stanley, JP Morgan, and Wells Fargo. The deal is collateralized by 40 loans and secured by 180 properties across a variety of sectors, including multifamily, hospitality, and office. The strategic geographic distribution of these properties ensures balanced exposure across major markets. The deal’s weighted average loan-to-value (LTV) ratio of 54.9%, and the weighted average mortgage interest rate is 6.22%.

Key Metrics

The loan pool for BANK5 2025-5YR16 is structured to include a mix of amortizing and interest-only loans, with 11% of the mortgage pool having scheduled amortization. The remainder of the pool (89%) consists of interest-only payments throughout the loan term, offering investors a steady income stream. The pool boasts a weighted average debt service coverage ratio (DSCR) of 2.03. The weighted average net operating income (NOI) debt yield is 13.9%.

Geography & Property Types

A key strength of the BANK5 2025-5YR16 CMBS deal is its diverse property type distribution, which enhances portfolio resilience. Multifamily properties constitute 33.2% of the total balance, while hospitality properties account for 21.7% of the balance. The geographic distribution of the properties across prime markets, including high-growth areas in New York City, San Jose, and Washington, DC.

About CRED iQ

CRED iQ is a market data provider that offers a robust suite of data and software solutions tailored for commercial real estate and finance professionals.

With over $2.3 trillion of CRE loans, CRED iQ delivers instant access to a comprehensive range of financial data and analytics for millions of properties in every market. CRED iQ’s data and analytical capabilities are instrumental in helping investors, lenders and brokers make informed and strategic decisions critical to their business.

THE DATA, INFORMATION AND/OR RELATED MATERAL (“DELIVERABLES”) IS BEING OFFERED AS-IS/WHERE-AS CONDITION. CRED-IQ MAKES NO REPRESENTATION OR WARRANTY AS TO QUALITY OR ACCURACY OF SUCH DELIVERABLES BEING PURCHASED, WHETHER EXPRESS OR IMPLIED, EITHER IN FACT OR BY OPERATION OF LAW, STATUTE, OR OTHERWISE, AND CRED-IQ SPECIFICALLY DISCLAIMS ANY AND ALL IMPLIED OR STATUTORY WARRANTIES INCLUDING WARRANTIES OF MERCHANTABILITY AND OF FITNESS FOR A PARTICULAR PURPOSE, TECHNICAL PERFORMANCE, AND NON-INFRINGEMENT. WITHOUT LIMITING THE FOREGOING, YOU AS CUSTOMER ACKNOWLEDGE THAT YOU HAVE NOT AND ARE NOT RELYING UPON ANY IMPLIED WARRANTY OF MERCHANTABILITY OR OF FITNESS FOR A PARTICULAR PURPOSE OR OTHERWISE, OR UPON ANY REPRESENTATION OR WARRANTY WHATSOEVER AS TO THE DELIVERABLES  IN ANY REGARDS WHATSOEVER, AND ACKNOWLEDGE  THAT CRED-IQ MAKES NO, AND HEREBY DISCLAIMS ANY, REPRESENTATION, WARRANTY OR GUARANTEE THAT THE PURCHASE, USE OR COMMERCIALIZATION OF ANY DELIVERABLES WILL BE USEFUL TO YOU OR FREE FROM INTERFERENCE. BY ACCEPTANCE OF THE DELIVERABLES, YOU HEREBY RELEASE CRED-IQ AND ITS AFFILIATES AND AGENTS FROM ALL CLAIMS, DAMAGES AND LIABILITY ARISING HEREUNDER.

2,085FollowersFollow
6SubscribersSubscribe