CRED iQ monitors distressed rates (DQ + SS%) and market performance for nearly 400 MSAs across the United States, covering over $900 billion in outstanding CRE debt. Distressed rates and month-over-month changes are presented below, by property type, for the 50 largest markets.
The hotel sector continued to exhibit the highest volatility by property type across several markets. By market-sector, hotel accounted for four of the Top 10 increases in distress and five of the Top 10 decreases in distress. Financial pressures for many lodging properties have been alleviated over the trailing 12 months, albeit maybe temporarily, through the use of forbearance agreements, or modifications in more severe cases of cash flow disruptions. As forbearance agreements expire, get extended, or new forbearance agreements are signed, rates of distress can fluctuate rather dramatically on a market-by-market basis. As an example, the distressed rate for the Nashville hotel market spiked this month following the delinquency of a $104.8 million loan secured by the 456-key Westin Nashville. A forbearance agreement was signed in October 2020 that deferred debt service payments through April 2021; the loan subsequently remained current through January 2022 until it became 30 days delinquent.
* Update on February 28, 2022: The servicer for the Westin Nashville loan posted debt service payments for December 2021 through February 2022. This adjustment would have made the Westin Nashville current in payment for the January 2022 reporting period. Based on the servicing reporting error, the loan secured by the Westin Nashville has been current in payment throughout its term.
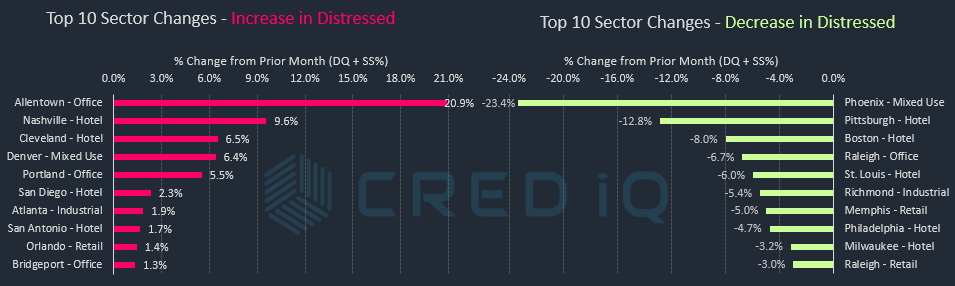
Similar to last month, the office sector showed additional signs of distress in select markets. Three of the Top 10 market-sectors with increased distress were represented by the office property type. The Allentown office market had the highest overall percentage increase, among the Top 50 MSAs, in its distressed rate compared to the prior month. This was primarily caused by the special servicing transfer of a $59.4 million loan secured by TEK Park — a 514,033-sf, 8-building office campus located in suburban Lehigh Valley, PA. The Allentown market was ranked as one of the best overall markets, within the Top 50 MSAs, as recently as last month due to strong performance in the industrial sector.
The distressed rate for the Phoenix market improved this month after the $165.0 million Scottsdale Quarter loan returned to the master servicer as a corrected mortgage. Scottsdale Quarter is a 541,971-sf mixed-use development comprising open-air retail storefronts and office space. As a result, the Phoenix mixed-use sector had the greatest month-over-month decline among all rates of distress.
The Minneapolis MSA has the highest overall distressed rate at 23.1%, which was unchanged from the prior month. Louisville (21.1%), New Orleans (14.8%), Cleveland (12.2%), and Milwaukee (10.7%) comprise the remaining markets with the highest rates of distress. The Raleigh market (0.3%) became the market with the lowest percentage of distress among the Top 50 MSAs this month following delinquency cures in the retail and office sectors.
For the full CRED DQ Report, download here:
| MSA – Property Type | DQ/SS (millions) | DS/SS (%) | Monthly Change |
| Allentown-Bethlehem-Easton, PA-NJ MSA | $95.6 | 2.9% | 1.8% |
| Allentown – Hotel | $0.0 | 0.0% | 0.0% |
| Allentown – Industrial | $0.0 | 0.0% | 0.0% |
| Allentown – Multifamily | $0.0 | 0.0% | 0.0% |
| Allentown – Office | $59.4 | 20.9% | 20.9% |
| Allentown – Other | $0.0 | 0.0% | 0.0% |
| Allentown – Retail | $36.2 | 9.7% | 0.0% |
| Allentown – Self Storage | $0.0 | 0.0% | 0.0% |
| Atlanta – Atlanta-Sandy Springs-Marietta, GA MSA | $779.9 | 3.0% | 0.0% |
| Atlanta – Hotel | $208.8 | 11.2% | -1.9% |
| Atlanta – Industrial | $18.0 | 1.9% | 1.9% |
| Atlanta – Multifamily | $04.0 | 0.0% | 0.0% |
| Atlanta – Office | $07.6 | 0.2% | 0.0% |
| Atlanta – Other | $0.0 | 0.0% | 0.0% |
| Atlanta – Retail | $541.5 | 20.5% | 0.0% |
| Atlanta – Self Storage | $0.0 | 0.0% | 0.0% |
| Austin – Austin-Round Rock, TX MSA | $183.7 | 2.1% | 0.1% |
| Austin – Hotel | $59.0 | 6.9% | 1.1% |
| Austin – Industrial | $0.0 | 0.0% | 0.0% |
| Austin – Multifamily | $36.0 | 0.6% | 0.0% |
| Austin – Office | $0.0 | 0.0% | 0.0% |
| Austin – Other | $0.0 | 0.0% | 0.0% |
| Austin – Retail | $86.0 | 11.5% | -0.2% |
| Austin – Self Storage | $02.6 | 2.9% | 0.2% |
| Baltimore – Baltimore-Towson, MD MSA | $408.4 | 4.2% | -0.1% |
| Baltimore – Hotel | $111.9 | 25.3% | 0.0% |
| Baltimore – Industrial | $0.0 | 0.0% | 0.0% |
| Baltimore – Multifamily | $06.1 | 0.1% | 0.0% |
| Baltimore – Office | $22.8 | 3.9% | -0.1% |
| Baltimore – Other | $11.8 | 3.2% | 0.0% |
| Baltimore – Retail | $255.8 | 23.7% | 0.3% |
| Baltimore – Self Storage | $0.0 | 0.0% | 0.0% |
| Birmingham – Birmingham-Hoover, AL MSA | $63.4 | 2.7% | 0.2% |
| Birmingham – Hotel | $40.6 | 38.5% | 0.0% |
| Birmingham – Industrial | $0.0 | 0.0% | 0.0% |
| Birmingham – Multifamily | $0.0 | 0.0% | -0.1% |
| Birmingham – Office | $0.0 | 0.0% | 0.0% |
| Birmingham – Other | $0.0 | 0.0% | 0.0% |
| Birmingham – Retail | $22.8 | 3.2% | 0.0% |
| Birmingham – Self Storage | $0.0 | 0.0% | 0.0% |
| Boston – Boston-Cambridge-Quincy, MA-NH MSA | $174.6 | 1.0% | -0.3% |
| Boston – Hotel | $46.7 | 6.6% | -8.0% |
| Boston – Industrial | $0.0 | 0.0% | 0.0% |
| Boston – Multifamily | $12.3 | 0.2% | 0.2% |
| Boston – Office | $0.0 | 0.0% | 0.0% |
| Boston – Other | $0.0 | 0.0% | 0.0% |
| Boston – Retail | $115.7 | 6.3% | 0.2% |
| Boston – Self Storage | $0.0 | 0.0% | 0.0% |
| Bridgeport – Bridgeport-Stamford-Norwalk, CT MSA | $224.5 | 5.8% | 0.2% |
| Bridgeport – Hotel | $63.1 | 51.2% | -0.3% |
| Bridgeport – Industrial | $17.8 | 14.1% | 0.4% |
| Bridgeport – Multifamily | $03.4 | 0.2% | 0.1% |
| Bridgeport – Office | $108.5 | 10.0% | 1.3% |
| Bridgeport – Other | $09.8 | 2.4% | 0.0% |
| Bridgeport – Retail | $21.7 | 7.2% | 0.0% |
| Bridgeport – Self Storage | $0.0 | 0.0% | 0.0% |
| Charlotte – Charlotte-Gastonia-Concord, NC-SC MSA | $291.7 | 3.7% | 0.9% |
| Charlotte – Hotel | $87.8 | 7.4% | -1.0% |
| Charlotte – Industrial | $0.0 | 0.0% | 0.0% |
| Charlotte – Multifamily | $0.7 | 0.0% | 0.0% |
| Charlotte – Office | $21.3 | 2.3% | 0.0% |
| Charlotte – Other | $85.0 | 25.4% | 0.2% |
| Charlotte – Retail | $96.9 | 8.2% | 6.7% |
| Charlotte – Self Storage | $0.0 | 0.0% | 0.0% |
| Chicago – Chicago-Naperville-Joliet, IL-IN-WI MSA | $2,410.6 | 9.3% | -0.6% |
| Chicago – Hotel | $1,013.7 | 48.0% | -0.8% |
| Chicago – Industrial | $03.8 | 0.2% | 0.0% |
| Chicago – Multifamily | $118.9 | 1.3% | 0.0% |
| Chicago – Office | $767.3 | 10.7% | -1.6% |
| Chicago – Other | $239.6 | 12.7% | 0.4% |
| Chicago – Retail | $267.4 | 8.2% | -0.8% |
| Chicago – Self Storage | $0.0 | 0.0% | 0.0% |
| Cincinnati – Cincinnati-Middletown, OH-KY-IN MSA | $295.6 | 7.9% | 0.2% |
| Cincinnati – Hotel | $126.6 | 42.3% | 0.0% |
| Cincinnati – Industrial | $0.0 | 0.0% | 0.0% |
| Cincinnati – Multifamily | $0.6 | 0.0% | 0.0% |
| Cincinnati – Office | $16.4 | 3.3% | 0.9% |
| Cincinnati – Other | $15.6 | 5.3% | 0.0% |
| Cincinnati – Retail | $135.3 | 22.4% | 0.9% |
| Cincinnati – Self Storage | $01.0 | 1.9% | 0.2% |
| Cleveland – Cleveland-Elyria-Mentor, OH MSA | $477.0 | 12.2% | 0.5% |
| Cleveland – Hotel | $97.7 | 52.1% | 6.5% |
| Cleveland – Industrial | $0.0 | 0.0% | 0.0% |
| Cleveland – Multifamily | $08.8 | 0.6% | -0.5% |
| Cleveland – Office | $104.4 | 13.1% | 0.2% |
| Cleveland – Other | $176.6 | 42.9% | 0.3% |
| Cleveland – Retail | $89.4 | 12.8% | 0.7% |
| Cleveland – Self Storage | $0.0 | 0.0% | 0.0% |
| Columbus, OH – Columbus, OH MSA | $242.6 | 4.1% | 0.0% |
| Columbus, OH – Hotel | $83.7 | 26.7% | 0.2% |
| Columbus, OH – Industrial | $11.9 | 3.4% | 0.0% |
| Columbus, OH – Multifamily | $02.0 | 0.1% | 0.1% |
| Columbus, OH – Office | $12.4 | 2.3% | -0.8% |
| Columbus, OH – Other | $0.0 | 0.0% | 0.0% |
| Columbus, OH – Retail | $121.6 | 15.1% | 0.1% |
| Columbus, OH – Self Storage | $11.0 | 19.0% | -0.2% |
| Dallas – Dallas-Fort Worth-Arlington, TX MSA | $632.8 | 1.9% | -0.2% |
| Dallas – Hotel | $235.5 | 6.7% | -1.5% |
| Dallas – Industrial | $01.7 | 0.1% | 0.0% |
| Dallas – Multifamily | $46.9 | 0.2% | 0.0% |
| Dallas – Office | $152.5 | 4.1% | 0.0% |
| Dallas – Other | $23.6 | 1.1% | 0.0% |
| Dallas – Retail | $160.6 | 6.9% | 0.2% |
| Dallas – Self Storage | $11.9 | 3.5% | 0.8% |
| Denver – Denver-Aurora, CO MSA | $353.6 | 2.1% | 0.3% |
| Denver – Hotel | $36.0 | 4.2% | 0.8% |
| Denver – Industrial | $0.0 | 0.0% | 0.0% |
| Denver – Multifamily | $0.0 | 0.0% | 0.0% |
| Denver – Office | $193.0 | 9.7% | -0.8% |
| Denver – Other | $66.5 | 7.1% | 6.4% |
| Denver – Retail | $54.8 | 3.9% | -0.1% |
| Denver – Self Storage | $03.3 | 2.0% | 0.1% |
| Detroit – Detroit-Warren-Livonia, MI MSA | $450.6 | 5.2% | 0.8% |
| Detroit – Hotel | $214.0 | 31.1% | 1.3% |
| Detroit – Industrial | $18.5 | 3.6% | -0.1% |
| Detroit – Multifamily | $27.7 | 0.8% | 0.3% |
| Detroit – Office | $0.0 | 0.0% | 0.0% |
| Detroit – Other | $22.2 | 3.7% | 0.0% |
| Detroit – Retail | $168.2 | 10.5% | 3.8% |
| Detroit – Self Storage | $0.0 | 0.0% | 0.0% |
| Hartford – Hartford-West Hartford-East Hartford, CT MSA | $193.9 | 7.9% | -0.5% |
| Hartford – Hotel | $76.2 | 55.8% | -2.5% |
| Hartford – Industrial | $0.0 | 0.0% | 0.0% |
| Hartford – Multifamily | $0.0 | 0.0% | 0.0% |
| Hartford – Office | $87.6 | 22.3% | 0.0% |
| Hartford – Other | $0.0 | 0.0% | -0.6% |
| Hartford – Retail | $30.2 | 13.0% | 0.2% |
| Hartford – Self Storage | $0.0 | 0.0% | 0.0% |
| Houston – Houston-Sugar Land-Baytown, TX MSA | $1,265.0 | 5.4% | -0.3% |
| Houston – Hotel | $632.3 | 52.6% | -0.3% |
| Houston – Industrial | $04.2 | 0.9% | 0.1% |
| Houston – Multifamily | $37.5 | 0.3% | -0.5% |
| Houston – Office | $454.6 | 12.4% | 0.4% |
| Houston – Other | $0.0 | 0.0% | 0.0% |
| Houston – Retail | $106.5 | 2.8% | 0.0% |
| Houston – Self Storage | $29.9 | 8.1% | -2.3% |
| Indianapolis – Indianapolis-Carmel, IN MSA | $303.1 | 6.1% | 0.0% |
| Indianapolis – Hotel | $99.3 | 17.6% | -0.8% |
| Indianapolis – Industrial | $0.0 | 0.0% | 0.0% |
| Indianapolis – Multifamily | $76.7 | 3.2% | 0.0% |
| Indianapolis – Office | $75.4 | 12.8% | 1.1% |
| Indianapolis – Other | $09.8 | 2.8% | -0.2% |
| Indianapolis – Retail | $37.9 | 7.4% | 0.1% |
| Indianapolis – Self Storage | $04.0 | 5.4% | 0.0% |
| Jacksonville – Jacksonville, FL MSA | $51.5 | 1.0% | 0.1% |
| Jacksonville – Hotel | $38.5 | 9.3% | 0.4% |
| Jacksonville – Industrial | $0.0 | 0.0% | 0.0% |
| Jacksonville – Multifamily | $01.5 | 0.0% | 0.0% |
| Jacksonville – Office | $0.0 | 0.0% | 0.0% |
| Jacksonville – Other | $0.0 | 0.0% | 0.0% |
| Jacksonville – Retail | $11.5 | 2.8% | 0.7% |
| Jacksonville – Self Storage | $0.0 | 0.0% | 0.0% |
| Kansas City – Kansas City, MO-KS MSA | $82.2 | 1.6% | -0.3% |
| Kansas City – Hotel | $28.5 | 11.9% | -2.0% |
| Kansas City – Industrial | $0.0 | 0.0% | 0.0% |
| Kansas City – Multifamily | $12.3 | 0.5% | 0.2% |
| Kansas City – Office | $0.0 | 0.0% | 0.0% |
| Kansas City – Other | $02.8 | 1.2% | 0.0% |
| Kansas City – Retail | $37.0 | 5.9% | -2.4% |
| Kansas City – Self Storage | $01.7 | 0.8% | 0.0% |
| Las Vegas – Las Vegas-Paradise, NV MSA | $356.8 | 1.8% | -0.2% |
| Las Vegas – Hotel | $18.3 | 0.3% | 0.0% |
| Las Vegas – Industrial | $0.0 | 0.0% | 0.0% |
| Las Vegas – Multifamily | $0.0 | 0.0% | -0.1% |
| Las Vegas – Office | $27.8 | 4.4% | -0.8% |
| Las Vegas – Other | $0.0 | 0.0% | 0.0% |
| Las Vegas – Retail | $307.9 | 6.5% | -0.5% |
| Las Vegas – Self Storage | $02.8 | 1.5% | 0.1% |
| Los Angeles – Los Angeles-Long Beach-Santa Ana, CA MSA | $1,276.6 | 2.6% | -0.2% |
| Los Angeles – Hotel | $488.3 | 12.2% | -1.6% |
| Los Angeles – Industrial | $02.0 | 0.2% | 0.0% |
| Los Angeles – Multifamily | $127.1 | 0.6% | 0.0% |
| Los Angeles – Office | $68.6 | 0.6% | 0.0% |
| Los Angeles – Other | $72.1 | 2.4% | -1.5% |
| Los Angeles – Retail | $518.5 | 8.1% | -0.1% |
| Los Angeles – Self Storage | $0.0 | 0.0% | 0.0% |
| Louisville – Louisville/Jefferson County, KY-IN MSA | $624.5 | 21.1% | 6.9% |
| Louisville – Hotel | $242.9 | 55.4% | 51.4% |
| Louisville – Industrial | $0.0 | 0.0% | 0.0% |
| Louisville – Multifamily | $04.3 | 0.4% | 0.0% |
| Louisville – Office | $0.0 | 0.0% | 0.0% |
| Louisville – Other | $0.0 | 0.0% | 0.0% |
| Louisville – Retail | $377.4 | 59.0% | 0.0% |
| Louisville – Self Storage | $0.0 | 0.0% | 0.0% |
| Memphis – Memphis, TN-AR-MS MSA | $119.9 | 5.4% | -1.0% |
| Memphis – Hotel | $40.8 | 23.3% | 0.8% |
| Memphis – Industrial | $0.0 | 0.0% | 0.0% |
| Memphis – Multifamily | $17.8 | 1.7% | 0.0% |
| Memphis – Office | $0.0 | 0.0% | 0.0% |
| Memphis – Other | $18.4 | 24.4% | -11.7% |
| Memphis – Retail | $41.3 | 12.3% | -5.0% |
| Memphis – Self Storage | $01.7 | 1.2% | 0.0% |
| Miami – Miami-Fort Lauderdale-Pompano Beach, FL MSA | $693.8 | 3.2% | 0.5% |
| Miami – Hotel | $275.0 | 6.3% | 0.2% |
| Miami – Industrial | $0.0 | 0.0% | 0.0% |
| Miami – Multifamily | $14.1 | 0.2% | 0.1% |
| Miami – Office | $07.6 | 0.4% | 0.0% |
| Miami – Other | $08.6 | 0.5% | 0.0% |
| Miami – Retail | $388.4 | 8.1% | 2.2% |
| Miami – Self Storage | $0.0 | 0.0% | 0.0% |
| Milwaukee – Milwaukee-Waukesha-West Allis, WI MSA | $246.5 | 10.7% | -0.3% |
| Milwaukee – Hotel | $35.5 | 23.1% | -3.2% |
| Milwaukee – Industrial | $0.0 | 0.0% | 0.0% |
| Milwaukee – Multifamily | $0.0 | 0.0% | 0.0% |
| Milwaukee – Office | $59.3 | 11.8% | 0.8% |
| Milwaukee – Other | $0.0 | 0.0% | 0.0% |
| Milwaukee – Retail | $151.8 | 31.1% | 0.2% |
| Milwaukee – Self Storage | $0.0 | 0.0% | 0.0% |
| Minneapolis – Minneapolis-St. Paul-Bloomington, MN-WI MSA | $1,906.2 | 23.1% | 0.0% |
| Minneapolis – Hotel | $308.5 | 51.0% | 0.0% |
| Minneapolis – Industrial | $0.0 | 0.0% | 0.0% |
| Minneapolis – Multifamily | $0.0 | 0.0% | 0.0% |
| Minneapolis – Office | $154.3 | 7.6% | -0.1% |
| Minneapolis – Other | $11.6 | 2.7% | -0.3% |
| Minneapolis – Retail | $1,431.8 | 75.1% | 3.7% |
| Minneapolis – Self Storage | $0.0 | 0.0% | 0.0% |
| Nashville – Nashville-Davidson-Murfreesboro-Franklin, TN MSA | $381.2 | 6.1% | 1.9% |
| Nashville – Hotel | $240.0 | 18.4% | 9.6% |
| Nashville – Industrial | $0.0 | 0.0% | 0.0% |
| Nashville – Multifamily | $0.0 | 0.0% | 0.0% |
| Nashville – Office | $0.0 | 0.0% | 0.0% |
| Nashville – Other | $0.0 | 0.0% | 0.0% |
| Nashville – Retail | $141.1 | 18.3% | 0.0% |
| Nashville – Self Storage | $0.0 | 0.0% | 0.0% |
| New Orleans – New Orleans-Metairie-Kenner, LA MSA | $491.7 | 14.8% | -0.5% |
| New Orleans – Hotel | $437.6 | 41.3% | -1.5% |
| New Orleans – Industrial | $0.0 | 0.0% | 0.0% |
| New Orleans – Multifamily | $13.9 | 1.6% | -0.1% |
| New Orleans – Office | $17.3 | 3.6% | 0.3% |
| New Orleans – Other | $0.3 | 0.2% | 0.0% |
| New Orleans – Retail | $22.6 | 3.2% | 0.1% |
| New Orleans – Self Storage | $0.0 | 0.0% | 0.0% |
| New York City – New York-Northern New Jersey-Long Island, NY-NJ-PA MSA | $6,342.6 | 5.4% | -0.1% |
| New York City – Hotel | $1,535.0 | 41.6% | -1.5% |
| New York City – Industrial | $07.5 | 0.4% | 0.0% |
| New York City – Multifamily | $471.5 | 1.4% | -0.1% |
| New York City – Office | $1,421.8 | 3.4% | 0.2% |
| New York City – Other | $1,442.2 | 6.6% | -0.2% |
| New York City – Retail | $1,464.6 | 11.2% | 0.0% |
| New York City – Self Storage | $0.0 | 0.0% | 0.0% |
| Orlando – Orlando-Kissimmee, FL MSA | $188.9 | 1.8% | -0.5% |
| Orlando – Hotel | $88.5 | 3.2% | -2.5% |
| Orlando – Industrial | $0.0 | 0.0% | 0.0% |
| Orlando – Multifamily | $01.9 | 0.0% | 0.0% |
| Orlando – Office | $47.1 | 9.5% | 0.0% |
| Orlando – Other | $0.0 | 0.0% | 0.0% |
| Orlando – Retail | $51.5 | 6.1% | 1.4% |
| Orlando – Self Storage | $0.0 | 0.0% | 0.0% |
| Philadelphia – Philadelphia-Camden-Wilmington, PA-NJ-DE-MD MSA | $813.3 | 4.5% | -0.3% |
| Philadelphia – Hotel | $303.3 | 34.0% | -4.7% |
| Philadelphia – Industrial | $0.0 | 0.0% | 0.0% |
| Philadelphia – Multifamily | $105.3 | 1.2% | -0.1% |
| Philadelphia – Office | $132.4 | 3.3% | -0.1% |
| Philadelphia – Other | $47.7 | 3.6% | 0.0% |
| Philadelphia – Retail | $224.5 | 9.3% | -0.2% |
| Philadelphia – Self Storage | $0.0 | 0.0% | 0.0% |
| Phoenix – Phoenix-Mesa-Scottsdale, AZ MSA | $251.6 | 1.4% | -0.9% |
| Phoenix – Hotel | $38.9 | 2.4% | 0.1% |
| Phoenix – Industrial | $10.1 | 2.1% | 0.0% |
| Phoenix – Multifamily | $0.0 | 0.0% | 0.0% |
| Phoenix – Office | $23.7 | 1.1% | 0.0% |
| Phoenix – Other | $15.5 | 2.1% | -23.4% |
| Phoenix – Retail | $163.4 | 7.8% | 0.4% |
| Phoenix – Self Storage | $0.0 | 0.0% | 0.0% |
| Pittsburgh – Pittsburgh, PA MSA | $103.2 | 2.2% | -0.8% |
| Pittsburgh – Hotel | $72.1 | 27.1% | -12.8% |
| Pittsburgh – Industrial | $0.0 | 0.0% | 0.0% |
| Pittsburgh – Multifamily | $0.0 | 0.0% | 0.0% |
| Pittsburgh – Office | $15.3 | 1.6% | 0.0% |
| Pittsburgh – Other | $08.0 | 2.1% | 0.0% |
| Pittsburgh – Retail | $07.8 | 1.2% | 0.0% |
| Pittsburgh – Self Storage | $0.0 | 0.0% | 0.0% |
| Portland – Portland-Vancouver-Beaverton, OR-WA MSA | $502.1 | 7.4% | 0.4% |
| Portland – Hotel | $471.1 | 54.5% | 10.4% |
| Portland – Industrial | $0.0 | 0.0% | 0.0% |
| Portland – Multifamily | $10.2 | 0.2% | 0.0% |
| Portland – Office | $20.8 | 6.1% | 5.5% |
| Portland – Other | $0.0 | 0.0% | 0.0% |
| Portland – Retail | $0.0 | 0.0% | 0.0% |
| Portland – Self Storage | $0.0 | 0.0% | 0.0% |
| Raleigh – Raleigh-Cary, NC MSA | $11.9 | 0.3% | -0.9% |
| Raleigh – Hotel | $11.9 | 3.7% | -0.1% |
| Raleigh – Industrial | $0.0 | 0.0% | 0.0% |
| Raleigh – Multifamily | $0.0 | 0.0% | 0.0% |
| Raleigh – Office | $0.0 | 0.0% | -6.7% |
| Raleigh – Other | $0.0 | 0.0% | 0.0% |
| Raleigh – Retail | $0.0 | 0.0% | -3.0% |
| Raleigh – Self Storage | $0.0 | 0.0% | 0.0% |
| Richmond – Richmond, VA MSA | $121.7 | 3.6% | -0.2% |
| Richmond – Hotel | $39.3 | 14.1% | -1.1% |
| Richmond – Industrial | $0.0 | 0.0% | -5.4% |
| Richmond – Multifamily | $0.0 | 0.0% | 0.0% |
| Richmond – Office | $0.0 | 0.0% | 0.0% |
| Richmond – Other | $0.0 | 0.0% | 0.0% |
| Richmond – Retail | $82.4 | 15.5% | -0.4% |
| Richmond – Self Storage | $0.0 | 0.0% | 0.0% |
| Riverside – Riverside-San Bernardino-Ontario, CA MSA | $370.0 | 3.9% | 0.1% |
| Riverside – Hotel | $79.7 | 26.0% | 5.3% |
| Riverside – Industrial | $0.0 | 0.0% | 0.0% |
| Riverside – Multifamily | $06.7 | 0.2% | 0.2% |
| Riverside – Office | $0.0 | 0.0% | 0.0% |
| Riverside – Other | $0.0 | 0.0% | 0.0% |
| Riverside – Retail | $283.6 | 13.7% | 0.6% |
| Riverside – Self Storage | $0.0 | 0.0% | 0.0% |
| Sacramento – Sacramento-Arden-Arcade-Roseville, CA MSA | $30.3 | 0.5% | 0.0% |
| Sacramento – Hotel | $05.8 | 1.6% | 0.0% |
| Sacramento – Industrial | $0.0 | 0.0% | 0.0% |
| Sacramento – Multifamily | $0.0 | 0.0% | 0.0% |
| Sacramento – Office | $10.9 | 2.1% | 0.1% |
| Sacramento – Other | $0.0 | 0.0% | 0.0% |
| Sacramento – Retail | $13.7 | 1.7% | 0.0% |
| Sacramento – Self Storage | $0.0 | 0.0% | 0.0% |
| Salt Lake City – Salt Lake City, UT MSA | $47.1 | 1.2% | 0.0% |
| Salt Lake City – Hotel | $47.1 | 16.5% | 0.3% |
| Salt Lake City – Industrial | $0.0 | 0.0% | 0.0% |
| Salt Lake City – Multifamily | $0.0 | 0.0% | 0.0% |
| Salt Lake City – Office | $0.0 | 0.0% | 0.0% |
| Salt Lake City – Other | $0.0 | 0.0% | 0.0% |
| Salt Lake City – Retail | $0.0 | 0.0% | 0.0% |
| Salt Lake City – Self Storage | $0.0 | 0.0% | 0.0% |
| San Antonio – San Antonio, TX MSA | $141.2 | 2.2% | -0.2% |
| San Antonio – Hotel | $08.4 | 2.5% | 1.7% |
| San Antonio – Industrial | $0.0 | 0.0% | 0.0% |
| San Antonio – Multifamily | $0.0 | 0.0% | -0.1% |
| San Antonio – Office | $0.0 | 0.0% | 0.0% |
| San Antonio – Other | $0.0 | 0.0% | 0.0% |
| San Antonio – Retail | $131.3 | 15.0% | -1.3% |
| San Antonio – Self Storage | $01.5 | 1.1% | 0.1% |
| San Diego – San Diego-Carlsbad-San Marcos, CA MSA | $258.8 | 2.3% | 0.4% |
| San Diego – Hotel | $122.3 | 6.3% | 2.3% |
| San Diego – Industrial | $0.0 | 0.0% | 0.0% |
| San Diego – Multifamily | $0.0 | 0.0% | 0.0% |
| San Diego – Office | $0.0 | 0.0% | 0.0% |
| San Diego – Other | $20.6 | 3.3% | 0.0% |
| San Diego – Retail | $115.9 | 9.7% | 0.0% |
| San Diego – Self Storage | $0.0 | 0.0% | 0.0% |
| San Francisco – San Francisco-Oakland-Fremont, CA MSA | $304.4 | 1.3% | 0.0% |
| San Francisco – Hotel | $189.5 | 8.3% | 0.1% |
| San Francisco – Industrial | $0.0 | 0.0% | 0.0% |
| San Francisco – Multifamily | $17.8 | 0.2% | 0.0% |
| San Francisco – Office | $18.8 | 0.2% | 0.0% |
| San Francisco – Other | $30.6 | 1.7% | 0.0% |
| San Francisco – Retail | $47.7 | 3.8% | 0.1% |
| San Francisco – Self Storage | $0.0 | 0.0% | 0.0% |
| San Jose – San Jose-Sunnyvale-Santa Clara, CA MSA | $104.3 | 0.7% | 0.0% |
| San Jose – Hotel | $89.6 | 4.5% | 0.1% |
| San Jose – Industrial | $0.0 | 0.0% | 0.0% |
| San Jose – Multifamily | $0.0 | 0.0% | 0.0% |
| San Jose – Office | $14.7 | 0.2% | 0.0% |
| San Jose – Other | $0.0 | 0.0% | 0.0% |
| San Jose – Retail | $0.0 | 0.0% | 0.0% |
| San Jose – Self Storage | $0.0 | 0.0% | 0.0% |
| Seattle – Seattle-Tacoma-Bellevue, WA MSA | $100.0 | 0.6% | -0.2% |
| Seattle – Hotel | $100.0 | 7.8% | -1.3% |
| Seattle – Industrial | $0.0 | 0.0% | 0.0% |
| Seattle – Multifamily | $0.0 | 0.0% | 0.0% |
| Seattle – Office | $0.0 | 0.0% | 0.0% |
| Seattle – Other | $0.0 | 0.0% | 0.0% |
| Seattle – Retail | $0.0 | 0.0% | -0.4% |
| Seattle – Self Storage | $0.0 | 0.0% | 0.0% |
| St. Louis – St. Louis, MO-IL MSA | $390.0 | 9.4% | -0.5% |
| St. Louis – Hotel | $34.4 | 14.6% | -6.0% |
| St. Louis – Industrial | $0.0 | 0.0% | 0.0% |
| St. Louis – Multifamily | $23.1 | 1.4% | 0.0% |
| St. Louis – Office | $107.1 | 19.2% | -0.2% |
| St. Louis – Other | $26.4 | 4.9% | -0.3% |
| St. Louis – Retail | $199.0 | 20.4% | 0.6% |
| St. Louis – Self Storage | $0.0 | 0.0% | 0.0% |
| Tampa – Tampa-St. Petersburg-Clearwater, FL | $301.3 | 3.3% | 0.1% |
| Tampa – Hotel | $30.8 | 2.7% | 0.8% |
| Tampa – Industrial | $0.0 | 0.0% | 0.0% |
| Tampa – Multifamily | $02.6 | 0.0% | 0.0% |
| Tampa – Office | $23.8 | 4.2% | 0.0% |
| Tampa – Other | $0.0 | 0.0% | 0.0% |
| Tampa – Retail | $244.2 | 26.3% | 0.3% |
| Tampa – Self Storage | $0.0 | 0.0% | 0.0% |
| Tucson – Tucson, AZ MSA | $163.8 | 5.6% | -0.3% |
| Tucson – Hotel | $01.4 | 0.6% | 0.0% |
| Tucson – Industrial | $0.0 | 0.0% | 0.0% |
| Tucson – Multifamily | $0.0 | 0.0% | 0.0% |
| Tucson – Office | $0.0 | 0.0% | 0.0% |
| Tucson – Other | $0.0 | 0.0% | 0.0% |
| Tucson – Retail | $162.5 | 23.9% | -1.3% |
| Tucson – Self Storage | $0.0 | 0.0% | 0.0% |
| Virginia Beach – Virginia Beach-Norfolk-Newport News, VA-NC MSA | $209.0 | 4.9% | 1.9% |
| Virginia Beach – Hotel | $09.3 | 2.1% | 0.0% |
| Virginia Beach – Industrial | $21.2 | 13.4% | 0.0% |
| Virginia Beach – Multifamily | $0.0 | 0.0% | 0.0% |
| Virginia Beach – Office | $0.0 | 0.0% | 0.0% |
| Virginia Beach – Other | $0.0 | 0.0% | 0.0% |
| Virginia Beach – Retail | $178.5 | 21.0% | 9.3% |
| Virginia Beach – Self Storage | $0.0 | 0.0% | 0.0% |
| Washington, DC – Washington-Arlington-Alexandria, DC-VA-MD-WV MSA | $825.5 | 3.0% | 0.0% |
| Washington, DC – Hotel | $48.5 | 5.1% | -0.4% |
| Washington, DC – Industrial | $11.2 | 2.1% | 0.0% |
| Washington, DC – Multifamily | $01.3 | 0.0% | 0.0% |
| Washington, DC – Office | $366.1 | 6.0% | 0.3% |
| Washington, DC – Other | $249.7 | 13.5% | 0.7% |
| Washington, DC – Retail | $148.8 | 5.6% | -0.1% |
| Washington, DC – Self Storage | $0.0 | 0.0% | 0.0% |
| Grand Total | $26,658.7 | 4.1% | 0.0% |
About CRED iQ
CRED iQ is a commercial real estate data, analytics, and valuation platform providing actionable intelligence to CRE and capital markets investors. Subscribers to CRED iQ use the platform to identify valuable leads for leasing, lending, refinancing, distressed debt, and acquisition opportunities. Our data platform is powered by over $2.0 trillion of CMBS, CRE CLO, SBLL, Ginnie Mae, FHA/HUD, and Freddie Mac loan and property data.