
SS = All specially serviced CMBS loans in the conduit and SASB universe, including current, delinquent and REO
DQ + SS = All distressed CMBS loans in the conduit and SASB universe that are delinquent, specially serviced, or a combination of both
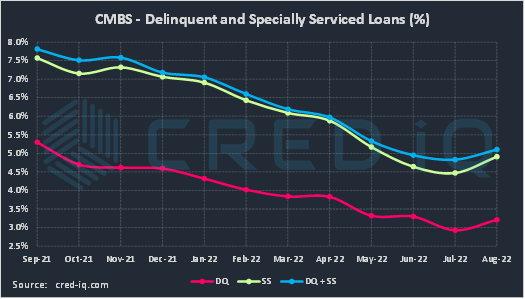
The CRED iQ delinquency rate for CMBS rose higher during the August 2022 reporting period, exhibiting the first month-over-month increase in over two years. This month, the delinquency rate, equal to the percentage of all delinquent specially serviced loans and delinquent non-specially serviced loans, for CRED iQ’s sample universe of $500+ billion in CMBS conduit and single asset single-borrower (SASB) loans was 3.21%, which was 28 bps higher than last month’s delinquency rate of 2.93%. CRED iQ’s special servicing rate, equal to the percentage of CMBS loans that are with the special servicer (delinquent and non-delinquent), increased month-over-month to 4.91% from 4.47%. The special servicing rate increased to its highest level over the past three months. Aggregating the two indicators of distress – delinquency rate and special servicing rate – into an overall distressed rate (DQ + SS%) equals 5.10% of CMBS loans that are specially serviced, delinquent, or a combination of both. The overall distressed rate increased compared to the prior month’s distressed rate of 4.47%. These distressed rates typically track slightly higher than special servicing rates as most delinquent loans are also with the special servicer.
SS = All specially serviced CMBS loans in the conduit and SASB universe, including current, delinquent and REO
DQ + SS = All distressed CMBS loans in the conduit and SASB universe that are delinquent, specially serviced, or a combination of both
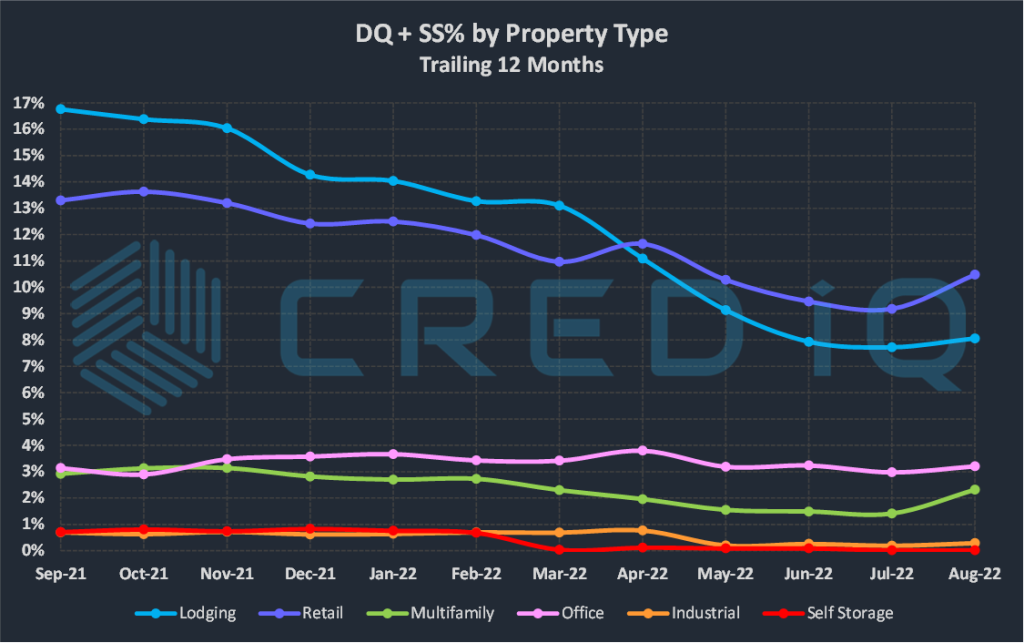
By property type, the delinquency rate modestly increased across several sectors, but property-specific delinquency rates generally remained lower compared to rates as of June 2022. The multifamily delinquency rate, equal to 1.90%, exhibited the most notable month-over-month increase. Higher multifamily delinquency was attributed to a $481 million mortgage, secured by 43 multifamily properties located across the Midwest and Southwest. The loan defaulted at maturity in July 2022 and subsequently transferred to special servicing. Based on the most recently reported financial statements for the multifamily portfolio, the properties were not producing sufficient cash flow to cover mortgage payments. An extension was requested by the borrower to allow time to facilitate a sale of the properties or attempt to refinance the debt.
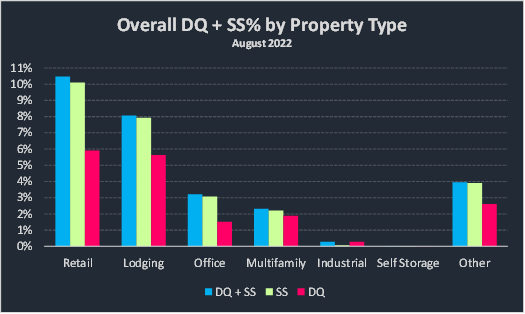
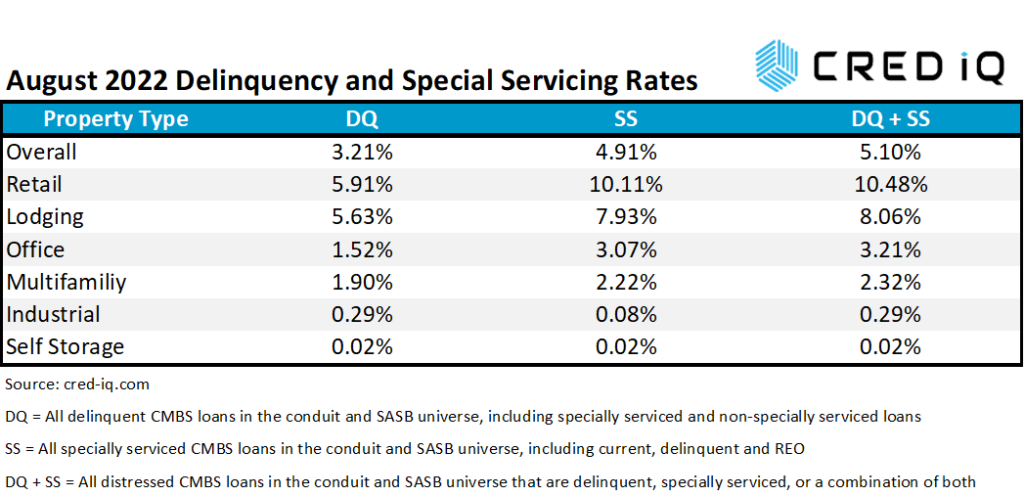
Retail has the highest delinquency rate (5.91%) by property type, marking the fourth consecutive month since it surpassed the lodging delinquency rate, which was equal to 5.63% as of the August 2022 reporting period. The spike in the multifamily delinquency rate this month was enough to push it higher than the office delinquency rate of 1.52%. Industrial (0.29%) and self-storage (0.02%) delinquency rates were relatively unchanged compared to the prior month.
Special servicing rates increased sharply across most major property types during the August 2022 remittance period. The largest loan to transfer to special servicing this month was the aforementioned $481 million Midwest and Southwest multifamily portfolio. Additionally, a large loan, totaling $240 million, secured by a 20-property lodging portfolio owned by a joint venture between PIMCO and Fulcrum Hospitality also transferred, impacted the special servicing rate for hotels (7.93%).
The retail sector exhibited the highest month-over-month increase among special servicing rates by property type, primarily due to the transfers of several high-profile regional malls. The retail special servicing rate increased to 10.11%, compared to 8.9% from the prior month. Among notable regional malls securing loans that transferred to special servicing this month were Santa Monica Place in California, Clackamas Town Center in Oregon, and Riverchase Galleria in Alabama.
CRED iQ’s CMBS distressed rate (DQ + SS%) by property type accounts for loans that qualify for either delinquent or special servicing subsets. This month, the overall distressed rate for CMBS increased in tandem with increases in delinquency and special servicing rates. Higher property-specific special servicing rates were the main drivers behind increases in distressed rates across all property types. Regional malls secured many of the newly distressed loans with the highest individual allocated loan amounts. Two of the largest allocated loan amounts were the $285 million Santa Monica Place loan and the $216 million Clackamas Town Center loan.
About CRED iQ
CRED iQ is a commercial real estate data, analytics, and valuation platform providing actionable intelligence to CRE and capital markets investors. Subscribers to CRED iQ use the platform to identify valuable leads for leasing, lending, refinancing, distressed debt, and acquisition opportunities. Our data platform is powered by over $2.0 trillion of CMBS, CRE CLO, SBLL, and GSE Agency loan and property data.
