
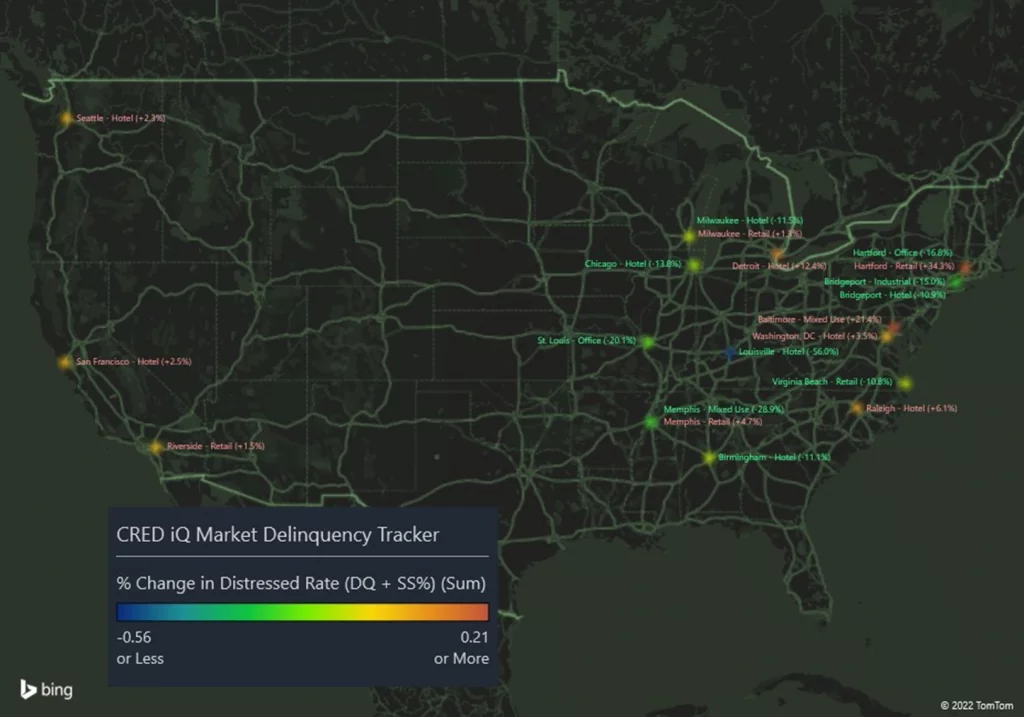
CRED iQ monitors distressed rates and market performance for nearly 400 MSAs across the United States, covering over $900 billion in outstanding commercial real estate (CRE) debt. Distressed rates (DQ + SS%) include loans that are specially serviced, delinquent, or a combination of both. Distressed rates and month-over-month changes are presented below for the 50 largest MSAs, broken out by property type for a granular view of distress by market-sector.
On high level, only seven of the Top 50 MSAs tracked by CRED iQ exhibited an overall month-over-month increase in distress in May 2022, without regard to property type sector. There were 43 markets, or 86% of the Top 50, with overall improvements in the percentage of distressed CRE loans within the CMBS universe compared to the prior month. Among the MSAs with the sharpest declines this month were Louisville and Chicago.
Looking at a more granular level by property type, the lodging sector continues to lead the way as the most common property sector to show improvements, in concert with prior months. Loans secured by lodging properties accounted for six of the 10 largest declines in distress by market-sector, including Chicago, Milwaukee, and Bridgeport, CT.
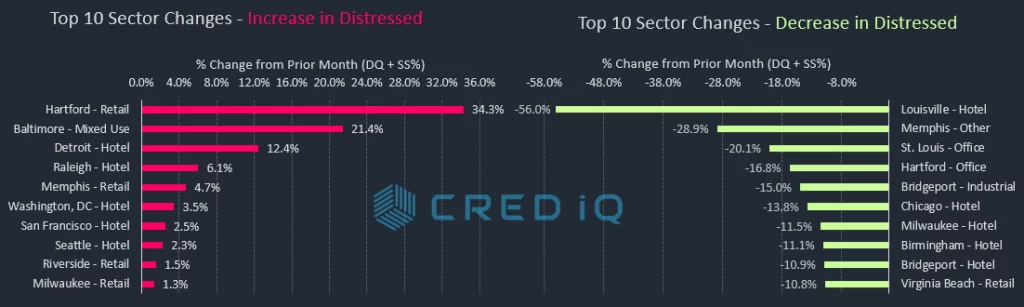
The most common property types among increases in distress by market-sector were hotel and retail. The Baltimore mixed-use market experienced one of the highest month-over-month increase in distress. A $67.9 million mortgage secured by the Gallery at Harborplace failed to pay off at maturity on May 1, 2022, which contributed to the near entirety of the increase in distress for the market. Gallery at Harborplace is a 406,594-sf mixed-use property comprising retail and office space. The Detroit hotel market was also among the Top 10 market-sectors to show a higher month-over-month rate of distress. A major contributor to Detroit’s lodging distress is a $77 million loan secured by the 453-key Westin Book Cadillac hotel. The loan was modified in December 2021 after transferring to special servicing in August 2020. The loan returned to the master servicer in March 2022 and was current as of April but became 30 days delinquent as of May 2022.
The Minneapolis MSA has the highest overall distressed rate at 22.1%, which was a slight decline compared to the prior month. New Orleans (13.0%), Hartford, CT (10.8%), Milwaukee (10.7%), and Louisville (10.3%) comprise the remaining markets with the highest rates of distress. Hartford made its debut this month among the Top 5 markets with CRE distress, supplanting the Cleveland MSA. The Sacramento market (0.1%) had the lowest percentage of distress among the Top 50 MSAs for the second consecutive month.
For the full CRED DQ Report, download here:
| MSA – Property Type | DQ/SS (millions) | DS/SS (%) | Monthly Change |
| Allentown-Bethlehem-Easton, PA-NJ MSA | $78.2 | 2.5% | 0.0% |
| Allentown – Hotel | $0.0 | 0.0% | 0.0% |
| Allentown – Industrial | $0.0 | 0.0% | 0.0% |
| Allentown – Multifamily | $0.0 | 0.0% | 0.0% |
| Allentown – Office | $59.0 | 15.7% | -5.5% |
| Allentown – Other | $0.0 | 0.0% | 0.0% |
| Allentown – Retail | $19.2 | 5.0% | -0.3% |
| Allentown – Self Storage | $0.0 | 0.0% | 0.0% |
| Atlanta – Atlanta-Sandy Springs-Marietta, GA MSA | $631.5 | 2.3% | -0.3% |
| Atlanta – Hotel | $158.6 | 8.1% | -0.4% |
| Atlanta – Industrial | $17.9 | 1.2% | -2.1% |
| Atlanta – Multifamily | $0.0 | 0.0% | 0.0% |
| Atlanta – Office | $48.3 | 1.9% | -0.3% |
| Atlanta – Other | $0.2 | 0.0% | 0.0% |
| Atlanta – Retail | $406.5 | 16.8% | 0.9% |
| Atlanta – Self Storage | $0.0 | 0.0% | 0.0% |
| Austin – Austin-Round Rock, TX MSA | $112.2 | 1.2% | -1.0% |
| Austin – Hotel | $57.0 | 7.5% | 0.4% |
| Austin – Industrial | $0.0 | 0.0% | 0.0% |
| Austin – Multifamily | $36.0 | 0.6% | -0.9% |
| Austin – Office | $0.0 | 0.0% | 0.0% |
| Austin – Other | $04.2 | 0.9% | -0.3% |
| Austin – Retail | $15.0 | 1.7% | -4.0% |
| Austin – Self Storage | $0.0 | 0.0% | 0.0% |
| Baltimore – Baltimore-Towson, MD MSA | $403.2 | 4.5% | -0.5% |
| Baltimore – Hotel | $71.7 | 18.1% | 2.0% |
| Baltimore – Industrial | $0.0 | 0.0% | 0.0% |
| Baltimore – Multifamily | $03.9 | 0.1% | -1.1% |
| Baltimore – Office | $58.0 | 8.2% | -0.9% |
| Baltimore – Other | $79.6 | 24.6% | 21.4% |
| Baltimore – Retail | $190.0 | 18.2% | -4.3% |
| Baltimore – Self Storage | $0.0 | 0.0% | 0.0% |
| Birmingham – Birmingham-Hoover, AL MSA | $117.2 | 4.1% | -0.7% |
| Birmingham – Hotel | $0.0 | 0.0% | -11.1% |
| Birmingham – Industrial | $0.0 | 0.0% | 0.0% |
| Birmingham – Multifamily | $0.0 | 0.0% | 0.0% |
| Birmingham – Office | $96.0 | 18.7% | -0.3% |
| Birmingham – Other | $0.0 | 0.0% | 0.0% |
| Birmingham – Retail | $20.3 | 2.9% | -0.2% |
| Birmingham – Self Storage | $0.9 | 3.4% | 0.6% |
| Boston – Boston-Cambridge-Quincy, MA-NH MSA | $118.0 | 0.7% | 0.0% |
| Boston – Hotel | $26.8 | 1.7% | -2.7% |
| Boston – Industrial | $0.0 | 0.0% | 0.0% |
| Boston – Multifamily | $0.0 | 0.0% | 0.0% |
| Boston – Office | $0.0 | 0.0% | 0.0% |
| Boston – Other | $0.0 | 0.0% | 0.0% |
| Boston – Retail | $91.2 | 8.0% | 1.7% |
| Boston – Self Storage | $0.0 | 0.0% | 0.0% |
| Bridgeport – Bridgeport-Stamford-Norwalk, CT MSA | $151.2 | 4.1% | -1.1% |
| Bridgeport – Hotel | $38.1 | 42.0% | -10.9% |
| Bridgeport – Industrial | $0.0 | 0.0% | -15.0% |
| Bridgeport – Multifamily | $0.0 | 0.0% | -0.1% |
| Bridgeport – Office | $103.3 | 9.2% | 0.4% |
| Bridgeport – Other | $09.8 | 2.5% | 0.1% |
| Bridgeport – Retail | $0.0 | 0.0% | -2.0% |
| Bridgeport – Self Storage | $0.0 | 0.0% | 0.0% |
| Charlotte – Charlotte-Gastonia-Concord, NC-SC MSA | $172.1 | 2.2% | -1.5% |
| Charlotte – Hotel | $86.2 | 7.5% | -0.2% |
| Charlotte – Industrial | $0.0 | 0.0% | 0.0% |
| Charlotte – Multifamily | $0.0 | 0.0% | 0.0% |
| Charlotte – Office | $0.0 | 0.0% | -2.3% |
| Charlotte – Other | $85.0 | 30.3% | 5.3% |
| Charlotte – Retail | $0.9 | 0.1% | -8.4% |
| Charlotte – Self Storage | $0.0 | 0.0% | 0.0% |
| Chicago – Chicago-Naperville-Joliet, IL-IN-WI MSA | $1,880.1 | 6.1% | -2.8% |
| Chicago – Hotel | $819.2 | 26.8% | -13.8% |
| Chicago – Industrial | $0.0 | 0.0% | -0.1% |
| Chicago – Multifamily | $11.4 | 0.1% | -1.8% |
| Chicago – Office | $640.2 | 7.5% | -3.9% |
| Chicago – Other | $110.8 | 4.5% | -8.2% |
| Chicago – Retail | $298.4 | 9.8% | -1.6% |
| Chicago – Self Storage | $0.0 | 0.0% | 0.0% |
| Cincinnati – Cincinnati-Middletown, OH-KY-IN MSA | $206.3 | 5.3% | -0.9% |
| Cincinnati – Hotel | $87.7 | 31.3% | -3.8% |
| Cincinnati – Industrial | $0.0 | 0.0% | 0.0% |
| Cincinnati – Multifamily | $0.0 | 0.0% | 0.0% |
| Cincinnati – Office | $0.0 | 0.0% | 0.0% |
| Cincinnati – Other | $06.9 | 2.5% | 0.0% |
| Cincinnati – Retail | $111.8 | 17.3% | -2.6% |
| Cincinnati – Self Storage | $0.0 | 0.0% | 0.0% |
| Cleveland – Cleveland-Elyria-Mentor, OH MSA | $342.1 | 8.6% | -1.0% |
| Cleveland – Hotel | $56.1 | 31.6% | -9.4% |
| Cleveland – Industrial | $0.0 | 0.0% | 0.0% |
| Cleveland – Multifamily | $0.0 | 0.0% | 0.0% |
| Cleveland – Office | $103.7 | 11.6% | -1.7% |
| Cleveland – Other | $175.2 | 46.1% | 3.0% |
| Cleveland – Retail | $06.2 | 0.9% | -2.1% |
| Cleveland – Self Storage | $0.8 | 1.9% | 0.1% |
| Columbus, OH – Columbus, OH MSA | $218.6 | 3.1% | -0.6% |
| Columbus, OH – Hotel | $72.0 | 24.3% | -5.5% |
| Columbus, OH – Industrial | $11.8 | 3.3% | -0.3% |
| Columbus, OH – Multifamily | $12.8 | 0.3% | -0.2% |
| Columbus, OH – Office | $12.3 | 1.9% | -0.2% |
| Columbus, OH – Other | $0.0 | 0.0% | 0.0% |
| Columbus, OH – Retail | $109.8 | 15.6% | 0.1% |
| Columbus, OH – Self Storage | $0.0 | 0.0% | 0.0% |
| Dallas – Dallas-Fort Worth-Arlington, TX MSA | $292.3 | 0.9% | -0.4% |
| Dallas – Hotel | $86.9 | 2.6% | -1.0% |
| Dallas – Industrial | $01.7 | 0.1% | 0.0% |
| Dallas – Multifamily | $0.9 | 0.0% | -0.1% |
| Dallas – Office | $105.2 | 3.1% | 0.2% |
| Dallas – Other | $23.4 | 1.1% | 0.0% |
| Dallas – Retail | $74.2 | 3.4% | -2.3% |
| Dallas – Self Storage | $0.0 | 0.0% | 0.0% |
| Denver – Denver-Aurora, CO MSA | $227.6 | 1.4% | -0.6% |
| Denver – Hotel | $23.0 | 3.1% | 0.0% |
| Denver – Industrial | $0.0 | 0.0% | 0.0% |
| Denver – Multifamily | $0.0 | 0.0% | 0.0% |
| Denver – Office | $120.2 | 5.8% | -3.8% |
| Denver – Other | $66.5 | 6.9% | -0.2% |
| Denver – Retail | $17.9 | 1.3% | -2.1% |
| Denver – Self Storage | $0.0 | 0.0% | 0.0% |
| Detroit – Detroit-Warren-Livonia, MI MSA | $232.5 | 2.5% | -0.7% |
| Detroit – Hotel | $158.3 | 24.3% | 12.4% |
| Detroit – Industrial | $0.0 | 0.0% | -3.5% |
| Detroit – Multifamily | $0.0 | 0.0% | -0.8% |
| Detroit – Office | $0.0 | 0.0% | 0.0% |
| Detroit – Other | $22.0 | 2.7% | -1.0% |
| Detroit – Retail | $52.2 | 3.6% | -5.4% |
| Detroit – Self Storage | $0.0 | 0.0% | 0.0% |
| Hartford – Hartford-West Hartford-East Hartford, CT MSA | $256.9 | 10.8% | 2.6% |
| Hartford – Hotel | $62.2 | 49.8% | -1.9% |
| Hartford – Industrial | $0.0 | 0.0% | 0.0% |
| Hartford – Multifamily | $0.0 | 0.0% | 0.0% |
| Hartford – Office | $35.9 | 11.8% | -16.8% |
| Hartford – Other | $0.0 | 0.0% | 0.0% |
| Hartford – Retail | $158.9 | 47.1% | 34.3% |
| Hartford – Self Storage | $0.0 | 0.0% | 0.0% |
| Houston – Houston-Sugar Land-Baytown, TX MSA | $1,011.3 | 4.2% | -0.7% |
| Houston – Hotel | $478.2 | 43.3% | -6.3% |
| Houston – Industrial | $04.2 | 0.8% | -5.3% |
| Houston – Multifamily | $12.1 | 0.1% | -0.1% |
| Houston – Office | $420.0 | 12.3% | 1.5% |
| Houston – Other | $0.0 | 0.0% | 0.0% |
| Houston – Retail | $96.7 | 2.5% | -0.1% |
| Houston – Self Storage | $0.0 | 0.0% | 0.0% |
| Indianapolis – Indianapolis-Carmel, IN MSA | $180.7 | 3.3% | -1.1% |
| Indianapolis – Hotel | $50.0 | 8.1% | -5.3% |
| Indianapolis – Industrial | $0.0 | 0.0% | 0.0% |
| Indianapolis – Multifamily | $48.8 | 1.7% | 0.5% |
| Indianapolis – Office | $71.4 | 12.0% | -0.3% |
| Indianapolis – Other | $04.9 | 1.7% | -1.1% |
| Indianapolis – Retail | $05.7 | 1.5% | -7.1% |
| Indianapolis – Self Storage | $0.0 | 0.0% | -3.8% |
| Jacksonville – Jacksonville, FL MSA | $22.8 | 0.4% | -0.1% |
| Jacksonville – Hotel | $13.9 | 3.7% | 0.1% |
| Jacksonville – Industrial | $0.0 | 0.0% | 0.0% |
| Jacksonville – Multifamily | $0.0 | 0.0% | 0.0% |
| Jacksonville – Office | $0.0 | 0.0% | -0.9% |
| Jacksonville – Other | $0.0 | 0.0% | 0.0% |
| Jacksonville – Retail | $08.9 | 2.2% | 1.1% |
| Jacksonville – Self Storage | $0.0 | 0.0% | 0.0% |
| Kansas City – Kansas City, MO-KS MSA | $105.5 | 2.0% | -0.8% |
| Kansas City – Hotel | $80.3 | 24.9% | -3.0% |
| Kansas City – Industrial | $0.0 | 0.0% | 0.0% |
| Kansas City – Multifamily | $03.9 | 0.1% | -0.1% |
| Kansas City – Office | $0.0 | 0.0% | 0.0% |
| Kansas City – Other | $0.0 | 0.0% | 0.0% |
| Kansas City – Retail | $21.4 | 3.2% | -4.4% |
| Kansas City – Self Storage | $0.0 | 0.0% | 0.0% |
| Las Vegas – Las Vegas-Paradise, NV MSA | $242.6 | 1.1% | -0.5% |
| Las Vegas – Hotel | $0.0 | 0.0% | 0.0% |
| Las Vegas – Industrial | $0.0 | 0.0% | 0.0% |
| Las Vegas – Multifamily | $0.0 | 0.0% | 0.0% |
| Las Vegas – Office | $0.0 | 0.0% | -3.2% |
| Las Vegas – Other | $0.0 | 0.0% | 0.0% |
| Las Vegas – Retail | $242.6 | 5.3% | -1.0% |
| Las Vegas – Self Storage | $0.0 | 0.0% | 0.0% |
| Los Angeles – Los Angeles-Long Beach-Santa Ana, CA MSA | $774.6 | 1.5% | -0.3% |
| Los Angeles – Hotel | $357.1 | 5.3% | -3.2% |
| Los Angeles – Industrial | $0.0 | 0.0% | -0.2% |
| Los Angeles – Multifamily | $08.2 | 0.0% | -0.2% |
| Los Angeles – Office | $06.8 | 0.1% | 0.0% |
| Los Angeles – Other | $85.7 | 2.6% | -0.8% |
| Los Angeles – Retail | $316.9 | 5.0% | -0.4% |
| Los Angeles – Self Storage | $0.0 | 0.0% | 0.0% |
| Louisville – Louisville/Jefferson County, KY-IN MSA | $299.0 | 10.3% | -7.2% |
| Louisville – Hotel | $0.0 | 0.0% | -56.0% |
| Louisville – Industrial | $0.0 | 0.0% | 0.0% |
| Louisville – Multifamily | $0.0 | 0.0% | -0.3% |
| Louisville – Office | $0.0 | 0.0% | 0.0% |
| Louisville – Other | $0.0 | 0.0% | 0.0% |
| Louisville – Retail | $299.0 | 52.9% | 5.6% |
| Louisville – Self Storage | $0.0 | 0.0% | 0.0% |
| Memphis – Memphis, TN-AR-MS MSA | $86.1 | 3.6% | 0.2% |
| Memphis – Hotel | $24.3 | 12.9% | -1.1% |
| Memphis – Industrial | $0.0 | 0.0% | 0.0% |
| Memphis – Multifamily | $0.0 | 0.0% | 0.0% |
| Memphis – Office | $0.0 | 0.0% | 0.0% |
| Memphis – Other | $0.2 | 0.5% | -28.9% |
| Memphis – Retail | $61.6 | 16.3% | 4.7% |
| Memphis – Self Storage | $0.0 | 0.0% | 0.0% |
| Miami – Miami-Fort Lauderdale-Pompano Beach, FL MSA | $298.7 | 1.2% | -1.6% |
| Miami – Hotel | $93.7 | 2.2% | 0.1% |
| Miami – Industrial | $0.0 | 0.0% | 0.0% |
| Miami – Multifamily | $0.0 | 0.0% | -2.0% |
| Miami – Office | $04.0 | 0.2% | -0.2% |
| Miami – Other | $08.6 | 0.6% | 0.0% |
| Miami – Retail | $192.4 | 3.8% | -3.1% |
| Miami – Self Storage | $0.0 | 0.0% | 0.0% |
| Milwaukee – Milwaukee-Waukesha-West Allis, WI MSA | $263.9 | 10.7% | -0.3% |
| Milwaukee – Hotel | $18.3 | 12.2% | -11.5% |
| Milwaukee – Industrial | $0.0 | 0.0% | 0.0% |
| Milwaukee – Multifamily | $0.0 | 0.0% | 0.0% |
| Milwaukee – Office | $94.5 | 17.6% | 0.6% |
| Milwaukee – Other | $0.6 | 0.4% | 0.4% |
| Milwaukee – Retail | $150.6 | 30.4% | 1.3% |
| Milwaukee – Self Storage | $0.0 | 0.0% | 0.0% |
| Minneapolis – Minneapolis-St. Paul-Bloomington, MN-WI MSA | $1,840.5 | 22.1% | -0.1% |
| Minneapolis – Hotel | $285.6 | 44.2% | -4.1% |
| Minneapolis – Industrial | $0.0 | 0.0% | 0.0% |
| Minneapolis – Multifamily | $0.0 | 0.0% | 0.0% |
| Minneapolis – Office | $142.5 | 7.3% | 0.4% |
| Minneapolis – Other | $04.2 | 0.8% | -2.0% |
| Minneapolis – Retail | $1,408.2 | 75.1% | 1.3% |
| Minneapolis – Self Storage | $0.0 | 0.0% | 0.0% |
| Nashville – Nashville-Davidson-Murfreesboro-Franklin, TN MSA | $69.1 | 1.1% | -1.1% |
| Nashville – Hotel | $59.4 | 4.3% | -5.7% |
| Nashville – Industrial | $0.0 | 0.0% | 0.0% |
| Nashville – Multifamily | $0.0 | 0.0% | 0.0% |
| Nashville – Office | $0.0 | 0.0% | 0.0% |
| Nashville – Other | $0.2 | 0.5% | 0.5% |
| Nashville – Retail | $09.4 | 1.3% | 0.8% |
| Nashville – Self Storage | $0.0 | 0.0% | 0.0% |
| New Orleans – New Orleans-Metairie-Kenner, LA MSA | $455.1 | 13.0% | -0.3% |
| New Orleans – Hotel | $407.1 | 37.0% | 0.0% |
| New Orleans – Industrial | $0.0 | 0.0% | 0.0% |
| New Orleans – Multifamily | $08.4 | 1.0% | -0.5% |
| New Orleans – Office | $17.2 | 3.0% | -2.0% |
| New Orleans – Other | $0.0 | 0.0% | -7.7% |
| New Orleans – Retail | $22.4 | 3.3% | 0.3% |
| New Orleans – Self Storage | $0.0 | 0.0% | 0.0% |
| New York City – New York-Northern New Jersey-Long Island, NY-NJ-PA MSA | $5,707.7 | 4.3% | -0.5% |
| New York City – Hotel | $1,266.0 | 33.7% | -4.2% |
| New York City – Industrial | $07.4 | 0.2% | -3.0% |
| New York City – Multifamily | $314.1 | 0.8% | -0.4% |
| New York City – Office | $1,411.5 | 3.0% | -0.4% |
| New York City – Other | $1,557.4 | 6.3% | 0.9% |
| New York City – Retail | $1,151.3 | 8.7% | -0.9% |
| New York City – Self Storage | $0.0 | 0.0% | 0.0% |
| Orlando – Orlando-Kissimmee, FL MSA | $173.1 | 1.6% | -0.3% |
| Orlando – Hotel | $86.1 | 2.9% | -0.8% |
| Orlando – Industrial | $0.0 | 0.0% | 0.0% |
| Orlando – Multifamily | $0.0 | 0.0% | 0.0% |
| Orlando – Office | $47.0 | 10.8% | 0.7% |
| Orlando – Other | $0.0 | 0.0% | 0.0% |
| Orlando – Retail | $39.9 | 3.9% | -1.0% |
| Orlando – Self Storage | $0.0 | 0.0% | 0.0% |
| Philadelphia – Philadelphia-Camden-Wilmington, PA-NJ-DE-MD MSA | $278.5 | 1.4% | -1.5% |
| Philadelphia – Hotel | $87.6 | 10.5% | -0.1% |
| Philadelphia – Industrial | $0.0 | 0.0% | 0.0% |
| Philadelphia – Multifamily | $34.1 | 0.4% | -0.7% |
| Philadelphia – Office | $116.5 | 2.9% | -0.5% |
| Philadelphia – Other | $20.5 | 1.4% | -2.2% |
| Philadelphia – Retail | $19.7 | 0.9% | -7.7% |
| Philadelphia – Self Storage | $0.0 | 0.0% | 0.0% |
| Phoenix – Phoenix-Mesa-Scottsdale, AZ MSA | $229.9 | 1.2% | 0.1% |
| Phoenix – Hotel | $32.5 | 2.0% | 1.0% |
| Phoenix – Industrial | $10.1 | 0.8% | -1.3% |
| Phoenix – Multifamily | $0.0 | 0.0% | 0.0% |
| Phoenix – Office | $41.2 | 1.8% | 0.8% |
| Phoenix – Other | $0.0 | 0.0% | 0.0% |
| Phoenix – Retail | $146.2 | 7.8% | 1.5% |
| Phoenix – Self Storage | $0.0 | 0.0% | 0.0% |
| Pittsburgh – Pittsburgh, PA MSA | $47.9 | 1.0% | -0.2% |
| Pittsburgh – Hotel | $15.9 | 9.9% | -2.1% |
| Pittsburgh – Industrial | $0.0 | 0.0% | 0.0% |
| Pittsburgh – Multifamily | $0.0 | 0.0% | 0.0% |
| Pittsburgh – Office | $24.0 | 2.2% | 0.7% |
| Pittsburgh – Other | $08.0 | 1.9% | -0.3% |
| Pittsburgh – Retail | $0.0 | 0.0% | -1.1% |
| Pittsburgh – Self Storage | $0.0 | 0.0% | 0.0% |
| Portland – Portland-Vancouver-Beaverton, OR-WA MSA | $447.0 | 6.4% | -0.8% |
| Portland – Hotel | $416.1 | 48.6% | -6.0% |
| Portland – Industrial | $0.0 | 0.0% | 0.0% |
| Portland – Multifamily | $10.2 | 0.2% | -0.1% |
| Portland – Office | $20.7 | 4.9% | -0.9% |
| Portland – Other | $0.0 | 0.0% | 0.0% |
| Portland – Retail | $0.0 | 0.0% | 0.0% |
| Portland – Self Storage | $0.0 | 0.0% | 0.0% |
| Raleigh – Raleigh-Cary, NC MSA | $24.7 | 0.6% | 0.1% |
| Raleigh – Hotel | $24.7 | 9.3% | 6.1% |
| Raleigh – Industrial | $0.0 | 0.0% | 0.0% |
| Raleigh – Multifamily | $0.0 | 0.0% | -0.4% |
| Raleigh – Office | $0.0 | 0.0% | 0.0% |
| Raleigh – Other | $0.0 | 0.0% | 0.0% |
| Raleigh – Retail | $0.0 | 0.0% | 0.0% |
| Raleigh – Self Storage | $0.0 | 0.0% | 0.0% |
| Richmond – Richmond, VA MSA | $54.9 | 1.6% | -0.8% |
| Richmond – Hotel | $0.0 | 0.0% | 0.0% |
| Richmond – Industrial | $0.0 | 0.0% | 0.0% |
| Richmond – Multifamily | $0.0 | 0.0% | 0.0% |
| Richmond – Office | $0.0 | 0.0% | 0.0% |
| Richmond – Other | $0.0 | 0.0% | 0.0% |
| Richmond – Retail | $54.9 | 11.2% | -3.7% |
| Richmond – Self Storage | $0.0 | 0.0% | 0.0% |
| Riverside – Riverside-San Bernardino-Ontario, CA MSA | $292.8 | 2.9% | -0.2% |
| Riverside – Hotel | $62.7 | 14.8% | -8.3% |
| Riverside – Industrial | $0.0 | 0.0% | 0.0% |
| Riverside – Multifamily | $0.0 | 0.0% | -0.2% |
| Riverside – Office | $0.0 | 0.0% | 0.0% |
| Riverside – Other | $0.0 | 0.0% | 0.0% |
| Riverside – Retail | $230.1 | 11.2% | 1.5% |
| Riverside – Self Storage | $0.0 | 0.0% | 0.0% |
| Sacramento – Sacramento-Arden-Arcade-Roseville, CA MSA | $05.7 | 0.1% | -0.3% |
| Sacramento – Hotel | $05.7 | 1.7% | 0.1% |
| Sacramento – Industrial | $0.0 | 0.0% | 0.0% |
| Sacramento – Multifamily | $0.0 | 0.0% | 0.0% |
| Sacramento – Office | $0.0 | 0.0% | -0.8% |
| Sacramento – Other | $0.0 | 0.0% | 0.0% |
| Sacramento – Retail | $0.0 | 0.0% | -1.7% |
| Sacramento – Self Storage | $0.0 | 0.0% | 0.0% |
| Salt Lake City – Salt Lake City, UT MSA | $28.0 | 0.7% | -0.6% |
| Salt Lake City – Hotel | $28.0 | 10.1% | -6.5% |
| Salt Lake City – Industrial | $0.0 | 0.0% | 0.0% |
| Salt Lake City – Multifamily | $0.0 | 0.0% | 0.0% |
| Salt Lake City – Office | $0.0 | 0.0% | 0.0% |
| Salt Lake City – Other | $0.0 | 0.0% | 0.0% |
| Salt Lake City – Retail | $0.0 | 0.0% | 0.0% |
| Salt Lake City – Self Storage | $0.0 | 0.0% | 0.0% |
| San Antonio – San Antonio, TX MSA | $124.9 | 2.0% | -0.2% |
| San Antonio – Hotel | $07.2 | 2.9% | -0.2% |
| San Antonio – Industrial | $0.0 | 0.0% | -0.8% |
| San Antonio – Multifamily | $0.0 | 0.0% | -0.2% |
| San Antonio – Office | $0.0 | 0.0% | 0.0% |
| San Antonio – Other | $0.0 | 0.0% | 0.0% |
| San Antonio – Retail | $117.7 | 19.2% | 5.3% |
| San Antonio – Self Storage | $0.0 | 0.0% | 0.0% |
| San Diego – San Diego-Carlsbad-San Marcos, CA MSA | $91.7 | 0.7% | 0.0% |
| San Diego – Hotel | $61.7 | 3.1% | 0.0% |
| San Diego – Industrial | $0.0 | 0.0% | 0.0% |
| San Diego – Multifamily | $09.5 | 0.2% | 0.1% |
| San Diego – Office | $0.0 | 0.0% | 0.0% |
| San Diego – Other | $20.5 | 2.9% | 0.0% |
| San Diego – Retail | $0.0 | 0.0% | -0.4% |
| San Diego – Self Storage | $0.0 | 0.0% | 0.0% |
| San Francisco – San Francisco-Oakland-Fremont, CA MSA | $201.2 | 0.8% | 0.1% |
| San Francisco – Hotel | $115.0 | 5.3% | 2.5% |
| San Francisco – Industrial | $0.0 | 0.0% | 0.0% |
| San Francisco – Multifamily | $0.0 | 0.0% | -0.3% |
| San Francisco – Office | $0.0 | 0.0% | 0.0% |
| San Francisco – Other | $38.6 | 1.5% | -0.7% |
| San Francisco – Retail | $47.6 | 3.9% | -0.2% |
| San Francisco – Self Storage | $0.0 | 0.0% | 0.0% |
| San Jose – San Jose-Sunnyvale-Santa Clara, CA MSA | $120.8 | 0.6% | -0.3% |
| San Jose – Hotel | $120.8 | 1.9% | -3.9% |
| San Jose – Industrial | $0.0 | 0.0% | 0.0% |
| San Jose – Multifamily | $0.0 | 0.0% | 0.0% |
| San Jose – Office | $0.0 | 0.0% | -0.2% |
| San Jose – Other | $0.0 | 0.0% | 0.0% |
| San Jose – Retail | $0.0 | 0.0% | 0.0% |
| San Jose – Self Storage | $0.0 | 0.0% | 0.0% |
| Seattle – Seattle-Tacoma-Bellevue, WA MSA | $108.6 | 0.5% | 0.1% |
| Seattle – Hotel | $108.6 | 8.2% | 2.3% |
| Seattle – Industrial | $0.0 | 0.0% | 0.0% |
| Seattle – Multifamily | $0.0 | 0.0% | -0.1% |
| Seattle – Office | $0.0 | 0.0% | 0.0% |
| Seattle – Other | $0.0 | 0.0% | 0.0% |
| Seattle – Retail | $0.0 | 0.0% | 0.0% |
| Seattle – Self Storage | $0.0 | 0.0% | 0.0% |
| St. Louis – St. Louis, MO-IL MSA | $263.7 | 6.4% | -2.6% |
| St. Louis – Hotel | $42.2 | 15.2% | -0.4% |
| St. Louis – Industrial | $0.0 | 0.0% | 0.0% |
| St. Louis – Multifamily | $04.5 | 0.3% | -0.2% |
| St. Louis – Office | $0.0 | 0.0% | -20.2% |
| St. Louis – Other | $23.0 | 4.3% | 0.1% |
| St. Louis – Retail | $194.1 | 21.3% | 1.5% |
| St. Louis – Self Storage | $0.0 | 0.0% | 0.0% |
| Tampa – Tampa-St. Petersburg-Clearwater, FL | $226.2 | 2.4% | -1.0% |
| Tampa – Hotel | $29.8 | 4.4% | 0.0% |
| Tampa – Industrial | $0.0 | 0.0% | 0.0% |
| Tampa – Multifamily | $0.0 | 0.0% | 0.0% |
| Tampa – Office | $23.7 | 3.6% | -0.3% |
| Tampa – Other | $0.0 | 0.0% | 0.0% |
| Tampa – Retail | $172.8 | 23.2% | -4.0% |
| Tampa – Self Storage | $0.0 | 0.0% | 0.0% |
| Tucson – Tucson, AZ MSA | $165.5 | 5.1% | -0.2% |
| Tucson – Hotel | $04.7 | 1.4% | -0.2% |
| Tucson – Industrial | $0.0 | 0.0% | 0.0% |
| Tucson – Multifamily | $0.0 | 0.0% | 0.0% |
| Tucson – Office | $0.0 | 0.0% | 0.0% |
| Tucson – Other | $0.0 | 0.0% | 0.0% |
| Tucson – Retail | $160.9 | 19.3% | -0.8% |
| Tucson – Self Storage | $0.0 | 0.0% | 0.0% |
| Virginia Beach – Virginia Beach-Norfolk-Newport News, VA-NC MSA | $126.8 | 2.7% | -2.2% |
| Virginia Beach – Hotel | $0.0 | 0.0% | 0.0% |
| Virginia Beach – Industrial | $21.2 | 6.9% | 0.0% |
| Virginia Beach – Multifamily | $0.0 | 0.0% | 0.0% |
| Virginia Beach – Office | $0.0 | 0.0% | -0.7% |
| Virginia Beach – Other | $0.0 | 0.0% | 0.0% |
| Virginia Beach – Retail | $105.6 | 12.3% | -10.8% |
| Virginia Beach – Self Storage | $0.0 | 0.0% | 0.0% |
| Washington, DC – Washington-Arlington-Alexandria, DC-VA-MD-WV MSA | $518.3 | 1.7% | -0.2% |
| Washington, DC – Hotel | $49.2 | 5.1% | 3.5% |
| Washington, DC – Industrial | $11.1 | 1.6% | -0.4% |
| Washington, DC – Multifamily | $0.0 | 0.0% | 0.0% |
| Washington, DC – Office | $302.6 | 4.0% | -0.8% |
| Washington, DC – Other | $44.7 | 2.8% | 0.1% |
| Washington, DC – Retail | $110.7 | 3.2% | -1.6% |
| Washington, DC – Self Storage | $0.0 | 0.0% | 0.0% |
| Grand Total | $20,328.0 | 2.9% | -0.7% |
About CRED iQ
CRED iQ is a commercial real estate data, analytics, and valuation platform providing actionable intelligence to CRE and capital markets investors. Subscribers to CRED iQ use the platform to identify valuable leads for leasing, lending, refinancing, distressed debt, and acquisition opportunities. Our data platform is powered by over $2.0 trillion of CMBS, CRE CLO, SBLL, Ginnie Mae, FHA/HUD, and Freddie Mac loan and property data.


