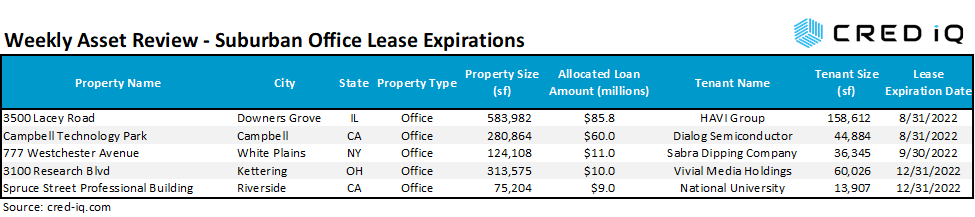
This week, CRED iQ calculated updated valuations for five suburban office properties that have major tenants with lease expirations in the next six months. Featured leases include suburban office space in the Chicago, San Jose, and New York City MSAs. Lease expirations are opportunities for tenant reps to source prospects and find solutions for clients. Additionally, lease expirations can serve as a preemptive signal of distress for commercial real estate loans if prospective leasing the newly vacant space is low.
CRED iQ valuations factor in a base-case (most likely), a downside (significant loss of tenants), and dark scenarios (100% vacant). For access to the valuation reports as well as full CMBS loan reporting, including detailed financials, updated tenant information, and borrower contact information, sign up for a free trial here.
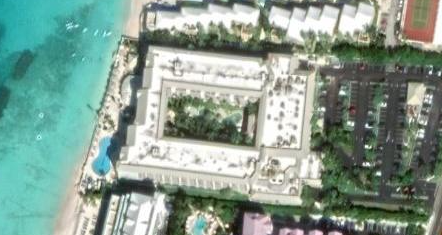
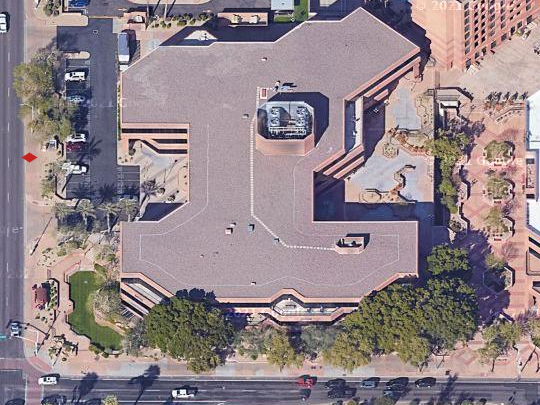
3500 Lacey Road
583,982 sf, Suburban Office, Downers Grove, IL [View Details]
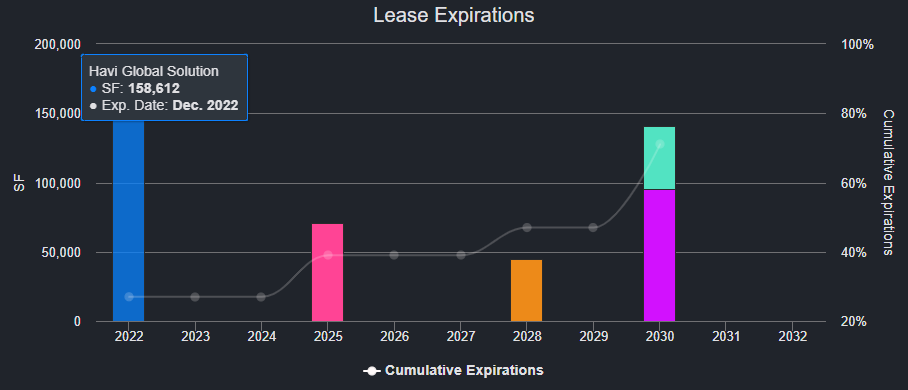
HAVI Group has a 158,612-sf lease that is scheduled to expire on August 31, 2022 at 3500 Lacey Road, a 583,982-sf office building located in Downers Grove, IL. HAVI’s lease was originally set to expire in April 2025, but the tenant terminated its lease effective for the end of August 2022. The lease termination was related to HAVI Group’s affiliation as a vendor for McDonald’s, which moved its headquarters to the Fulton Market submarket of Chicago in 2018. HAVI Group will follow McDonald’s into Fulton Market with a new 100,000-sf lease at a nearby property.
HAVI Group leases approximately 27% of the NRA at 3500 Lacey Road, also known as Esplanade II. The office building secures an $85.8 million loan that has a maturity date in December 2029. With the departure of HAVI Group, occupancy is expected to decline to 62% from 89%. However, HAVI Group had been subletting two portions of its space. Hearthside Food Solutions had been subleasing 17,696 sf and appears to still be operational at the building. Donnelly Financial Solutions had been subleasing 22,132 sf from HAVI Group but no longer appears to have a presence at the building. As such, CRED iQ’s base-case occupancy assumption is approximately 65%, assuming that the sublease with Hearthside Food Solutions converts into a direct lease. For the valuation report and loan-level details, click here.
| Property Name | 3500 Lacey Road |
| Address | 3500 Lacey Road Downers Grove, IL 60515 |
| Loan Balance | $85,800,000 |
| Interest Rate | 4.35% |
| Maturity Date | 12/1/2029 |
| Most Recent Appraisal | $129,000,000 ($221/sf) |
| Most Recent Appraisal Date | 9/3/2019 |
| CRED iQ Base-Base Value | Requires Log In |
Campbell Technology Park
280,864-sf, Suburban Office, Campbell, CA [View Details]
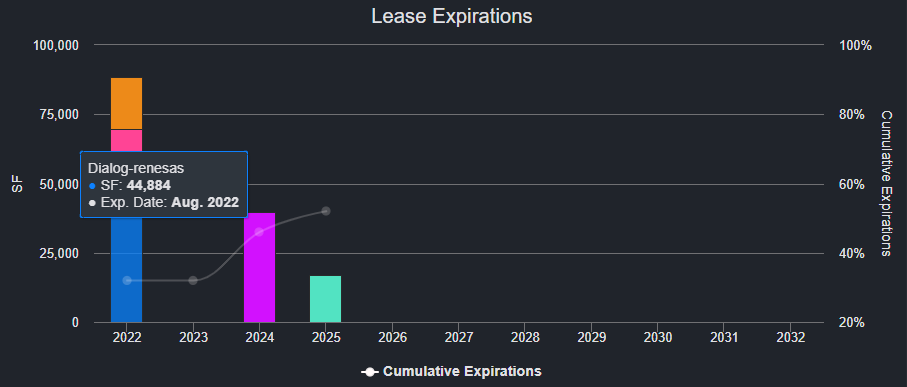
Dialog Semiconductor has a 44,884-sf lease that is scheduled to expire on August 31, 2022 at Campbell Technology Park, a 280,864-sf office park located in Campbell, CA. Dialog Semiconductor is the property’s largest tenant, accounting for 16% of the NRA. The tenant was acquired by Renesas Electronics Corporation and appears to be vacating at lease expiration to consolidate operations. CRED iQ anticipates that the departure will leave the property 49% occupied.
The four-building office park secures a $60 million loan that matures in June 2025. Inclusive of Dialog Semiconductor, there was a total of 32% of the property’s NRA that was slated to expire in 2022. Occupancy at the property was approximately 76% in 2019 and 2020 and declined to 65% in 2021. The declines are troubling indicator of the property’s inability to attract replacement tenants. For the valuation report and loan-level details, click here.
| Property Name | Campbell Technology Park |
| Address | 635 – 695 Campbell Technology Parkway Campbell, CA 95008 |
| Loan Balance | $60,000,000 |
| Interest Rate | 4.41% |
| Maturity Date | 6/11/2025 |
| Most Recent Appraisal | $100,000,000 ($356/sf) |
| Most Recent Appraisal Date | 4/21/2015 |
| CRED iQ Base-Base Value | Requires Log In |
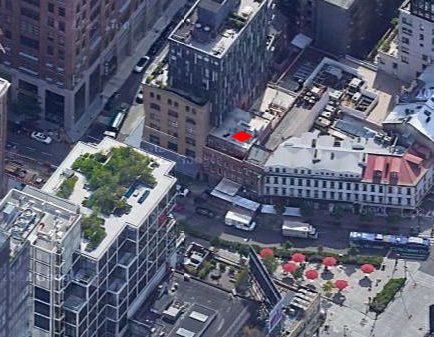
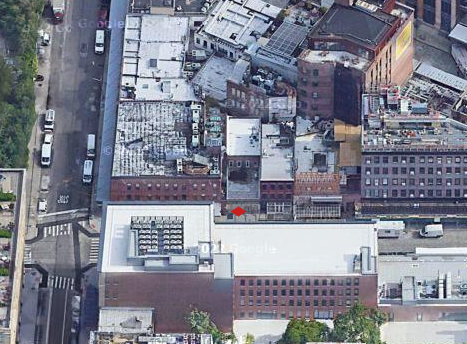
777 Westchester Avenue
124,108 sf, Office, White Plains, NY [View Details]
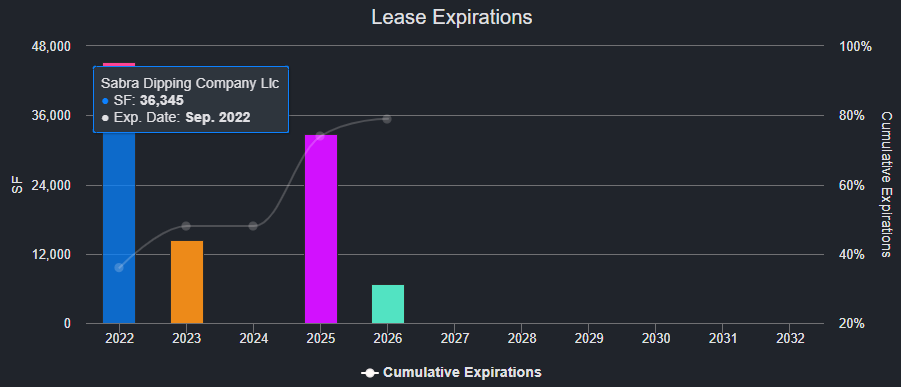
Sabra Dipping Company has a 36,345-sf lease that is scheduled to expire on September 30, 2022 at 777 Westchester Avenue, a 124,108-sf office building in White Plains, NY. The tenant will not renew after signing a 6,655-sf lease at the Gateway Building, which is more centrally located to the White Plains central business district than 777 Westchester Avenue. Sabra accounts for approximately 29% of the NRA at 777 Westchester Avenue. After the tenant’s relocation and downsize, occupancy at the property declined to approximately 67%.
The property at 777 Westchester Avenue is part of a five-building portfolio of adjacent office buildings that secure a $53.4 million mortgage. Prior to Sabra’s decision to vacate, the property had the highest occupancy of all five buildings. The portfolio totals over 671,000 sf with a weighted average occupancy of 65%. With nearly 235,000 sf of vacant space across the five-building office park, leasing activity may prove to be challenging not only for 777 Westchester but for the entire portfolio. For the valuation report and loan-level details, click here.
| Property Name | 777 Westchester |
| Address | 777 Westchester Avenue White Plains, NY 10604 |
| Allocated Loan Amount | $11,041,881 |
| Interest Rate | 4.46% |
| Maturity Date | 11/6/2026 |
| Most Recent Appraisal | $19,000,000 ($153/sf) |
| Most Recent Appraisal Date | 9/8/2016 |
| CRED iQ Base-Base Value | Requires Log In |
3100 Research Blvd
313,575 sf, Suburban Office, Kettering, OH [View Details]
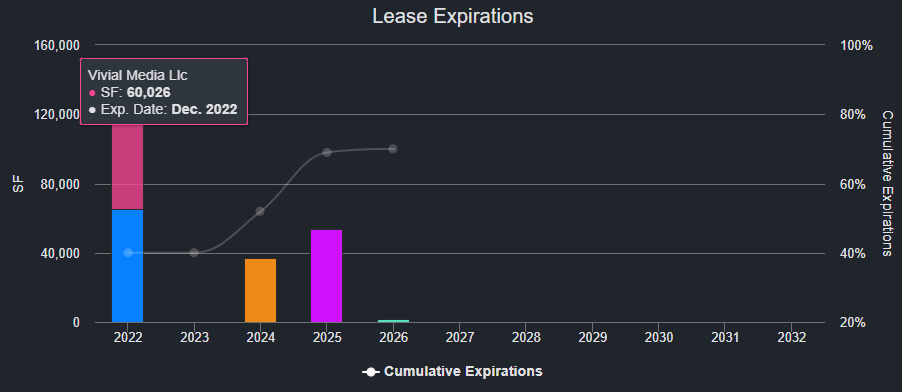
Vivial Media Holdings has a 60,026-sf lease that expires on December 31, 2022 at 3100 Research Boulevard, a 313,575-sf office building located in suburban Dayton, OH. Vivial Media was acquired by Thryv Inc. in January 2022. As part of the acquisition, CRED iQ expects Thryv to consolidate operations, with consideration for the firm’s established presence in the Dayton market with other subsidiaries.
Vivial Media’s lease accounts for 19% of the property’s GLA. Accounting for the tenant’s departure, occupancy at the property would decline to 51% from 70%. Additionally, the General Services Administration (GSA) leases 65,471 sf space, equal to 21% of NRA, on behalf of Defense Acquisition University through a lease that expires on November 30, 2022. The GSA is the property’s largest tenant and a renewal is needed to avoid further distress. The property secures a $10 million loan that matures in December 2030. For the valuation report and loan-level details, click here.
| Property Name | 3100 Research Blvd |
| Address | 3100 Research Blvd Kettering, OH 45420 |
| Loan Balance | $10,000,000 |
| Interest Rate | 3.60% |
| Maturity Date | 12/1/1930 |
| Most Recent Appraisal | $15,500,000 ($49/sf) |
| Most Recent Appraisal Date | 8/2/2020 |
| CRED iQ Base-Base Value | Requires Log In |
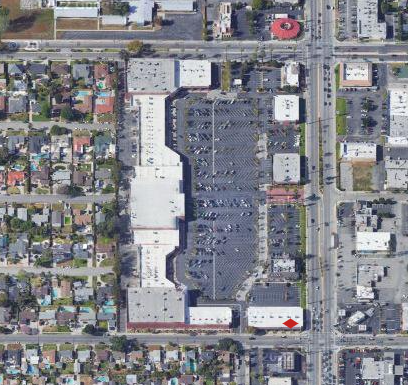
Spruce Street Professional Building
75,204 sf, Suburban Office, Riverside, CA [View Details]
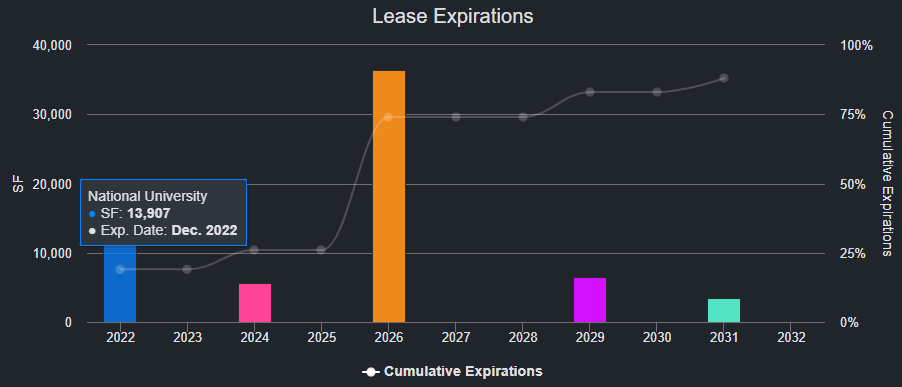
National University has a 13,907-sf lease that is scheduled to expire on December 31, 2022 at the Spruce Street Professional Building, a 75,204-sf office building in Riverside, CA. According to the Department of Education, National University closed its location at the property in March 2020. The vacant space will need to be re-tenanted.
The Spruce Street Professional building secures a $9 million loan that matures in May 2027. The property was 90% occupied as of year-end 2021 but National University’s lease expiration will lower occupancy to 71.5%. For the valuation report and loan-level details, click here.
| Property Name | Spruce Street Professional Building |
| Address | 1325 Spruce Street Riverside, CA 92507 |
| Loan Balance | $9,037,958 |
| Interest Rate | 4.80% |
| Maturity Date | 5/6/2027 |
| Most Recent Appraisal | $12,100,000 ($161/sf) |
| Most Recent Appraisal Date | 3/23/2017 |
| CRED iQ Base-Base Value | Requires Log In |
For full access to our loan database and valuation platform, sign up for a free trial below:
About CRED iQ
CRED iQ is a commercial real estate data, analytics, and valuation platform providing actionable intelligence to CRE and capital markets investors. Subscribers to CRED iQ use the platform to identify valuable leads for leasing, lending, refinancing, distressed debt, and acquisition opportunities. Our data platform is powered by over $2.0 trillion of CMBS, CRE CLO, SBLL, and GSE Agency loan and property data.