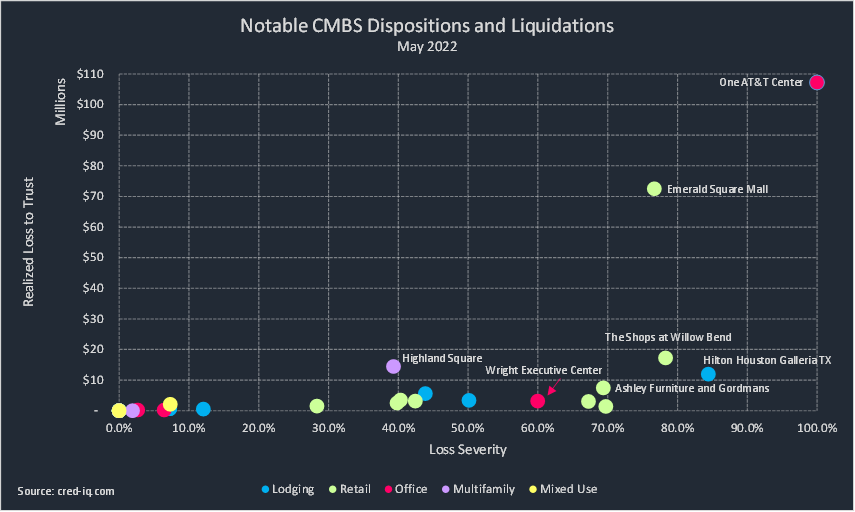
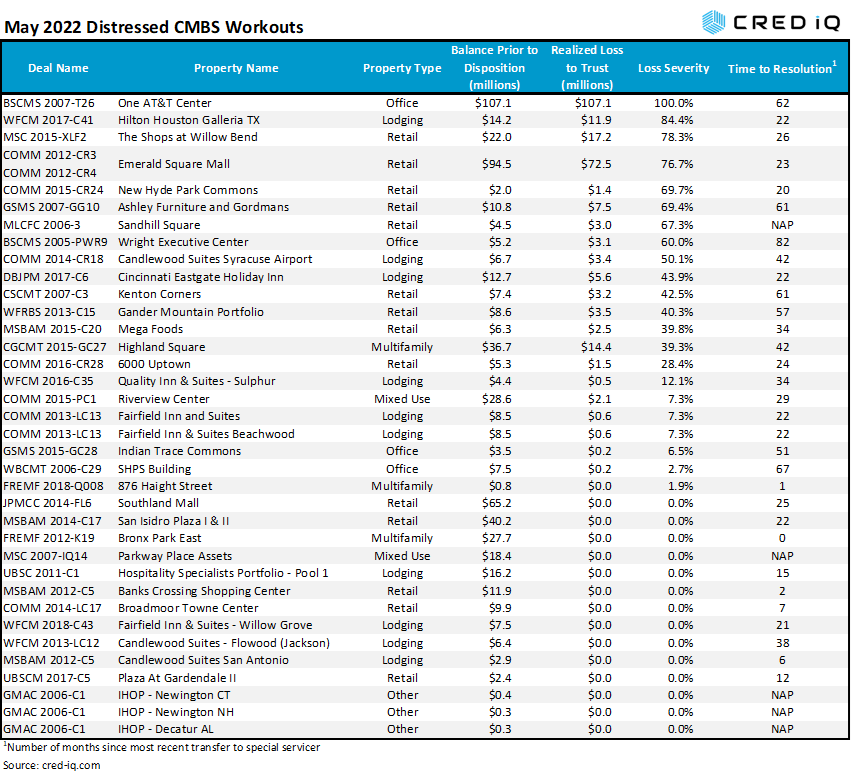
CMBS conduit and SBLL transactions incurred approximately $263 million in realized losses during May 2022 through the workout of distressed assets. CRED iQ identified 34 workouts classified as dispositions, liquidation, or discounted payoffs in May 2022. Additionally, there were two distressed loans securitized in Freddie K transactions that were in need of a workout, but only one of those loans incurred a nominal loss. Of those 36 total workouts, there were 14 distressed assets that were resolved without a loss. Loss severities for the month of April ranged from 2% to 100%, based on outstanding balances at disposition. Total realized losses in May represented more than a threefold increase compared to April’s realized loss totals of approximately $75 million.
Retail properties represented the highest number of distressed workouts this month with 14. There were 10 distressed workouts involving lodging properties. Together, these two property types account for 67% of the total number of distresses CMBS workouts.
One AT&T Center represents the largest loss, by total amount and severity, among all distressed workouts this month. The property was foreclosed on in 2017 after its sole tenant, AT&T, vacated at lease expiration. The 1.2 million-sf office tower sold for $4.1 million, equal to $3/sf, in May 2022 after spending approximately five years in special servicing. The REO asset was liquidated with a 100% loss severity on $107.1 million in outstanding debt prior to disposition.
Another notable distressed workout was the disposition of the $94.5 million Emerald Square Mall loan, which is secured by a 564,501-sf portion of a super-regional mall in North Attleboro, MA. The mall was formerly controlled by Simon Property Group but went into receivership shortly after the loan transferred to special servicing in September 2020. After a nearly two-year workout, the loan was resolved with a 77% loss severity, resulting in $72.5 million in principal losses to CMBS certificate holders. Emerald Square Mall represented the second-highest individual realized loss by total amount and the fourth highest by loss severity.
Excluding defeased loans, there was approximately $5.2 billion in securitized debt that was paid off or worked out in May, which was lower than $6.1 billion in April 2022. In May, 11% of the loan resolutions were categorized as dispositions, liquidations, or discounted payoffs, which was slightly higher than the prior month. An additional 15% of the loans paid off with prepayment penalties.
By property type, office had the highest total of outstanding debt paid off in May. The high volume of office payoffs was driven by the retirement of a $1.3 billion mortgage secured by Blackstone’s 27-property BioMed Realty portfolio. Lodging and multifamily loans also had a high volume of payoffs and dispositions.
About CRED iQ
CRED iQ is a commercial real estate data, analytics, and valuation platform designed to unlock investment, financing, and leasing opportunities. CRED iQ provides real-time property, loan, tenant, ownership, and valuation data for over $2.0 trillion of commercial real estate.
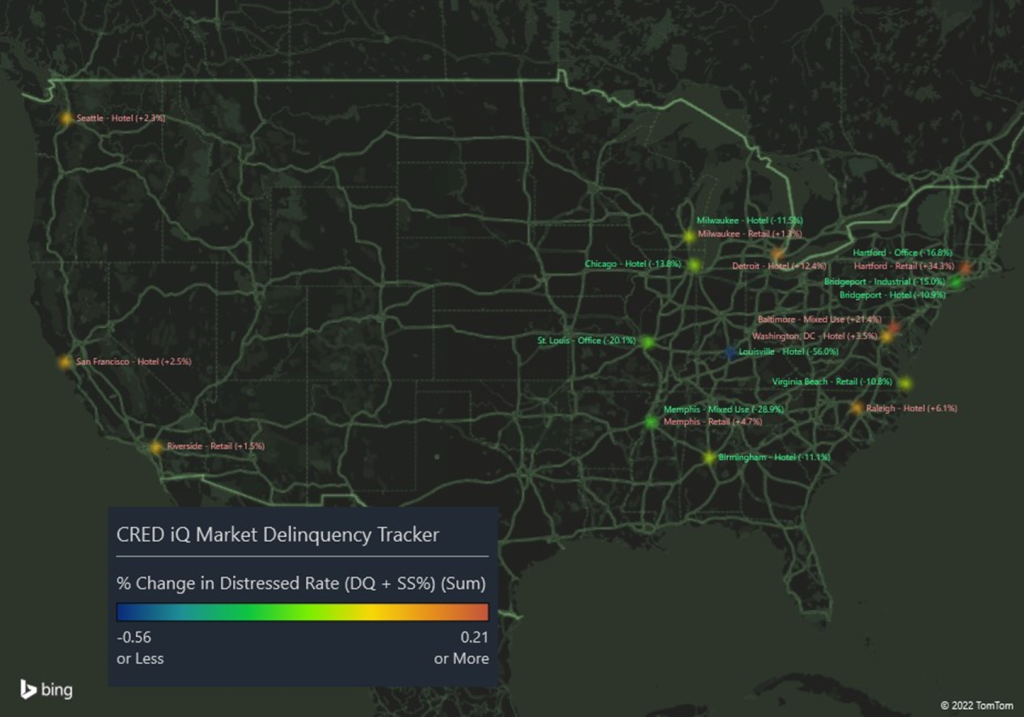
CRED iQ monitors distressed rates and market performance for nearly 400 MSAs across the United States, covering over $900 billion in outstanding commercial real estate (CRE) debt. Distressed rates (DQ + SS%) include loans that are specially serviced, delinquent, or a combination of both. Distressed rates and month-over-month changes are presented below for the 50 largest MSAs, broken out by property type for a granular view of distress by market-sector.
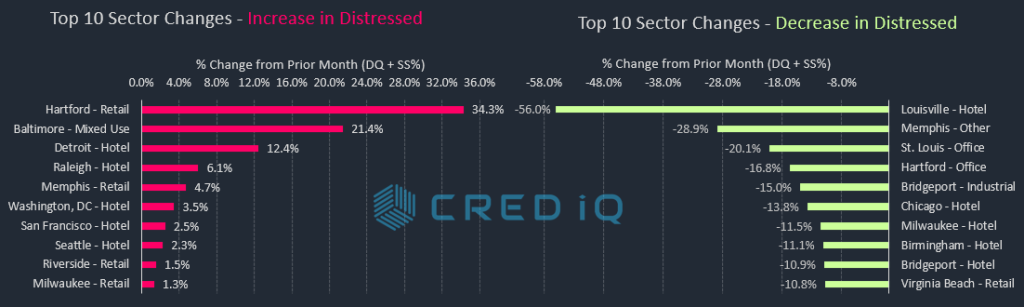
On high level, only seven of the Top 50 MSAs tracked by CRED iQ exhibited an overall month-over-month increase in distress in May 2022, without regard to property type sector. There were 43 markets, or 86% of the Top 50, with overall improvements in the percentage of distressed CRE loans within the CMBS universe compared to the prior month. Among the MSAs with the sharpest declines this month were Louisville and Chicago.
Looking at a more granular level by property type, the lodging sector continues to lead the way as the most common property sector to show improvements, in concert with prior months. Loans secured by lodging properties accounted for six of the 10 largest declines in distress by market-sector, including Chicago, Milwaukee, and Bridgeport, CT.
The most common property types among increases in distress by market-sector were hotel and retail. The Baltimore mixed-use market experienced one of the highest month-over-month increase in distress. A $67.9 million mortgage secured by the Gallery at Harborplace failed to pay off at maturity on May 1, 2022, which contributed to the near entirety of the increase in distress for the market. Gallery at Harborplace is a 406,594-sf mixed-use property comprising retail and office space. The Detroit hotel market was also among the Top 10 market-sectors to show a higher month-over-month rate of distress. A major contributor to Detroit’s lodging distress is a $77 million loan secured by the 453-key Westin Book Cadillac hotel. The loan was modified in December 2021 after transferring to special servicing in August 2020. The loan returned to the master servicer in March 2022 and was current as of April but became 30 days delinquent as of May 2022.
The Minneapolis MSA has the highest overall distressed rate at 22.1%, which was a slight decline compared to the prior month. New Orleans (13.0%), Hartford, CT (10.8%), Milwaukee (10.7%), and Louisville (10.3%) comprise the remaining markets with the highest rates of distress. Hartford made its debut this month among the Top 5 markets with CRE distress, supplanting the Cleveland MSA. The Sacramento market (0.1%) had the lowest percentage of distress among the Top 50 MSAs for the second consecutive month.
Riverside – Riverside-San Bernardino-Ontario, CA MSA
$292.8
2.9%
-0.2%
Riverside – Hotel
$62.7
14.8%
-8.3%
Riverside – Industrial
$0.0
0.0%
0.0%
Riverside – Multifamily
$0.0
0.0%
-0.2%
Riverside – Office
$0.0
0.0%
0.0%
Riverside – Other
$0.0
0.0%
0.0%
Riverside – Retail
$230.1
11.2%
1.5%
Riverside – Self Storage
$0.0
0.0%
0.0%
Sacramento – Sacramento-Arden-Arcade-Roseville, CA MSA
$05.7
0.1%
-0.3%
Sacramento – Hotel
$05.7
1.7%
0.1%
Sacramento – Industrial
$0.0
0.0%
0.0%
Sacramento – Multifamily
$0.0
0.0%
0.0%
Sacramento – Office
$0.0
0.0%
-0.8%
Sacramento – Other
$0.0
0.0%
0.0%
Sacramento – Retail
$0.0
0.0%
-1.7%
Sacramento – Self Storage
$0.0
0.0%
0.0%
Salt Lake City – Salt Lake City, UT MSA
$28.0
0.7%
-0.6%
Salt Lake City – Hotel
$28.0
10.1%
-6.5%
Salt Lake City – Industrial
$0.0
0.0%
0.0%
Salt Lake City – Multifamily
$0.0
0.0%
0.0%
Salt Lake City – Office
$0.0
0.0%
0.0%
Salt Lake City – Other
$0.0
0.0%
0.0%
Salt Lake City – Retail
$0.0
0.0%
0.0%
Salt Lake City – Self Storage
$0.0
0.0%
0.0%
San Antonio – San Antonio, TX MSA
$124.9
2.0%
-0.2%
San Antonio – Hotel
$07.2
2.9%
-0.2%
San Antonio – Industrial
$0.0
0.0%
-0.8%
San Antonio – Multifamily
$0.0
0.0%
-0.2%
San Antonio – Office
$0.0
0.0%
0.0%
San Antonio – Other
$0.0
0.0%
0.0%
San Antonio – Retail
$117.7
19.2%
5.3%
San Antonio – Self Storage
$0.0
0.0%
0.0%
San Diego – San Diego-Carlsbad-San Marcos, CA MSA
$91.7
0.7%
0.0%
San Diego – Hotel
$61.7
3.1%
0.0%
San Diego – Industrial
$0.0
0.0%
0.0%
San Diego – Multifamily
$09.5
0.2%
0.1%
San Diego – Office
$0.0
0.0%
0.0%
San Diego – Other
$20.5
2.9%
0.0%
San Diego – Retail
$0.0
0.0%
-0.4%
San Diego – Self Storage
$0.0
0.0%
0.0%
San Francisco – San Francisco-Oakland-Fremont, CA MSA
$201.2
0.8%
0.1%
San Francisco – Hotel
$115.0
5.3%
2.5%
San Francisco – Industrial
$0.0
0.0%
0.0%
San Francisco – Multifamily
$0.0
0.0%
-0.3%
San Francisco – Office
$0.0
0.0%
0.0%
San Francisco – Other
$38.6
1.5%
-0.7%
San Francisco – Retail
$47.6
3.9%
-0.2%
San Francisco – Self Storage
$0.0
0.0%
0.0%
San Jose – San Jose-Sunnyvale-Santa Clara, CA MSA
$120.8
0.6%
-0.3%
San Jose – Hotel
$120.8
1.9%
-3.9%
San Jose – Industrial
$0.0
0.0%
0.0%
San Jose – Multifamily
$0.0
0.0%
0.0%
San Jose – Office
$0.0
0.0%
-0.2%
San Jose – Other
$0.0
0.0%
0.0%
San Jose – Retail
$0.0
0.0%
0.0%
San Jose – Self Storage
$0.0
0.0%
0.0%
Seattle – Seattle-Tacoma-Bellevue, WA MSA
$108.6
0.5%
0.1%
Seattle – Hotel
$108.6
8.2%
2.3%
Seattle – Industrial
$0.0
0.0%
0.0%
Seattle – Multifamily
$0.0
0.0%
-0.1%
Seattle – Office
$0.0
0.0%
0.0%
Seattle – Other
$0.0
0.0%
0.0%
Seattle – Retail
$0.0
0.0%
0.0%
Seattle – Self Storage
$0.0
0.0%
0.0%
St. Louis – St. Louis, MO-IL MSA
$263.7
6.4%
-2.6%
St. Louis – Hotel
$42.2
15.2%
-0.4%
St. Louis – Industrial
$0.0
0.0%
0.0%
St. Louis – Multifamily
$04.5
0.3%
-0.2%
St. Louis – Office
$0.0
0.0%
-20.2%
St. Louis – Other
$23.0
4.3%
0.1%
St. Louis – Retail
$194.1
21.3%
1.5%
St. Louis – Self Storage
$0.0
0.0%
0.0%
Tampa – Tampa-St. Petersburg-Clearwater, FL
$226.2
2.4%
-1.0%
Tampa – Hotel
$29.8
4.4%
0.0%
Tampa – Industrial
$0.0
0.0%
0.0%
Tampa – Multifamily
$0.0
0.0%
0.0%
Tampa – Office
$23.7
3.6%
-0.3%
Tampa – Other
$0.0
0.0%
0.0%
Tampa – Retail
$172.8
23.2%
-4.0%
Tampa – Self Storage
$0.0
0.0%
0.0%
Tucson – Tucson, AZ MSA
$165.5
5.1%
-0.2%
Tucson – Hotel
$04.7
1.4%
-0.2%
Tucson – Industrial
$0.0
0.0%
0.0%
Tucson – Multifamily
$0.0
0.0%
0.0%
Tucson – Office
$0.0
0.0%
0.0%
Tucson – Other
$0.0
0.0%
0.0%
Tucson – Retail
$160.9
19.3%
-0.8%
Tucson – Self Storage
$0.0
0.0%
0.0%
Virginia Beach – Virginia Beach-Norfolk-Newport News, VA-NC MSA
$126.8
2.7%
-2.2%
Virginia Beach – Hotel
$0.0
0.0%
0.0%
Virginia Beach – Industrial
$21.2
6.9%
0.0%
Virginia Beach – Multifamily
$0.0
0.0%
0.0%
Virginia Beach – Office
$0.0
0.0%
-0.7%
Virginia Beach – Other
$0.0
0.0%
0.0%
Virginia Beach – Retail
$105.6
12.3%
-10.8%
Virginia Beach – Self Storage
$0.0
0.0%
0.0%
Washington, DC – Washington-Arlington-Alexandria, DC-VA-MD-WV MSA
$518.3
1.7%
-0.2%
Washington, DC – Hotel
$49.2
5.1%
3.5%
Washington, DC – Industrial
$11.1
1.6%
-0.4%
Washington, DC – Multifamily
$0.0
0.0%
0.0%
Washington, DC – Office
$302.6
4.0%
-0.8%
Washington, DC – Other
$44.7
2.8%
0.1%
Washington, DC – Retail
$110.7
3.2%
-1.6%
Washington, DC – Self Storage
$0.0
0.0%
0.0%
Grand Total
$20,328.0
2.9%
-0.7%
About CRED iQ
CRED iQ is a commercial real estate data, analytics, and valuation platform providing actionable intelligence to CRE and capital markets investors. Subscribers to CRED iQ use the platform to identify valuable leads for leasing, lending, refinancing, distressed debt, and acquisition opportunities. Our data platform is powered by over $2.0 trillion of CMBS, CRE CLO, SBLL, Ginnie Mae, FHA/HUD, and Freddie Mac loan and property data.
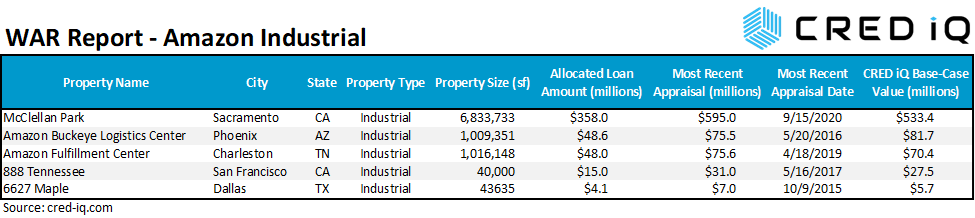
In this week’s WAR Report, CRED iQ calculated updated valuations for five industrial properties leased by Amazon. A Bloomberg article reported on May 21, 2022 that Amazon is seeking to reduce its industrial footprint by at least 10 million sf after overexpanding during the pandemic. Amazon will sublet excess space and exit leases where possible to accommodate the company’s initiative. According to the news article, regions of focus include New York, New Jersey, SoCal, and Atlanta, although any leases with near-term expirations in other markets are likely also under consideration. On a high level, the 10 million sf of planned reductions is a microscopic portion of Amazon’s leased industrial portfolio. However, from the perspective of individual landlords or investors, the loss of a high-profile tenant like Amazon could adversely impact returns and present credit risk on a one-off basis. Featured properties include larger warehouse-type facilities such as an industrial park in California, a logistics center in Phoenix, AZ, and a fulfillment center in rural Tennessee as well as last-mile distribution centers in San Francisco, CA and Dallas, TX.
CRED iQ valuations factor in base-case (most likely), downside (significant loss of tenants), and dark scenarios (100% vacant). For full access to the valuation reports as well as full CMBS loan reporting, including detailed financials, updated tenant information, and borrower contact information, sign up for a free trial here.
McClellan Business Park
6.8 million sf, Industrial/Mixed-Use, Sacramento, CA [View Details]
McClellan Business Park is one of the largest properties by size in CMBS and secures a $358 million mortgage that was originated in November 2020. Amazon is the largest tenant at McClellan Business Park by size and third largest by percentage of base rent. The firm leases a 417,637-sf last-mile distribution facility, one of several buildings in the business park, pursuant to a lease that expires in June 2030. Amazon has two, five-year extension options available at lease expiration, which is about six months prior to loan maturity.
McClellan Business Park is a former Air Force base that was redeveloped primarily for industrial use, but much of the park features other use types such as office, residential, retail, and airplane hangar space. The property was last featured in CRED iQ’s February 2022 report detailing the prevalence of mixed-used collateral in CMBS – Mixed Use Collateral in CMBS Conduits. The property’s former utility as an Air Force base presents some limitations for future redevelopment, caused by environmental factors, should the property need to be repositioned. A recent research report by Academy Securities highlighted some of the other nuances in credit risk facing industrial properties, including a location like McClellan Business Park.
Despite the property’s exposure to Amazon as its largest tenant, the vast size of the property and Amazon’s relatively small footprint (6% of NRA) are mitigating factors of the credit risk posed by potential sublet activity or non-renewal of its lease. Further, Southern California markets such as Los Angeles and San Diego were called out specifically as areas of focus as opposed to Sacramento. For the full valuation report and loan-level details, click here.
1.0 million sf, Industrial, Phoenix, AZ [View Details]
This 1.0 million sf warehouse in Phoenix, AZ secures a $48.6 million loan and is solely leased by Amazon. The tenant operates pursuant to a lease that expires in August 2028, which is two years after loan maturity in August 2026. The Phoenix MSA was not a market singled out by the company as a focus for scaling back warehouse space; however, the timing of the lease expiration relative to loan maturity could present complications when the mortgage debt needs to be refinanced.
The Buckeye Logistics Center was built to suit Amazon in 2007. The tenant still has four, five-year extension options remaining at the end of its lease term and has added space to the building in the past to accommodate growth. Even still, the loan was structured with a cash management provision to sweep cash in the event of any Sublease Events, which include Amazon or any subtenant going dark or Amazon failing to renew 12 months prior to lease expiration. Cash management structures, such as this one, are useful tools to mitigate binary risk and lease rollover concentration for single tenant properties like the Buckeye Logistics Center. For the full valuation report and loan-level details, click here.
1.0 million sf, Industrial, Charleston, TN [View Details]
This fulfillment center in rural Tennessee is part of a three-property portfolio that secures a $139 million loan. Approximately $48 million of the debt is allocated to this Charleston, TN warehouse. The loan is scheduled to mature in two years, June 2024. Amazon occupied the property pursuant to a lease that expires in September 2026, slightly more than two years post maturity. Amazon has four, five-year lease extension options and has a right of first offer to purchase the property. The right of first offer is an example of the methods at Amazon’s disposal for maintaining flexibility in the usage of its warehouse space. The tenant could just as easily expand as contract space as needed. The property participated in a payment-in-lieu-of-taxes (PILOT) program that expired in 2021; however, Amazon is responsible for paying all real estate taxes. For the full valuation report and loan-level details, click here.
40,000 sf, Industrial, San Francisco, CA [View Details]
This 40,000-sf warehouse located on the bayside of San Francisco, CA secures a $15 million loan. Amazon leases the property pursuant to a lease that expires in April 2027, which is two months prior to loan maturity in July 2027. Amazon has a lease termination option during the last two years of the lease term, which equates to a potential departure as early as July 2025. Amazon pays triple-net (NNN) rent of $40 per square foot for the space, which is opportunistically positioned as a last-mile grocery distribution center in a major metropolitan market. Despite the headwinds facing San Francisco in terms of physical occupancy across multiple commercial real estate sectors, the competitive location of the property is an advantage for the borrower. However, Amazon’s termination option allows flexibility for the tenant to reduce its footprint in the market while presenting potential lease rollover risk for the loan within its maturity window. Further, industrial may not be the highest and best use for the underlying land parcel, adding additional questions for Amazon’s long-term presence at the location. At loan maturity, opportunities may exist for bridge financing or construction financing for a repositioning of the property. For the full valuation report and loan-level details, click here.
This 43,635-sf fulfillment center in Dallas, TX secures a $4.1 million loan that matures in May 2026. Amazon occupies the building pursuant to a lease that expires in December 2025, four months prior to loan maturity. Amazon previously signed a five-year extension in December 2020. Similar to previously highlighted properties, the proximity between lease expiration and loan maturity presents potential complications for refinancing at the end of the loan term. The collateral is positioned as a last-mile distribution center, but is an older vintage property, originally constructed in 1956. However, the property was renovated in 2015 prior to loan origination in June 2016. Prior to Amazon’s lease expiration in 2020, the tenant was paying approximately $11.40 per square foot on a triple-net basis. For the full valuation report and loan-level details, click here.
CRED iQ is a commercial real estate data, analytics, and valuation platform providing actionable intelligence to CRE and capital markets investors. Subscribers to CRED iQ use the platform to identify valuable leads for leasing, lending, refinancing, distressed debt, and acquisition opportunities. Our data platform is powered by over $2.0 trillion of CMBS, CRE CLO, SBLL, Ginnie Mae, FHA/HUD, and Freddie Mac loan and property data.
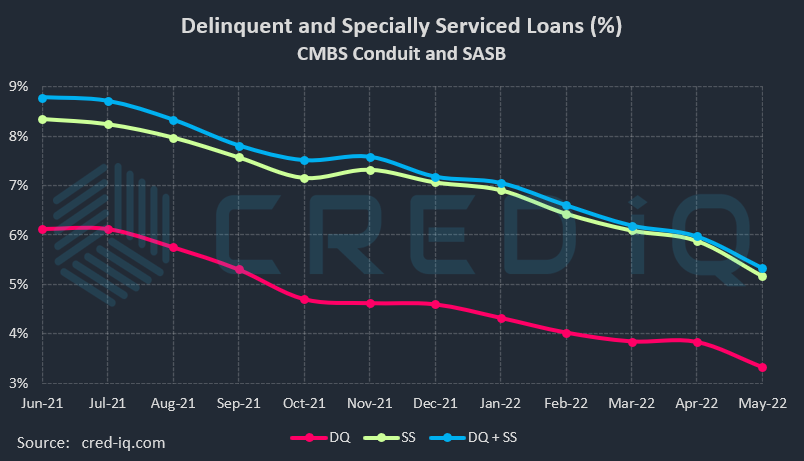
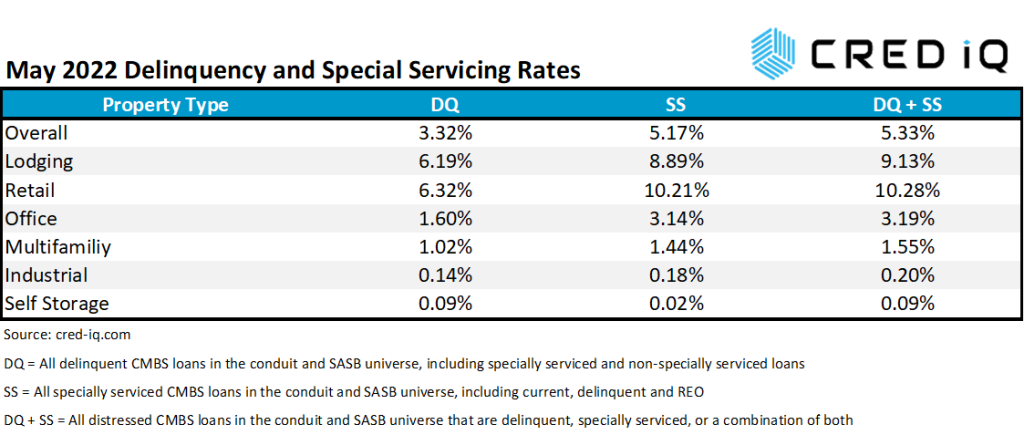
DQ = All delinquent CMBS loans in the conduit and SASB universe, including specially serviced and non-specially serviced loans SS = All specially serviced CMBS loans in the conduit and SASB universe, including current, delinquent and REO DQ + SS = All distressed CMBS loans in the conduit and SASB universe that are delinquent, specially serviced, or a combination of both
The CRED iQ overall delinquency rate for CMBS exhibited a precipitous decline during the May 2022 remittance period, marking two years of consecutive month-over-month decreases. The delinquency rate, equal to the percentage of all delinquent specially serviced loans and delinquent non-specially serviced loans, for CRED iQ’s sample universe of $500+ billion in CMBS conduit and single asset single-borrower (SASB) loans was 3.32%, which compares to the prior month’s rate of 3.83%. CRED iQ’s special servicing rate, equal to the percentage of CMBS loans that are with the special servicer (delinquent and non-delinquent), declined month-over month to 5.17% from 5.88%. The special servicing rate has declined for six consecutive months. Aggregating the two indicators of distress – delinquency rate and special servicing rate – into an overall distressed rate (DQ + SS%) equals 5.33% of CMBS loans that are specially serviced, delinquent, or a combination of both. The overall distressed rate declined compared to the prior month rate of 5.97%. The overall distressed rates typically track slightly higher than special servicing rates as most delinquent loans are also with the special servicer.
DQ = All delinquent CMBS loans in the conduit and SASB universe, including specially serviced and non-specially serviced loans SS = All specially serviced CMBS loans in the conduit and SASB universe, including current, delinquent and REO DQ + SS = All distressed CMBS loans in the conduit and SASB universe that are delinquent, specially serviced, or a combination of both
By property type, the delinquency rate declined in May for all sectors with delinquency cures totaling over $500 million by outstanding balance. As one example of a larger delinquency cure, CRED iQ’s May 2022 Market Delinquency Tracker report noted the Supor Industrial Portfolio as a new 30-day delinquency at the time; however, the late payment was a temporary occurrence and the loan paid current this month. Lodging exhibited the greatest month-over-month improvement among all property types with its delinquency rate improving to 6.19%, compared to 7.55% last month.
Retail had the highest delinquency rate (6.32%) by property type for the second consecutive month. Last month, we observed a delinquency crossover event where the percentage of delinquent lodging loans declined to a level below the delinquency rate for retail for the first time since May 2020, when the delinquency rate for lodging spiked to nearly 20%. However, the retail sector continues to get hit with new high-profile delinquencies each month. This month, $100.6 million Arbor Place Mall loan passed its scheduled May 2022 maturity date without paying off. Prior to the maturity default, the loan had been specially serviced since April 2020. Additionally, an $86.5 million loan secured by the Outlet Shoppes at Oklahoma City failed to pay off at its scheduled maturity on May 1, 2022 and transferred to special servicing on May 5, 2022.
Special servicing rates also declined across all major property types this month, exhibiting similar trend characteristics as property-specific delinquency rates. Despite the improvements in special servicing rates, the most recent reporting period was not without major credit developments in the office/mixed-use sector, especially within the Manhattan, NY market. Two notable special servicing transfers of office/mixed-use buildings occurred this month. The largest was a $235 million senior mortgage secured by 285 Madison Avenue, a 511,208-sf office tower located in the Grand Central submarket — as reported by Commercial Observer on May 23rd. Additionally, the $226.3 million 693 Fifth Avenue loan transferred to special servicing in April 2022 after ongoing issues from the departure of the collateral property’s former retail tenant, Valentino.
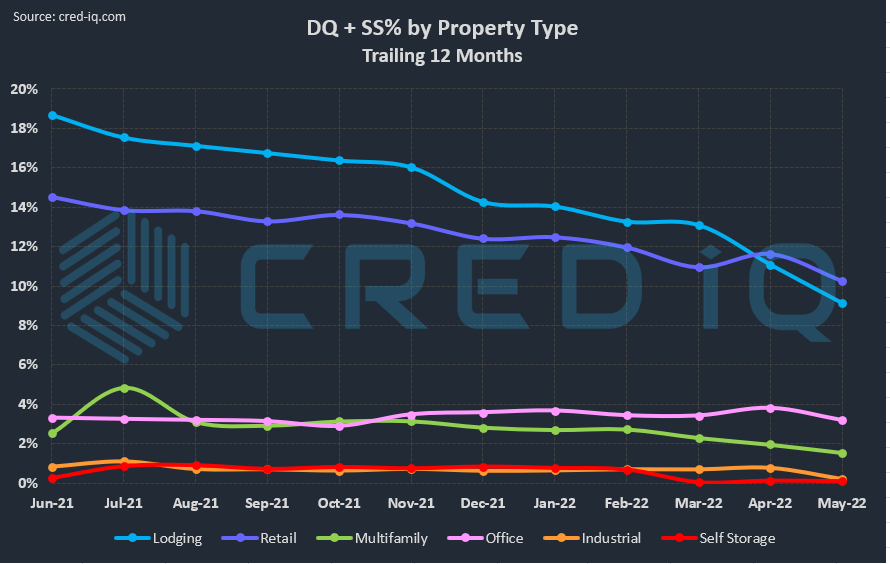
DQ + SS = All distressed CMBS loans in the conduit and SASB universe that are delinquent, specially serviced, or a combination of both
CRED iQ’s overall CMBS distressed rate (DQ + SS%) by property type accounts for loans that qualify for either delinquent or special servicing subsets. This month, overall distressed rates for all property types declined. Two of the largest loans added to the distressed category this month, both via transfers to special servicing, were the aforementioned 285 Madison Avenue and 693 Fifth Avenue. For additional information about these two loans, click View Details below:
CRED iQ is a commercial real estate data, analytics, and valuation platform providing actionable intelligence to CRE and capital markets investors. Subscribers to CRED iQ use the platform to identify valuable leads for leasing, lending, refinancing, distressed debt, and acquisition opportunities. Our data platform is powered by over $2.0 trillion of CMBS, CRE CLO, SBLL, and GSE Agency loan and property data.
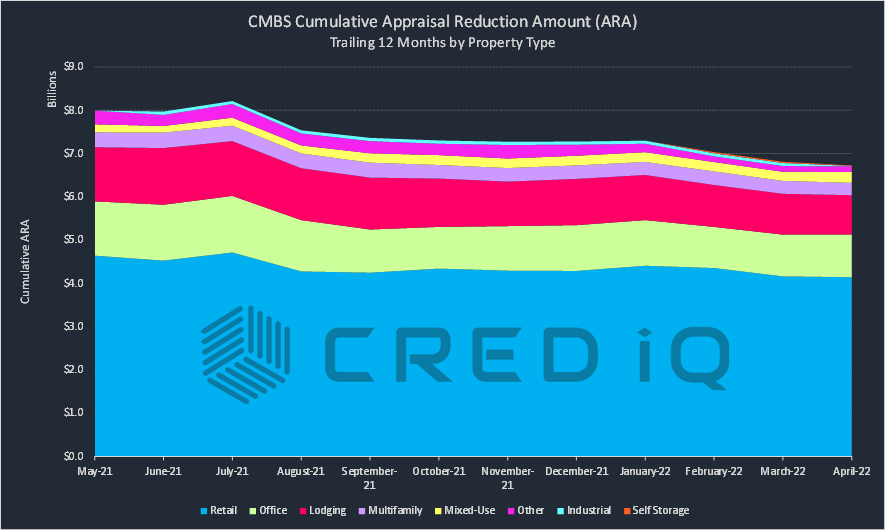
CRED iQ monitored trends in cumulative appraisal reduction amounts (ARAs) for the CMBS universe over the past year, gauging levels of distress and the prevalence of loan workouts and cures. An ARA is a mechanism that reduces the amount of servicer advances for distressed loans, usually secured by collateral with deteriorated valuations. An ARA is a high-level metric for monitoring the approximate level of distress in a CMBS pool and a key function in the management of the waterfall structure of a CMBS securitization. Additionally, the cumulative ARA for a particular deal, among other things, plays a role in determining changes in the controlling certificate holder of a deal and factors into thresholds for determining if a deal needs additional oversight in the form of an operating advisor. Monitoring the cumulative ARA for CMBS transactions can give broad insight into principal loss expectations; however, it is generally viewed that any given individual ARA for a loan is not an accurate predictor for realized losses at final resolution.
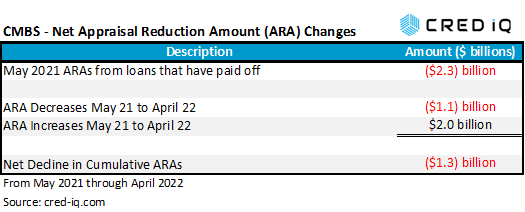
The cumulative amount of ARAs in CMBS securitizations trended down significantly over the past 12 months. Cumulative ARAs across conduit, SASB, CRE CLO, and Freddie K CMBS transactions were approximately $1.3 billion lower in April 2022 than in May 2021. The net decline is attributed to multiple factors: REO asset liquidations or loan dispositions, loan workouts, and property value recoveries (in less frequent instances). Conversely, ARA declines are offset by increases caused by property value declines and transfers to special servicing. ARAs totaling approximately $2.3 billion as of May 2021 were assigned to loans that were no longer active as of April 2022 – these loans were either liquidated, resolved, or paid off. There were ARA reductions totaling approximately $1.1 billion from May 2021 through April 2022. Reductions included loans that were worked out and returned to the master servicer, eliminating the servicer’s need to advance debt service and property protection expenses, as well as loans secured by collateral that exhibited recoveries in valuations.
Despite the net decline in ARA over the last year, there were over $2 billion in ARA increases which included loans with newly assigned ARAs and loans secured by properties with deteriorating valuations compared to 12 months prior. Overall, these three buckets — ARAs no longer active due to liquidations or payoffs, ARA increases on active loans, and ARA decreases on active loans — combined to produce the net $1.3 billion decline in cumulative ARAs from May 2021 to April 2022.
Retail properties accounted for 62% of cumulative ARAs in CMBS as of April 2022, which is the majority of appraisal reductions. Cumulative retail ARAs as of April totaled $4.1 billion with most of the total tied to regional malls with outsized debt balances. Office (15%) and lodging (14%) represented the next two highest concentrations of ARAs by property type, each accounting for just under $1 billion in appraisal reductions. While cumulative ARAs for both office and lodging loans have exhibited net declines compared to 12 months prior, the two property types have shown opposing trends over the past three months. Cumulative ARAs for lodging loans have declined in consecutive months since February 2022 while cumulative ARAs for office loans have risen for three consecutive months.
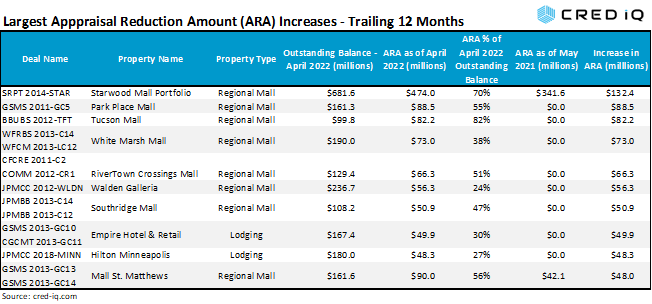
Circling back to regional malls, the retail subtype has been the source of headline risk for CMBS investors with significant variation in opinions on projected losses. Eight of the 10 largest increases in individual ARAs for active loans as of April 2022 compared to a year ago are secured by regional malls. Six of those loans did not have an ARA assigned as of May 2021. The largest individual increase in an ARA for a loan over the past 12 months was associated with the $681.6 million Starwood Mall Portfolio, which is secured by The Mall at Wellington Green (Wellington, FL), MacArthur Center (Norfolk, VA), Northlake Mall (Charlotte, NC), and The Mall at Partridge Creek (Clinton Township, MI). The ARA for the loan was $341.6 million as of May 2021 but ballooned to $474 million as of April 2022, equal to a $132.4 million increase or 39%.
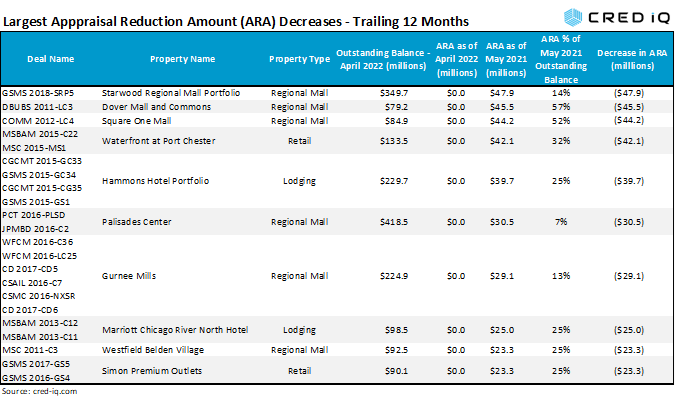
As of April 2022, six of the 10 largest decreases in individual ARAs for outstanding loans over the trailing 12 months were secured by regional malls. The ARAs for all six of these loans were reduced to zero after each loan was returned to the master servicer during the past 12 months. A return of a loan to the master servicer from special servicing is an action that allows an appraisal trigger event to no longer exist, which reduces ARA to zero. Also notable about the largest ARA declines from a year ago is that four of the loans had placeholder ARAs, equal to 25% of the loan balance. Placeholder ARAs are automatic calculations used to reduce servicer advances in the event a timely appraisal cannot be obtained, is determined to not be warranted, or has questionable assumptions in the view of the special servicer. Ironically, the loan with the largest individual ARA decline over the past 12 months is the Starwood Regional Mall Portfolio, similarly named as the loan with the highest ARA increase. This $513.2 million loan is secured by five regional malls – Plaza West Covina, Franklin Park Mall, Parkway Plaza, Capital Mall, and Great Northern Mall — see CRED iQ’s March 2022 Weekly Asset Review. The loan was in special servicing in May 2021 but returned to the master servicer in January 2022 and no longer carries an ARA. However, the absence of an ARA does not preclude an eventual realized loss for the loan. As stated above, an ARA, whether one even exists, and the size of it is generally not an accurate indicator of the final tally of a loan’s performance when it exits a CMBS pool.
About CRED iQ
CRED iQ is a commercial real estate data, analytics, and valuation platform designed to unlock investment, financing, and leasing opportunities. CRED iQ provides real-time property, loan, tenant, ownership, and valuation data for over $2.0 trillion of commercial real estate.
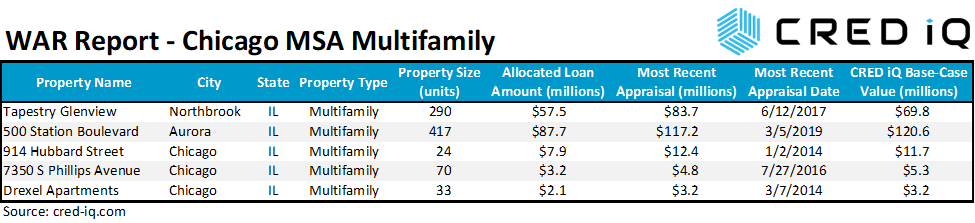
In this week’s WAR Report, CRED iQ calculated updated valuations for five delinquent loans secured by multifamily properties located in the Chicago, IL MSA. According to CRED iQ’s Market Delinquency Tracker, the Chicago MSA had over $185 million in outstanding distressed commercial mortgages secured by multifamily properties as of April 2022. The distressed rate for Chicago multifamily was 1.9% — inclusive of all loans listed as 30 days delinquent or worse, as well as specially serviced loans within the securitized universe of Conduit, Agency, SBLL, and CRE CLO transactions. The distressed rate for Chicago multifamily was among the highest of the Top 50 MSAs covered by CRED iQ. Featured properties include apartments located in Northbrook, IL, Aurora, IL, and multiple submarkets in Chicago.
CRED iQ valuations factor in base-case (most likely), downside (significant loss of tenants), and dark scenarios (100% vacant). For full access to the valuation reports as well as full CMBS loan reporting, including detailed financials, updated tenant information, and borrower contact information, sign up for a free trial here.
Tapestry Glenview Apartments
290 units, Multifamily, Northbrook, IL [View Details]
This $57.5 million floating-rate loan, secured by Tapestry Glenview Apartments in Northbrook, IL, became 30 days delinquent in April 2022. The loan does not have a history of delinquency; however, occupancy levels have been suboptimal in recent years. Pre-pandemic occupancy at the property was 74% as of year-end 2019 but improved to 87% in 2020. The last reported occupancy for the property was 82% as of July 2021. Despite inconsistent occupancy, net cash flow at the property has been sufficient to cover debt service, even with interest rates rising during the past few months. There was no history of COVID-related forbearance being granted for the loan and the loan did not appear on the most recent master servicer’s watchlist. The delinquency is worth monitoring but a timely cure is a probable outcome. Other considerations for the loan include its near-term maturity, which is scheduled for September 1, 2024. Prior to the loan’s four-month open period, a prepayment penalty of 1% would be required to retire the debt. For the full valuation report and loan-level details, click here.
Mortgage debt secured by 500 Station Apartments, a 417-unit property in Aurora, IL, appears to have been refinanced after April 2022 servicer data indicated a potential delay in repayment at the loan’s maturity date. The total mortgage commitment for the property totaled $88.2 million, which represented the post-closing fully funded amount. Additionally, the borrower had two, one-year extension options after the initial April 22, 2022 maturity date. The loan was marked delinquent in April but appears to have paid off in full according to servicer data from May 2022. The borrower’s business plan was to lease up vacant units at market rents while reducing operational inefficiencies. The property was 91% occupied at origination in 2019; however minimal performance updates were provided through the loan’s maturity date. For the full valuation report and loan-level details, click here.
This $7.9 million loan, which is over 60 days delinquent, is secured by a 24-unit mid-rise apartment building in the West Loop submarket of Chicago. Servicer commentary indicates the borrower has been unresponsive and has not reported updated financials since March 2020. The loan has not yet transferred to special servicing as of May, but a transfer could be imminent given the escalating delinquency — the loan was 30 days delinquent during the prior month. The collateral property is a four-story building that overlooks an interchange on Interstate 90. The last reported occupancy for the property was 96% as of March 2020. For the full valuation report and loan-level details, click here.
This $3.2 million loan, which is 30 days delinquent, is secured by a 70-unit apartment building in the South Shore neighborhood of Chicago. The loan has had delinquency issues since 2021 and throughout 2022. The property was 81% occupied as of July 2021, which is a substantial decline from 94% occupancy at the time of loan origination in 2016. The collateral property is a five-story building that offers affordable housing units. A transfer to special servicing may be imminent if delinquent payments persist. For the full valuation report and loan-level details, click here.
This $2 million loan transferred to special servicing in September 2018 due to issues related to the borrowing entity’s involvement in a complaint by the Securities and Exchange Commission (SEC). The loan has had delinquency issues since its transfer to special servicing and is over 120 days delinquent. An Order Appointing Receiver was filed in August 2018 that prevents any party from pursuing foreclosure or any other remedy, which limits the special servicer’s options for workout. The collateral, multiple apartment buildings in Hyde Park, was reportedly sold by the receiver in May 2019; however any distributions from the proceeds from the sale must go through a litigation process that is ongoing. For the full valuation report, and loan-level details, click here.
CRED iQ is a commercial real estate data, analytics, and valuation platform providing actionable intelligence to CRE and capital markets investors. Subscribers to CRED iQ use the platform to identify valuable leads for leasing, lending, refinancing, distressed debt, and acquisition opportunities. Our data platform is powered by over $2.0 trillion of CMBS, CRE CLO, SBLL, Ginnie Mae, FHA/HUD, and Freddie Mac loan and property data.
As the commercial real estate industry continues to adjust to a rising interest rate environment, CRED iQ examined the latest trends in defeasance activity. Reports of defeasance requests have trended higher in recent months. Generally, in a low-rate environment defeasance is an opportunity for borrowers to take advantage of refinancing existing debt at a comparatively lower rate. In the current environment of rising interest rates, borrowers are motivated by risk from the opportunity cost of waiting to refinance at maturity when rates could be significantly higher than current rates or the risk of not cashing out equity before a recessionary environment could adversely impact commercial real estate values.
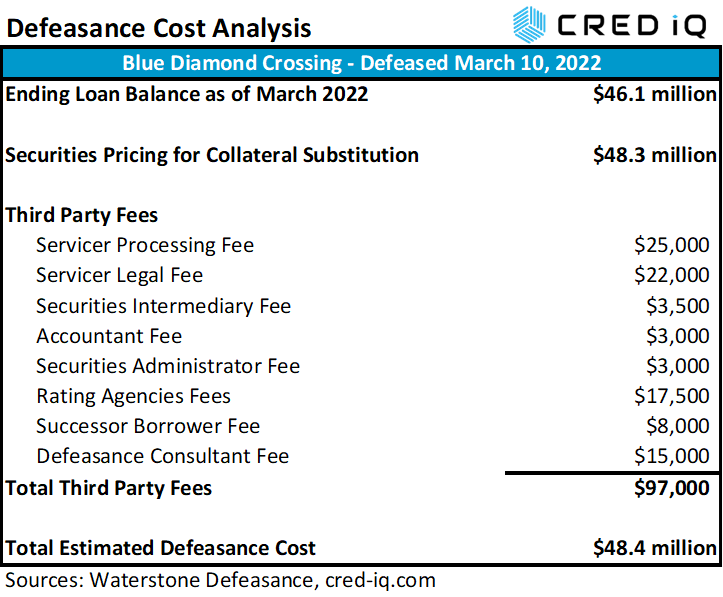
Other factors to consider are rising US treasury yields compared to 2021. With higher US treasury yields, substituting real estate collateral for US treasuries or similar securities that match loan cash flows becomes more economical from a cost perspective. In addition to the cost of purchasing cash-flow-equivalent securities, defeasance costs also comprise additional fees which generally can include accounting fees, consulting fees, costs associated with a legal review or rating agency confirmation, custodial fees for the collateral securities, servicer processing costs, and costs associated with the successor borrower. As an example, Blue Diamond Crossing is a $46 million loan that defeased on February 10, 2022. The loan will be open for prepayment in December 2022 and has a maturity date of April 1, 2023, which was more than a year from the time of defeasance. The event was driven by the borrower securing a new refinancing package for the loan collateral, a 505,072-sf retail center in Las Vegas, NV. The borrower was able to take advantage of a lower cost of capital compared to loan origination in 2013 while also staying ahead of imminently higher interest rates. The total cost of defeasance was more than $48 million, approximately 5% higher than the outstanding balance of the loan at the time. The defeasance cost analysis for this particular transaction is detailed in the table below.
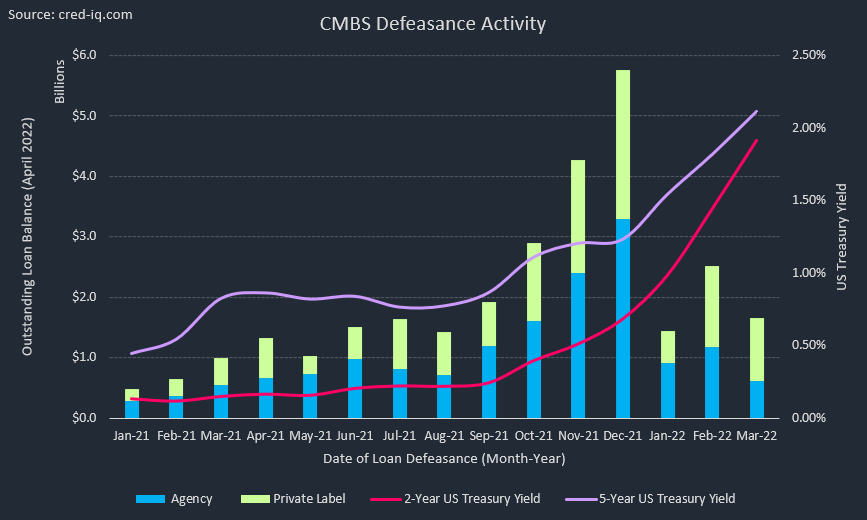
Overall, CRED iQ identified more than 6,000 loans — across CMBS conduit, SBLL, CRE CLO and Freddie K securitizations — with an outstanding balance greater than $65 billion that were defeased as of March 2022. Defeasance activity during Q1 2022 totaled $5.6 billion across more than 350 loans. For each month in Q1 2022, defeasance activity was higher year over year than in 2021. The largest difference was in February 2022, when defeasance activity was nearly 4x higher than the February 2021 total, based on outstanding balance. Most recently in March 2022, the average time to maturity for loans that defeased was approximately 3.5 years. Extending the view historically, time to maturity generally averaged from three to four years for loans that defeased during 2021 and through Q1 2022.
Multifamily was the property type most commonly associated with defeasance by a wide margin, accounting for greater than 60% of all properties that were substituted. However, this figure was inclusive of Freddie K securitizations. Isolating defeasance activity to conduit and SBLL transactions (CRE CLO defeasance was nominal), multifamily was still the property type most commonly associated with defeasance with 25% of activity by outstanding balance. Office was close behind, accounting for 24% of outstanding defeased loans by unpaid balance. Unsurprisingly, loans secured by lodging collateral were least commonly defeased given headwinds faced by the industry during the pandemic. Loans previously secured by lodging collateral accounted for 5% of all defeased loans
Recent observations of client defeasance calculator usage (integrated and powered by Waterstone Defeasance) show a surge in activity. The increase in defeasance appetite across CRED iQ users is expected to remain elevated over the near to intermediate term. According to George Rodriguez, principal at Waterstone Defeasance:
“Defeasance activity continues to spike up due to the Fed taking action to combat inflation, with rate increases of 75 bps and another 100 bps or more waiting in the wings over the next two quarters. Borrowers are now actively reviewing their exit strategies, selling or refinancing to extract the equity in their real estate holdings as well as locking in current rates now vs refinancing at a higher rate as they near their loan maturities.
Defeasance advisors and servicers are having a busy spring and we are forecasting more of the same through the summer. Where the Fed lands over the next several months on rate hikes to battle inflation, may start to impact real estate valuations and higher cap rates. We are starting to see the lenders tapping their breaks on securitizations as the Fed tries for a soft landing as bond buyers watch cautiously.”
About CRED iQ
CRED iQ is a commercial real estate data, analytics, and valuation platform providing actionable intelligence to CRE and capital markets investors. Subscribers to CRED iQ use the platform to identify valuable leads for leasing, lending, refinancing, distressed debt, and acquisition opportunities. Our data platform is powered by over $2.0 trillion of CMBS, CRE CLO, SBLL, Ginnie Mae, FHA/HUD, and Agency loan and property data.
This week, CRED iQ calculated updated valuations for three multifamily properties that secure delinquent GNMA loans. Although Ginnie Mae loans have mortgage insurance from the FHA as well as a timely payment guarantee, delinquent Ginnie Mae loans can still lead to foreclosure that can provide opportunities for distressed investors looking to step in and inject additional capital or create value-add plans by improving operations. Mortgage originators, distressed investors, and commercial brokers can search CRED iQ’s database of approximately 15,000 Ginnie Mae loans totaling more than $138 billion in outstanding debt for their next deal. The properties featured in this week’s WAR Report secure a subset of select Ginnie Mae loans that are at least 30 days delinquent. The highlighted loans are all secured by senior housing collateral, including a skilled nursing facility (SNF) in Plainsboro, NJ near Princeton Medical Center.
CRED iQ valuations factor in base-case (Most Likely), downside (significant loss of tenants), and dark scenarios (100% vacant). For full access to the valuation reports as well as full CMBS and GNMA loan reporting, including detailed financials and borrower contact information, sign up for a free trial here.
This $26.5 million loan, which is over 60 days delinquent, is secured by a 200-bed skilled nursing facility in Plainsboro, NJ, located across the street from Princeton Hospital and the adjacent medical center. The mortgage backs a Ginnie Mae project loan pool and was originated by KeyBank in September 2015. The FHA-insured mortgage was issued through the Department of Housing and Urban Development’s (HUD) 232 program for nursing homes and assisted-living facilities pursuant to Section 223(f) for the acquisition or refinancing of existing mortgages. The loan has an interest rate of 3.54% and a 35-year term with a maturity date in October 2050. Call protection is in the form of 0/10 — no lockout and a 10-year declining prepayment penalty, which is estimated to be 3% of the outstanding balance as of 2022.
Merwick Care & Rehabilitation has 200 beds across 128 units and participates in both Medicare and Medicaid. The skilled nursing facility averages approximately 155 residents per day. The property last had a health inspection in December 2021 and 11 health citations were reported, which is higher than the national average and significantly higher than the average for the state of New Jersey. COVID vaccination rates for residents are in line with the national average of 87%. Despite the reported delinquency, the property is strategically located next to a well-established medical center and has several amenities including, a 3,500-sf gym, on-site dialysis, and advanced rehabilitation equipment. For the full valuation report and loan-level details, click here.
97 units, Assisted Living Facility, Bedford, NH [View Details]
GNMA 2016-36195NBG2
This $14.2 million loan, which is over 90 days delinquent, is secured by a 97-unit senior housing facility in Bedford, NH, approximately 55 miles northwest of Boston, MA. Similar to Merwick Care & Rehabilitation, the mortgage loan was endorsed for insurance under Section 232 pursuant to Section 223(f), facilitating financing for nursing homes and assisted-living facilities. Orix Real Estate Capital originated the loan in February 2014 with an original balance of $15.5 million. The fully amortizing loan has a term of 35 years and an interest rate of 3.95%. Prepayment terms include a zero-year lockout and a 10-year declining penalty starting at 10%. Specifically, the loan was five months delinquent as of April 2022 but servicer data indicates the loan has been modified. As for the collateral property, Bentley Commons at Bedford offers one-bedroom and two-bedroom configurations with health services that include hospice care and physical therapy. Minimal COVID cases were reported at the property as of February 2022, but the facility had over 20 confirmed cases a year prior in February 2021. For the full valuation report and loan-level details, click here.
312 units, Assisted Living Facility, Andover, KS [View Details]
GNMA 2020-3617QSPH5
This $13.8 million loan is over 90 days delinquent and is secured by a 312-unit senior housing facility in Andover, KS, approximately 12 miles outside of Wichita. The mortgage backs a Ginnie Mae project loan pool and was originated by Dwight Capital in March 2020. The loan was five months delinquent as of April 2022. The loan falls under both Section 232 and Section 223(f) of FHA’s mortgage insurance program. The loan is fully amortizing throughout its 35-year term and has an interest rate of 3.75%. Prepayment terms are 2/8 — a two-year lockout ending December 2022 followed by an eight-year declining prepayment penalty period starting at 8%. Servicer data indicates the loan has been modified. The property neighbors a management-affiliated skilled nursing facility (SNF), which does not serve as collateral for the mortgage. The adjacent SNF rates poorly on several metrics including health citations and vaccinations rates. Poor management may be a shared attribute contributing to the delinquency at Watercrest at Victoria Falls. For the full valuation report and loan-level details, click here.
CRED iQ is a commercial real estate data, analytics, and valuation platform providing actionable intelligence to CRE and capital markets investors. Subscribers to CRED iQ use the platform to identify valuable leads for leasing, lending, refinancing, distressed debt, and acquisition opportunities. Our data platform is powered by over $2.0 trillion of CMBS, CRE CLO, SBLL, Ginnie Mae, FHA/HUD, and Agency loan and property data.
This week, CRED iQ reviewed the commercial real estate lending landscape and highlighted five properties that secured financing in April 2022. The highlighted loan originations feature five different property types — mixed-use, industrial, retail, lodging and self-storage. The largest featured recent origination is secured by a mixed-use property located in the Los Angeles MSA.
Using the CRED iQ platform’s Comps functionality, which features propriety Comps scoring for the CRE loan universe, we compared lending terms and loan structures to get a sense of the trends in the CRE lending environment. The impacts of a rising rate environment this month as most new originations have comparatively higher interest rates then their most relevant comps.
CRED iQ additionally provided valuations for each asset to evaluate leverage levels in relation to originators’ LTVs. The CRED iQ valuations factor in base-case (most likely), downside (significant loss of tenants), and dark scenarios (100% vacant). Base-case valuations for select properties are provided below. For access to the valuation reports as well as full CMBS loan reporting, including detailed financials, updated tenant information, and borrower contact information, sign up for a free trial here.
806,960 sf, Mixed Use (Office/Retail), Los Angeles, CA
A $150 million loan was originated by Deutsche Bank on April 13, 2022 to refinance existing debt on The Reef, a mixed-use property in Los Angeles, CA. The interest-only loan had a 10-year term and was structured with an interest rate of 5.425%. The loan will be locked out from prepayment for two years, and defeasance will be permitted after lockout through the remainder of the loan term until its open period, five months prior to maturity.
Using CRED iQ’s Comps functionality, one of the most comparable originations is a loan secured by the Pershing Square Building, a 153,381-sf mixed-use building located approximately 1.5 miles north on South Hill Street. The interest-only loan has a balance of $44 million and was originated in May 2017. The comparable loan’s interest rate was 4.64%, which is 79 bps lower than the new origination for The Reef.
The Reef is a 12-story mixed-use building in Downtown Los Angeles that contains office and retail showroom space. Most notable about the building is the property’s LED signage, which covers three sides of the building’s top floors and totals approximately 41,000 sf. The LED signage is positioned strategically for view by vehicular traffic on I-10 (Santa Monica Freeway) and I-110 (Harbor Freeway). The LED signage is licensed to a third-party operator that shares 75% of the net profit with the borrower, paying a minimum license fee of approximately $2.7 million per year. Based on the originator’s underwritten financial statements, LED signage accounted for 40% of the property’s effective gross income. The high concentration of income from LED signage, which can fluctuate based on contracted amounts to the third-party operator, presents credit risks from potential disruptions of the effectiveness of the LED advertisements. Temporary limitations to visibility, obstructions of view, or loss of power are all events that could result in lower income from the building’s LED signage. The building’s office space was 78% leased as of February 2022.
The property was appraised at a value of $349 million ($432/sf) as of November 11, 2021. The appraisal resulted in an LTV of 43%, and an implied cap rate of 5.53% based on the originator’s underwritten NCF. The debt yield came in at 12.9%, also based on NCF from the originator’s underwriting. For the full valuation report and loan-level details, click here.
Subject Property
Name
The Reef
Address
1933 South Broadway Los Angeles, CA 19017
Property Type
Mixed Use
Property Subtype
Office/LED Signage/Retail
Property Size
806,960 sf
Year Built
1958
Submarket
Downtown Los Angeles
County
Los Angeles
MSA
Los Angeles-Long Beach-Santa Ana, CA
Origination Date
4/13/2022
Loan Amount
$150,000,000
Interest Rate
5.425%
Debt Yield (UW NCF)
12.86%
Valuation
Appraised Value
$349,000,000 ($432/sf)
Appraisal Date
11/11/2021
Appraisal LTV
43.0%
CRED iQ Base-Case Value
$296,000,000 ($367/sf)
1600 Brittmoore
110,231 sf, Industrial, Houston TX
JP Morgan funded a $9.5 million mortgage on April 14, 2022 to refinance existing debt on an industrial property located in Houston, TX. The 10-year loan was structured with interest-only payments for three years followed by amortizing payments based on a 30-year schedule. The interest rate for the mortgage was 5.607%. Prepayment provisions for the loan include a two-year lockout period until defeasance is permitted. CRED iQ’s highest scoring loan comp is Brittmoore Industrial Park, a $4.8 million loan that was originated in August 2017. The loan is secured by a 72,000-sf multi-tenant industrial property located along Brittmoore Road, about a mile away. The comparable loan had an interest rate of 4.49%, which is significantly lower than the new origination. Key differences include the comparably higher risk profile of 1600 Brittmoore, which is a single tenant property.
The 1600 Brittmoore property comprises multiple flex industrial buildings, which are all leased to single tenant, Us Living. The tenant, which operates in the real estate development space, is also the loan sponsor but still leases space at the property pursuant to an agreement that expires in April 2037. The property was appraised for $17.4 million ($158/sf) as of March 9, 2022, which resulted in an LTV of 55%. The originator’s underwritten NCF implied a cap rate of 4.82% and a debt yield of 8.8%. For the full valuation report and loan-level details, click here.
Subject Property
Name
1600 Brittmoore
Address
1600 Brittmoore Road Houston, TX 77043
Property Type
Industrial
Property Subtype
Flex
Property Size
110,231 sf
Year Built
1981
Submarket
Northwest
County
Harris
MSA
Houston-Sugar Land-Baytown, TX
Origination Date
4/14/2022
Loan Amount
$9,500,000
Interest Rate
5.607%
Debt Yield (UW NCF)
8.83%
Valuation
Appraised Value
$17,400,000 ($158/sf)
Appraisal Date
3/9/2022
Appraisal LTV
54.6%
CRED iQ Base-Case Value
$16,570,000 ($150/sf)
Harundale Plaza
77,327 sf, Retail, Glen Burnie, MD
Time Equities secured $9.25 million in mortgage debt from Morgan Stanley on April 1, 2022 to acquire Harundale Plaza, a retail center in Glen Burnie, MD, located approximately 11 miles south of Baltimore. The property was sold by SITE Centers for $16.4 million. The 10-year loan is structured with interest-only debt service payments and an interest rate of 4.2%. The loan will be locked out from prepayment for about two years, and defeasance will be permitted after lockout through the remainder of the loan term until its open period, four months prior to maturity. One of CRED iQ’s highly rated comparable loans for the new origination is Mitchellville Plaza, a $25.2 million mortgage that was originated in January 2020. The loan had an interest rate of 3.55%, which was 65 bps lower than the new origination. Mitchellville Plaza, anchored by Weis Market, is located approximately 25 miles away from Harundale Plaza and is within the Washington, DC MSA.
Harundale Plaza totals 217,619 sf in size, but approximately 139,000 sf is freely releasable from the mortgage loan without prepayment, leaving only 77,327 sf encumbered by the mortgage. The collateral is anchored by Lidl pursuant to a lease that expires in January 2031, which is 15 months prior to loan maturity. The grocer accounts for 41% of the property’s NRA. The collateral was appraised for $13.8 million ($178/sf) on February 10, 2022, resulting in an LTV of 67%. The implied cap rate based on the originator’s underwritten NCF was 7.45% and the debt yield was equal to 11.1% based on the same metrics. For the full valuation report and loan-level details, click here.
Subject Property
Name
Harundale Plaza
Address
7440 Ritchie Highway Glen Burnie, MD 21061
Property Type
Retail
Property Subtype
Anchored
Property Size
77,327 sf
Year Built
1999
Submarket
Route 2/3
County
Anne Arundel
MSA
Baltimore-Towson, MD MSA
Origination Date
4/1/2022
Loan Amount
$9,250,000
Interest Rate
4.20%
Debt Yield (UW NCF)
12.86%
Valuation
Appraised Value
$13,800,000 ($178/sf)
Appraisal Date
2/10/2022
Appraisal LTV
67.0%
CRED iQ Base-Case Value
$13,800,000 ($178/sf)
Holiday Inn Express and Suites Uniontown
90 keys, Limited-Service Hotel, Uniontown, PA
A $5.75 million loan was originated by Deutsche Bank on April 8, 2022 to refinance existing debt on a limited-service hotel in Uniontown, PA, located approximately 45 miles south of Pittsburgh, PA. The 10-year loan has an interest rate of 5.67% and was structured with amortizing debt service payments based on a 30-year schedule. Due to the tertiary location of the collateral property, the number of high scoring loan comps was limited. Notably, the three highest rated comps for the new origination were all distressed as of April 2022, including two loans secured by hotels in Morgantown, WV, located approximately 20 miles away from Uniontown, PA.
The collateral property has 90 rooms and operates as a Holiday Inn and Express Suites under a franchise agreement with IHG until May 2036. The hotel averaged 75% occupancy for the trailing 12 months ended February 2022. During that period, the ADR was $89 and RevPAR was $67. The property was appraised for $8.7 million ($96,667/key) as of December 1, 2021, which resulted in an LTV of 66%. Based on the originator’s underwritten NCF, the implied cap rate was 10.57% and the debt yield was 16.0%. For the full valuation report and loan-level details, click here.
Subject Property
Name
Holiday Inn Express & Suites Uniontown
Address
305 Mary Higginson Lane Uniontown, PA 15401
Property Type
Hotel
Property Subtype
Limited Service
Property Size
90 keys
Year Built
2016
Submarket
Non-Metro Pennsylvania
County
Fayette
MSA
Pittsburgh, PA
Origination Date
4/8/2022
Loan Amount
$5,755,000
Interest Rate
5.670%
Debt Yield (UW NCF)
15.98%
Valuation
Appraised Value
$8,700,000 ($96,667/key)
Appraisal Date
12/1/2021
Appraisal LTV
66.1%
CRED iQ Base-Case Value
$8,239,000 ($91,548/key)
Stafford Self Storage
36,900, Self-Storage, Stafford Springs, CT
Wells Fargo originated a $2.8 million loan on April 5, 2022 to refinance existing debt on a self-storage property in Stafford Springs, CT, located approximately 26 miles outside of Hartford. The 10-year loan amortizes based on a 30-year schedule and has an interest rate of 4.672%. The loan will be locked out from prepayment for about two years, and defeasance will be permitted after lockout through the remainder of the loan term until its open period, seven months prior to maturity. CRED iQ’s highest scoring comp was Prime Storage Boston Road, which was part of an 11-property portfolio that secured a $61 million loan. The loan was originated in May 2015 and had an interest rate of 4.71%. The loan defeased in July 2021.
Stafford Self Storage contains 334 units ranging from 5’ x 5’ to 10’ x 30’. The property was appraised at a value of $4.35 million ($118/sf) as of February 21, 2022. The appraisal resulted in an LTV of 64%, and an implied cap rate of 8.07% based on the originator’s underwritten NCF. The debt yield came in at 12.6%, also based on NCF from the originator’s underwriting. For the full valuation report and loan-level details, click here.
Subject Property
Name
Stafford Self Storage
Address
40 West Stafford Road Stafford Springs, CT 06076
Property Type
Self Storage
Property Size
36,900 sf
Year Built
1989
Submarket
Hartford
County
Tolland
MSA
Hartford, CT
Origination Date
4/5/2022
Loan Amount
$2,800,000
Interest Rate
4.67%
Debt Yield (UW NCF)
12.54%
Valuation
Appraised Value
$4,350,000 ($118/sf)
Appraisal Date
2/21/2022
Appraisal LTV
64.4%
CRED iQ Base-Case Value
$3,998,000 ($108/sf)
For full access to our loan database and valuation platform, sign up for a free trial below:
CRED iQ is a commercial real estate data, analytics, and valuation platform providing actionable intelligence to CRE and capital markets investors. Subscribers to CRED iQ use the platform to identify valuable leads for leasing, lending, refinancing, distressed debt, and acquisition opportunities. Our data platform is powered by over $2.0 trillion of CMBS, CRE CLO, SBLL, Ginnie Mae, FHA/HUD, and Agency loan and property data.
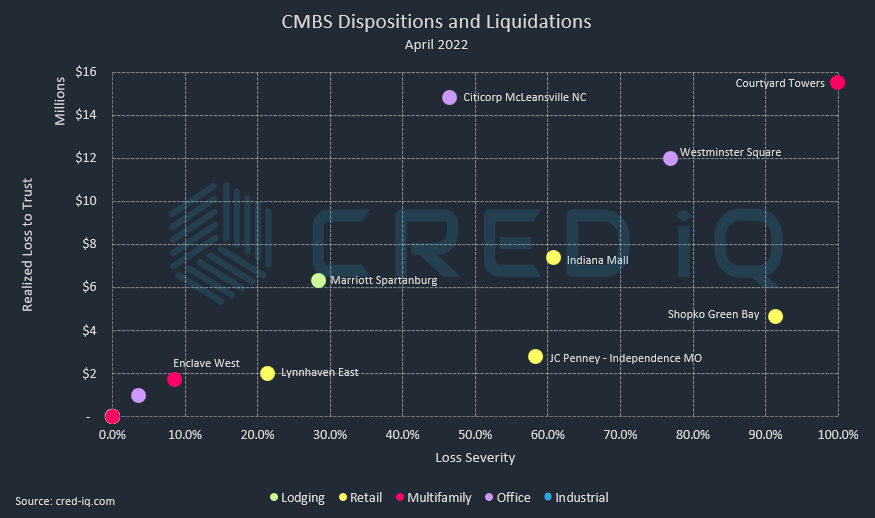
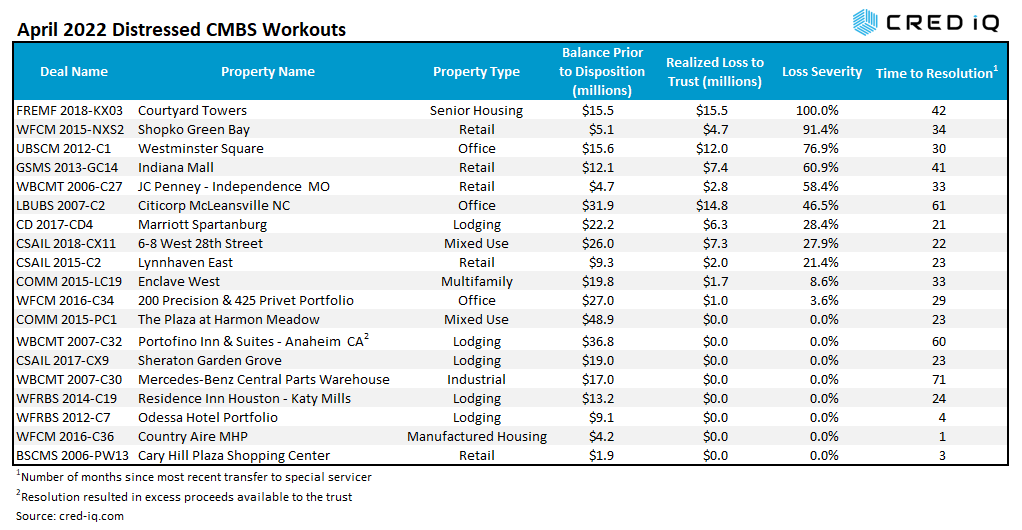
CMBS conduit transactions incurred approximately $60 million in realized losses during April 2022 through the workout of distressed assets. Additionally, a $15.5 mortgage securitized in a Freddie K-Deal securitization, Courtyard Towers, was liquidated with a loss severity of 100%. CRED iQ identified 19 workouts classified as dispositions, liquidation, or discounted payoffs in April 2022. Of those 19 workouts, there were eight distressed assets that were resolved without a loss. One resolution – Portofino Inn & Suites – Anaheim CA — resulted in excess proceeds available to the trust after the REO asset was sold. The sales price for the asset, which was reportedly north of $62 million, was significantly greater than its total exposure, equal to the unpaid balance, servicer advances, and liquidation expenses. Loss severities for the month of April ranged from 4% to 100%, based on outstanding balances at disposition. Total realized losses in April represented a decline compared to March’s realized loss totals of approximately $84.4 million.
Courtyard Towers represents the largest loss, by total amount and severity, among all distressed workouts this month. For historical context, the loan, which was securitized in the FREMF 2018-KX03 transaction, incurred the largest individual loss for any Freddie K-Deal securitization to date. Prior to the workout of Courtyard Towers, there had been 13 resolutions of loans that resulted in realized losses to Freddie K-Deal securitizations. Courtyard Towers is a 175-unit assisted living facility located in Mesa, AZ. The property had been with the special servicer since October 2018. Several prior sale agreements fell out of contract and the property was ultimately sold for $4.85 million, which was significantly below the loan’s $15.5 million outstanding balance at disposition. After liquidation expenses and amounts due to the servicer, the result was a full loss for the loan.
The largest distressed loan, by balance at disposition, to be resolved was the $48.9 million Plaza At Harmon Meadow loan. The loan had transferred to special servicing in April 2020 due to maturity default. After nearly two years in special servicing, the loan was resolved without incurring a loss.
Excluding defeased loans, there was approximately $6.1 billion in securitized debt that was paid off or worked out in April, which was significantly higher than $3.3 billion in March 2022. In April, 10% of the loan resolutions were categorized as dispositions, liquidations, or discounted payoffs, which was in line with the prior month. An additional 13% of the loans paid off with prepayment penalties.
By property type, mixed-use had the highest total of outstanding debt paid off in April. The high volume of mixed-use payoffs was driven by the retirement of a $1.4 billion mortgage secured by Ala Moana — a mixed-use complex in Honolulu, HI comprising a super-regional mall and two office towers.
About CRED iQ
CRED iQ is a commercial real estate data, analytics, and valuation platform designed to unlock investment, financing, and leasing opportunities. CRED iQ provides real-time property, loan, tenant, ownership, and valuation data for over $2.0 trillion of commercial real estate.