
CRED iQ monitored trends in cumulative appraisal reduction amounts (ARAs) for the CMBS universe over the past year, gauging levels of distress and the prevalence of loan workouts and cures. An ARA is a mechanism that reduces the amount of servicer advances for distressed loans, usually secured by collateral with deteriorated valuations. An ARA is a high-level metric for monitoring the approximate level of distress in a CMBS pool and a key function in the management of the waterfall structure of a CMBS securitization. Additionally, the cumulative ARA for a particular deal, among other things, plays a role in determining changes in the controlling certificate holder of a deal and factors into thresholds for determining if a deal needs additional oversight in the form of an operating advisor. Monitoring the cumulative ARA for CMBS transactions can give broad insight into principal loss expectations; however, it is generally viewed that any given individual ARA for a loan is not an accurate predictor for realized losses at final resolution.
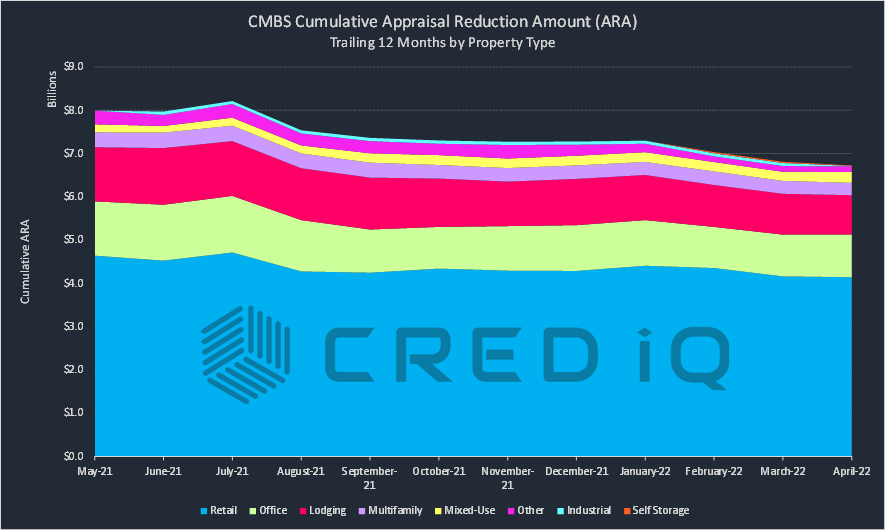
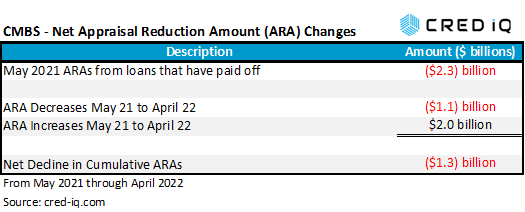
The cumulative amount of ARAs in CMBS securitizations trended down significantly over the past 12 months. Cumulative ARAs across conduit, SASB, CRE CLO, and Freddie K CMBS transactions were approximately $1.3 billion lower in April 2022 than in May 2021. The net decline is attributed to multiple factors: REO asset liquidations or loan dispositions, loan workouts, and property value recoveries (in less frequent instances). Conversely, ARA declines are offset by increases caused by property value declines and transfers to special servicing. ARAs totaling approximately $2.3 billion as of May 2021 were assigned to loans that were no longer active as of April 2022 – these loans were either liquidated, resolved, or paid off. There were ARA reductions totaling approximately $1.1 billion from May 2021 through April 2022. Reductions included loans that were worked out and returned to the master servicer, eliminating the servicer’s need to advance debt service and property protection expenses, as well as loans secured by collateral that exhibited recoveries in valuations.
Despite the net decline in ARA over the last year, there were over $2 billion in ARA increases which included loans with newly assigned ARAs and loans secured by properties with deteriorating valuations compared to 12 months prior. Overall, these three buckets — ARAs no longer active due to liquidations or payoffs, ARA increases on active loans, and ARA decreases on active loans — combined to produce the net $1.3 billion decline in cumulative ARAs from May 2021 to April 2022.
Retail properties accounted for 62% of cumulative ARAs in CMBS as of April 2022, which is the majority of appraisal reductions. Cumulative retail ARAs as of April totaled $4.1 billion with most of the total tied to regional malls with outsized debt balances. Office (15%) and lodging (14%) represented the next two highest concentrations of ARAs by property type, each accounting for just under $1 billion in appraisal reductions. While cumulative ARAs for both office and lodging loans have exhibited net declines compared to 12 months prior, the two property types have shown opposing trends over the past three months. Cumulative ARAs for lodging loans have declined in consecutive months since February 2022 while cumulative ARAs for office loans have risen for three consecutive months.
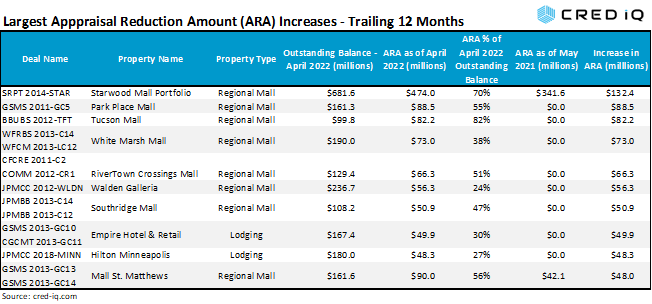
Circling back to regional malls, the retail subtype has been the source of headline risk for CMBS investors with significant variation in opinions on projected losses. Eight of the 10 largest increases in individual ARAs for active loans as of April 2022 compared to a year ago are secured by regional malls. Six of those loans did not have an ARA assigned as of May 2021. The largest individual increase in an ARA for a loan over the past 12 months was associated with the $681.6 million Starwood Mall Portfolio, which is secured by The Mall at Wellington Green (Wellington, FL), MacArthur Center (Norfolk, VA), Northlake Mall (Charlotte, NC), and The Mall at Partridge Creek (Clinton Township, MI). The ARA for the loan was $341.6 million as of May 2021 but ballooned to $474 million as of April 2022, equal to a $132.4 million increase or 39%.
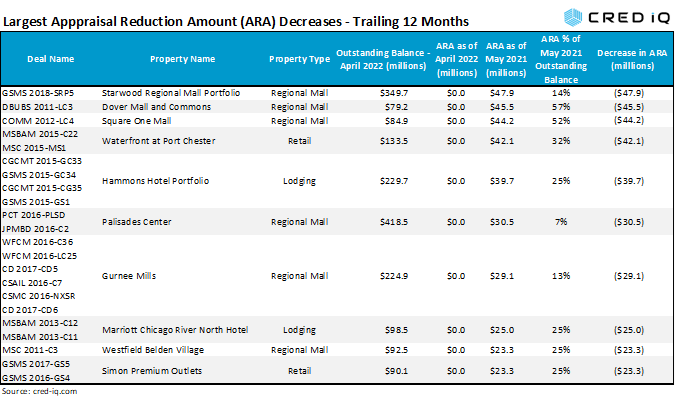
As of April 2022, six of the 10 largest decreases in individual ARAs for outstanding loans over the trailing 12 months were secured by regional malls. The ARAs for all six of these loans were reduced to zero after each loan was returned to the master servicer during the past 12 months. A return of a loan to the master servicer from special servicing is an action that allows an appraisal trigger event to no longer exist, which reduces ARA to zero. Also notable about the largest ARA declines from a year ago is that four of the loans had placeholder ARAs, equal to 25% of the loan balance. Placeholder ARAs are automatic calculations used to reduce servicer advances in the event a timely appraisal cannot be obtained, is determined to not be warranted, or has questionable assumptions in the view of the special servicer. Ironically, the loan with the largest individual ARA decline over the past 12 months is the Starwood Regional Mall Portfolio, similarly named as the loan with the highest ARA increase. This $513.2 million loan is secured by five regional malls – Plaza West Covina, Franklin Park Mall, Parkway Plaza, Capital Mall, and Great Northern Mall — see CRED iQ’s March 2022 Weekly Asset Review. The loan was in special servicing in May 2021 but returned to the master servicer in January 2022 and no longer carries an ARA. However, the absence of an ARA does not preclude an eventual realized loss for the loan. As stated above, an ARA, whether one even exists, and the size of it is generally not an accurate indicator of the final tally of a loan’s performance when it exits a CMBS pool.
About CRED iQ
CRED iQ is a commercial real estate data, analytics, and valuation platform designed to unlock investment, financing, and leasing opportunities. CRED iQ provides real-time property, loan, tenant, ownership, and valuation data for over $2.0 trillion of commercial real estate.
