
As the commercial real estate industry continues to adjust to a rising interest rate environment, CRED iQ examined the latest trends in defeasance activity. Reports of defeasance requests have trended higher in recent months. Generally, in a low-rate environment defeasance is an opportunity for borrowers to take advantage of refinancing existing debt at a comparatively lower rate. In the current environment of rising interest rates, borrowers are motivated by risk from the opportunity cost of waiting to refinance at maturity when rates could be significantly higher than current rates or the risk of not cashing out equity before a recessionary environment could adversely impact commercial real estate values.
Other factors to consider are rising US treasury yields compared to 2021. With higher US treasury yields, substituting real estate collateral for US treasuries or similar securities that match loan cash flows becomes more economical from a cost perspective. In addition to the cost of purchasing cash-flow-equivalent securities, defeasance costs also comprise additional fees which generally can include accounting fees, consulting fees, costs associated with a legal review or rating agency confirmation, custodial fees for the collateral securities, servicer processing costs, and costs associated with the successor borrower. As an example, Blue Diamond Crossing is a $46 million loan that defeased on February 10, 2022. The loan will be open for prepayment in December 2022 and has a maturity date of April 1, 2023, which was more than a year from the time of defeasance. The event was driven by the borrower securing a new refinancing package for the loan collateral, a 505,072-sf retail center in Las Vegas, NV. The borrower was able to take advantage of a lower cost of capital compared to loan origination in 2013 while also staying ahead of imminently higher interest rates. The total cost of defeasance was more than $48 million, approximately 5% higher than the outstanding balance of the loan at the time. The defeasance cost analysis for this particular transaction is detailed in the table below.
Overall, CRED iQ identified more than 6,000 loans — across CMBS conduit, SBLL, CRE CLO and Freddie K securitizations — with an outstanding balance greater than $65 billion that were defeased as of March 2022. Defeasance activity during Q1 2022 totaled $5.6 billion across more than 350 loans. For each month in Q1 2022, defeasance activity was higher year over year than in 2021. The largest difference was in February 2022, when defeasance activity was nearly 4x higher than the February 2021 total, based on outstanding balance. Most recently in March 2022, the average time to maturity for loans that defeased was approximately 3.5 years. Extending the view historically, time to maturity generally averaged from three to four years for loans that defeased during 2021 and through Q1 2022.
Multifamily was the property type most commonly associated with defeasance by a wide margin, accounting for greater than 60% of all properties that were substituted. However, this figure was inclusive of Freddie K securitizations. Isolating defeasance activity to conduit and SBLL transactions (CRE CLO defeasance was nominal), multifamily was still the property type most commonly associated with defeasance with 25% of activity by outstanding balance. Office was close behind, accounting for 24% of outstanding defeased loans by unpaid balance. Unsurprisingly, loans secured by lodging collateral were least commonly defeased given headwinds faced by the industry during the pandemic. Loans previously secured by lodging collateral accounted for 5% of all defeased loans
Recent observations of client defeasance calculator usage (integrated and powered by Waterstone Defeasance) show a surge in activity. The increase in defeasance appetite across CRED iQ users is expected to remain elevated over the near to intermediate term. According to George Rodriguez, principal at Waterstone Defeasance:
“Defeasance activity continues to spike up due to the Fed taking action to combat inflation, with rate increases of 75 bps and another 100 bps or more waiting in the wings over the next two quarters. Borrowers are now actively reviewing their exit strategies, selling or refinancing to extract the equity in their real estate holdings as well as locking in current rates now vs refinancing at a higher rate as they near their loan maturities.
Defeasance advisors and servicers are having a busy spring and we are forecasting more of the same through the summer. Where the Fed lands over the next several months on rate hikes to battle inflation, may start to impact real estate valuations and higher cap rates. We are starting to see the lenders tapping their breaks on securitizations as the Fed tries for a soft landing as bond buyers watch cautiously.”
About CRED iQ
CRED iQ is a commercial real estate data, analytics, and valuation platform providing actionable intelligence to CRE and capital markets investors. Subscribers to CRED iQ use the platform to identify valuable leads for leasing, lending, refinancing, distressed debt, and acquisition opportunities. Our data platform is powered by over $2.0 trillion of CMBS, CRE CLO, SBLL, Ginnie Mae, FHA/HUD, and Agency loan and property data.
This week, CRED iQ calculated updated valuations for three multifamily properties that secure delinquent GNMA loans. Although Ginnie Mae loans have mortgage insurance from the FHA as well as a timely payment guarantee, delinquent Ginnie Mae loans can still lead to foreclosure that can provide opportunities for distressed investors looking to step in and inject additional capital or create value-add plans by improving operations. Mortgage originators, distressed investors, and commercial brokers can search CRED iQ’s database of approximately 15,000 Ginnie Mae loans totaling more than $138 billion in outstanding debt for their next deal. The properties featured in this week’s WAR Report secure a subset of select Ginnie Mae loans that are at least 30 days delinquent. The highlighted loans are all secured by senior housing collateral, including a skilled nursing facility (SNF) in Plainsboro, NJ near Princeton Medical Center.
CRED iQ valuations factor in base-case (Most Likely), downside (significant loss of tenants), and dark scenarios (100% vacant). For full access to the valuation reports as well as full CMBS and GNMA loan reporting, including detailed financials and borrower contact information, sign up for a free trial here.
This $26.5 million loan, which is over 60 days delinquent, is secured by a 200-bed skilled nursing facility in Plainsboro, NJ, located across the street from Princeton Hospital and the adjacent medical center. The mortgage backs a Ginnie Mae project loan pool and was originated by KeyBank in September 2015. The FHA-insured mortgage was issued through the Department of Housing and Urban Development’s (HUD) 232 program for nursing homes and assisted-living facilities pursuant to Section 223(f) for the acquisition or refinancing of existing mortgages. The loan has an interest rate of 3.54% and a 35-year term with a maturity date in October 2050. Call protection is in the form of 0/10 — no lockout and a 10-year declining prepayment penalty, which is estimated to be 3% of the outstanding balance as of 2022.
Merwick Care & Rehabilitation has 200 beds across 128 units and participates in both Medicare and Medicaid. The skilled nursing facility averages approximately 155 residents per day. The property last had a health inspection in December 2021 and 11 health citations were reported, which is higher than the national average and significantly higher than the average for the state of New Jersey. COVID vaccination rates for residents are in line with the national average of 87%. Despite the reported delinquency, the property is strategically located next to a well-established medical center and has several amenities including, a 3,500-sf gym, on-site dialysis, and advanced rehabilitation equipment. For the full valuation report and loan-level details, click here.
97 units, Assisted Living Facility, Bedford, NH [View Details]
GNMA 2016-36195NBG2
This $14.2 million loan, which is over 90 days delinquent, is secured by a 97-unit senior housing facility in Bedford, NH, approximately 55 miles northwest of Boston, MA. Similar to Merwick Care & Rehabilitation, the mortgage loan was endorsed for insurance under Section 232 pursuant to Section 223(f), facilitating financing for nursing homes and assisted-living facilities. Orix Real Estate Capital originated the loan in February 2014 with an original balance of $15.5 million. The fully amortizing loan has a term of 35 years and an interest rate of 3.95%. Prepayment terms include a zero-year lockout and a 10-year declining penalty starting at 10%. Specifically, the loan was five months delinquent as of April 2022 but servicer data indicates the loan has been modified. As for the collateral property, Bentley Commons at Bedford offers one-bedroom and two-bedroom configurations with health services that include hospice care and physical therapy. Minimal COVID cases were reported at the property as of February 2022, but the facility had over 20 confirmed cases a year prior in February 2021. For the full valuation report and loan-level details, click here.
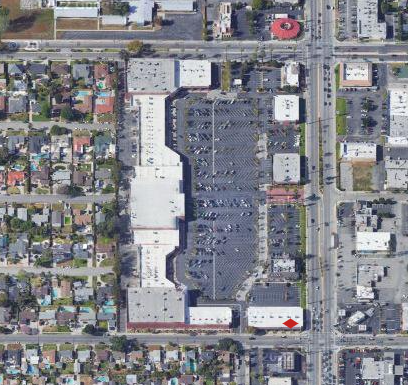
312 units, Assisted Living Facility, Andover, KS [View Details]
GNMA 2020-3617QSPH5
This $13.8 million loan is over 90 days delinquent and is secured by a 312-unit senior housing facility in Andover, KS, approximately 12 miles outside of Wichita. The mortgage backs a Ginnie Mae project loan pool and was originated by Dwight Capital in March 2020. The loan was five months delinquent as of April 2022. The loan falls under both Section 232 and Section 223(f) of FHA’s mortgage insurance program. The loan is fully amortizing throughout its 35-year term and has an interest rate of 3.75%. Prepayment terms are 2/8 — a two-year lockout ending December 2022 followed by an eight-year declining prepayment penalty period starting at 8%. Servicer data indicates the loan has been modified. The property neighbors a management-affiliated skilled nursing facility (SNF), which does not serve as collateral for the mortgage. The adjacent SNF rates poorly on several metrics including health citations and vaccinations rates. Poor management may be a shared attribute contributing to the delinquency at Watercrest at Victoria Falls. For the full valuation report and loan-level details, click here.
CRED iQ is a commercial real estate data, analytics, and valuation platform providing actionable intelligence to CRE and capital markets investors. Subscribers to CRED iQ use the platform to identify valuable leads for leasing, lending, refinancing, distressed debt, and acquisition opportunities. Our data platform is powered by over $2.0 trillion of CMBS, CRE CLO, SBLL, Ginnie Mae, FHA/HUD, and Agency loan and property data.
This week, CRED iQ reviewed the commercial real estate lending landscape and highlighted five properties that secured financing in April 2022. The highlighted loan originations feature five different property types — mixed-use, industrial, retail, lodging and self-storage. The largest featured recent origination is secured by a mixed-use property located in the Los Angeles MSA.
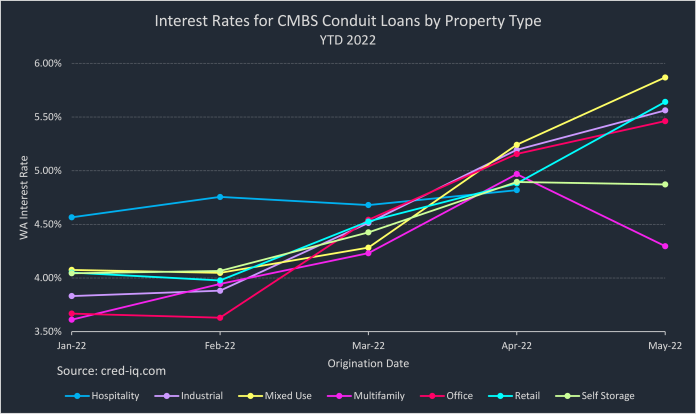
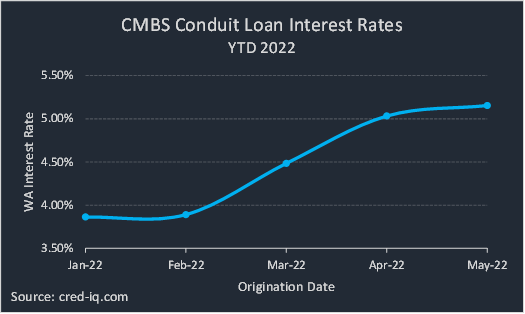
Using the CRED iQ platform’s Comps functionality, which features propriety Comps scoring for the CRE loan universe, we compared lending terms and loan structures to get a sense of the trends in the CRE lending environment. The impacts of a rising rate environment this month as most new originations have comparatively higher interest rates then their most relevant comps.
CRED iQ additionally provided valuations for each asset to evaluate leverage levels in relation to originators’ LTVs. The CRED iQ valuations factor in base-case (most likely), downside (significant loss of tenants), and dark scenarios (100% vacant). Base-case valuations for select properties are provided below. For access to the valuation reports as well as full CMBS loan reporting, including detailed financials, updated tenant information, and borrower contact information, sign up for a free trial here.
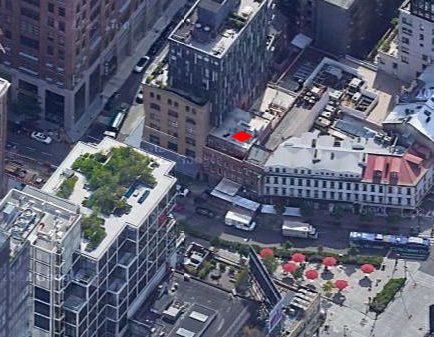
806,960 sf, Mixed Use (Office/Retail), Los Angeles, CA
A $150 million loan was originated by Deutsche Bank on April 13, 2022 to refinance existing debt on The Reef, a mixed-use property in Los Angeles, CA. The interest-only loan had a 10-year term and was structured with an interest rate of 5.425%. The loan will be locked out from prepayment for two years, and defeasance will be permitted after lockout through the remainder of the loan term until its open period, five months prior to maturity.
Using CRED iQ’s Comps functionality, one of the most comparable originations is a loan secured by the Pershing Square Building, a 153,381-sf mixed-use building located approximately 1.5 miles north on South Hill Street. The interest-only loan has a balance of $44 million and was originated in May 2017. The comparable loan’s interest rate was 4.64%, which is 79 bps lower than the new origination for The Reef.
The Reef is a 12-story mixed-use building in Downtown Los Angeles that contains office and retail showroom space. Most notable about the building is the property’s LED signage, which covers three sides of the building’s top floors and totals approximately 41,000 sf. The LED signage is positioned strategically for view by vehicular traffic on I-10 (Santa Monica Freeway) and I-110 (Harbor Freeway). The LED signage is licensed to a third-party operator that shares 75% of the net profit with the borrower, paying a minimum license fee of approximately $2.7 million per year. Based on the originator’s underwritten financial statements, LED signage accounted for 40% of the property’s effective gross income. The high concentration of income from LED signage, which can fluctuate based on contracted amounts to the third-party operator, presents credit risks from potential disruptions of the effectiveness of the LED advertisements. Temporary limitations to visibility, obstructions of view, or loss of power are all events that could result in lower income from the building’s LED signage. The building’s office space was 78% leased as of February 2022.
The property was appraised at a value of $349 million ($432/sf) as of November 11, 2021. The appraisal resulted in an LTV of 43%, and an implied cap rate of 5.53% based on the originator’s underwritten NCF. The debt yield came in at 12.9%, also based on NCF from the originator’s underwriting. For the full valuation report and loan-level details, click here.
Subject Property
Name
The Reef
Address
1933 South Broadway Los Angeles, CA 19017
Property Type
Mixed Use
Property Subtype
Office/LED Signage/Retail
Property Size
806,960 sf
Year Built
1958
Submarket
Downtown Los Angeles
County
Los Angeles
MSA
Los Angeles-Long Beach-Santa Ana, CA
Origination Date
4/13/2022
Loan Amount
$150,000,000
Interest Rate
5.425%
Debt Yield (UW NCF)
12.86%
Valuation
Appraised Value
$349,000,000 ($432/sf)
Appraisal Date
11/11/2021
Appraisal LTV
43.0%
CRED iQ Base-Case Value
$296,000,000 ($367/sf)
1600 Brittmoore
110,231 sf, Industrial, Houston TX
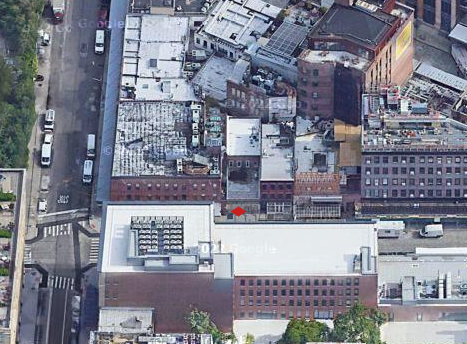
JP Morgan funded a $9.5 million mortgage on April 14, 2022 to refinance existing debt on an industrial property located in Houston, TX. The 10-year loan was structured with interest-only payments for three years followed by amortizing payments based on a 30-year schedule. The interest rate for the mortgage was 5.607%. Prepayment provisions for the loan include a two-year lockout period until defeasance is permitted. CRED iQ’s highest scoring loan comp is Brittmoore Industrial Park, a $4.8 million loan that was originated in August 2017. The loan is secured by a 72,000-sf multi-tenant industrial property located along Brittmoore Road, about a mile away. The comparable loan had an interest rate of 4.49%, which is significantly lower than the new origination. Key differences include the comparably higher risk profile of 1600 Brittmoore, which is a single tenant property.
The 1600 Brittmoore property comprises multiple flex industrial buildings, which are all leased to single tenant, Us Living. The tenant, which operates in the real estate development space, is also the loan sponsor but still leases space at the property pursuant to an agreement that expires in April 2037. The property was appraised for $17.4 million ($158/sf) as of March 9, 2022, which resulted in an LTV of 55%. The originator’s underwritten NCF implied a cap rate of 4.82% and a debt yield of 8.8%. For the full valuation report and loan-level details, click here.
Subject Property
Name
1600 Brittmoore
Address
1600 Brittmoore Road Houston, TX 77043
Property Type
Industrial
Property Subtype
Flex
Property Size
110,231 sf
Year Built
1981
Submarket
Northwest
County
Harris
MSA
Houston-Sugar Land-Baytown, TX
Origination Date
4/14/2022
Loan Amount
$9,500,000
Interest Rate
5.607%
Debt Yield (UW NCF)
8.83%
Valuation
Appraised Value
$17,400,000 ($158/sf)
Appraisal Date
3/9/2022
Appraisal LTV
54.6%
CRED iQ Base-Case Value
$16,570,000 ($150/sf)
Harundale Plaza
77,327 sf, Retail, Glen Burnie, MD
Time Equities secured $9.25 million in mortgage debt from Morgan Stanley on April 1, 2022 to acquire Harundale Plaza, a retail center in Glen Burnie, MD, located approximately 11 miles south of Baltimore. The property was sold by SITE Centers for $16.4 million. The 10-year loan is structured with interest-only debt service payments and an interest rate of 4.2%. The loan will be locked out from prepayment for about two years, and defeasance will be permitted after lockout through the remainder of the loan term until its open period, four months prior to maturity. One of CRED iQ’s highly rated comparable loans for the new origination is Mitchellville Plaza, a $25.2 million mortgage that was originated in January 2020. The loan had an interest rate of 3.55%, which was 65 bps lower than the new origination. Mitchellville Plaza, anchored by Weis Market, is located approximately 25 miles away from Harundale Plaza and is within the Washington, DC MSA.
Harundale Plaza totals 217,619 sf in size, but approximately 139,000 sf is freely releasable from the mortgage loan without prepayment, leaving only 77,327 sf encumbered by the mortgage. The collateral is anchored by Lidl pursuant to a lease that expires in January 2031, which is 15 months prior to loan maturity. The grocer accounts for 41% of the property’s NRA. The collateral was appraised for $13.8 million ($178/sf) on February 10, 2022, resulting in an LTV of 67%. The implied cap rate based on the originator’s underwritten NCF was 7.45% and the debt yield was equal to 11.1% based on the same metrics. For the full valuation report and loan-level details, click here.
Subject Property
Name
Harundale Plaza
Address
7440 Ritchie Highway Glen Burnie, MD 21061
Property Type
Retail
Property Subtype
Anchored
Property Size
77,327 sf
Year Built
1999
Submarket
Route 2/3
County
Anne Arundel
MSA
Baltimore-Towson, MD MSA
Origination Date
4/1/2022
Loan Amount
$9,250,000
Interest Rate
4.20%
Debt Yield (UW NCF)
12.86%
Valuation
Appraised Value
$13,800,000 ($178/sf)
Appraisal Date
2/10/2022
Appraisal LTV
67.0%
CRED iQ Base-Case Value
$13,800,000 ($178/sf)
Holiday Inn Express and Suites Uniontown
90 keys, Limited-Service Hotel, Uniontown, PA
A $5.75 million loan was originated by Deutsche Bank on April 8, 2022 to refinance existing debt on a limited-service hotel in Uniontown, PA, located approximately 45 miles south of Pittsburgh, PA. The 10-year loan has an interest rate of 5.67% and was structured with amortizing debt service payments based on a 30-year schedule. Due to the tertiary location of the collateral property, the number of high scoring loan comps was limited. Notably, the three highest rated comps for the new origination were all distressed as of April 2022, including two loans secured by hotels in Morgantown, WV, located approximately 20 miles away from Uniontown, PA.
The collateral property has 90 rooms and operates as a Holiday Inn and Express Suites under a franchise agreement with IHG until May 2036. The hotel averaged 75% occupancy for the trailing 12 months ended February 2022. During that period, the ADR was $89 and RevPAR was $67. The property was appraised for $8.7 million ($96,667/key) as of December 1, 2021, which resulted in an LTV of 66%. Based on the originator’s underwritten NCF, the implied cap rate was 10.57% and the debt yield was 16.0%. For the full valuation report and loan-level details, click here.
Subject Property
Name
Holiday Inn Express & Suites Uniontown
Address
305 Mary Higginson Lane Uniontown, PA 15401
Property Type
Hotel
Property Subtype
Limited Service
Property Size
90 keys
Year Built
2016
Submarket
Non-Metro Pennsylvania
County
Fayette
MSA
Pittsburgh, PA
Origination Date
4/8/2022
Loan Amount
$5,755,000
Interest Rate
5.670%
Debt Yield (UW NCF)
15.98%
Valuation
Appraised Value
$8,700,000 ($96,667/key)
Appraisal Date
12/1/2021
Appraisal LTV
66.1%
CRED iQ Base-Case Value
$8,239,000 ($91,548/key)
Stafford Self Storage
36,900, Self-Storage, Stafford Springs, CT
Wells Fargo originated a $2.8 million loan on April 5, 2022 to refinance existing debt on a self-storage property in Stafford Springs, CT, located approximately 26 miles outside of Hartford. The 10-year loan amortizes based on a 30-year schedule and has an interest rate of 4.672%. The loan will be locked out from prepayment for about two years, and defeasance will be permitted after lockout through the remainder of the loan term until its open period, seven months prior to maturity. CRED iQ’s highest scoring comp was Prime Storage Boston Road, which was part of an 11-property portfolio that secured a $61 million loan. The loan was originated in May 2015 and had an interest rate of 4.71%. The loan defeased in July 2021.
Stafford Self Storage contains 334 units ranging from 5’ x 5’ to 10’ x 30’. The property was appraised at a value of $4.35 million ($118/sf) as of February 21, 2022. The appraisal resulted in an LTV of 64%, and an implied cap rate of 8.07% based on the originator’s underwritten NCF. The debt yield came in at 12.6%, also based on NCF from the originator’s underwriting. For the full valuation report and loan-level details, click here.
Subject Property
Name
Stafford Self Storage
Address
40 West Stafford Road Stafford Springs, CT 06076
Property Type
Self Storage
Property Size
36,900 sf
Year Built
1989
Submarket
Hartford
County
Tolland
MSA
Hartford, CT
Origination Date
4/5/2022
Loan Amount
$2,800,000
Interest Rate
4.67%
Debt Yield (UW NCF)
12.54%
Valuation
Appraised Value
$4,350,000 ($118/sf)
Appraisal Date
2/21/2022
Appraisal LTV
64.4%
CRED iQ Base-Case Value
$3,998,000 ($108/sf)
For full access to our loan database and valuation platform, sign up for a free trial below:
CRED iQ is a commercial real estate data, analytics, and valuation platform providing actionable intelligence to CRE and capital markets investors. Subscribers to CRED iQ use the platform to identify valuable leads for leasing, lending, refinancing, distressed debt, and acquisition opportunities. Our data platform is powered by over $2.0 trillion of CMBS, CRE CLO, SBLL, Ginnie Mae, FHA/HUD, and Agency loan and property data.
CMBS conduit transactions incurred approximately $60 million in realized losses during April 2022 through the workout of distressed assets. Additionally, a $15.5 mortgage securitized in a Freddie K-Deal securitization, Courtyard Towers, was liquidated with a loss severity of 100%. CRED iQ identified 19 workouts classified as dispositions, liquidation, or discounted payoffs in April 2022. Of those 19 workouts, there were eight distressed assets that were resolved without a loss. One resolution – Portofino Inn & Suites – Anaheim CA — resulted in excess proceeds available to the trust after the REO asset was sold. The sales price for the asset, which was reportedly north of $62 million, was significantly greater than its total exposure, equal to the unpaid balance, servicer advances, and liquidation expenses. Loss severities for the month of April ranged from 4% to 100%, based on outstanding balances at disposition. Total realized losses in April represented a decline compared to March’s realized loss totals of approximately $84.4 million.
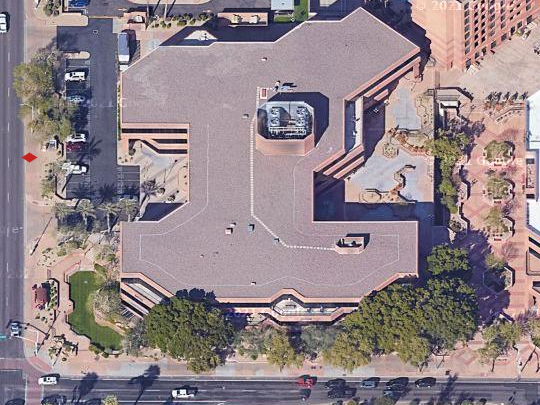
Courtyard Towers represents the largest loss, by total amount and severity, among all distressed workouts this month. For historical context, the loan, which was securitized in the FREMF 2018-KX03 transaction, incurred the largest individual loss for any Freddie K-Deal securitization to date. Prior to the workout of Courtyard Towers, there had been 13 resolutions of loans that resulted in realized losses to Freddie K-Deal securitizations. Courtyard Towers is a 175-unit assisted living facility located in Mesa, AZ. The property had been with the special servicer since October 2018. Several prior sale agreements fell out of contract and the property was ultimately sold for $4.85 million, which was significantly below the loan’s $15.5 million outstanding balance at disposition. After liquidation expenses and amounts due to the servicer, the result was a full loss for the loan.
The largest distressed loan, by balance at disposition, to be resolved was the $48.9 million Plaza At Harmon Meadow loan. The loan had transferred to special servicing in April 2020 due to maturity default. After nearly two years in special servicing, the loan was resolved without incurring a loss.
Excluding defeased loans, there was approximately $6.1 billion in securitized debt that was paid off or worked out in April, which was significantly higher than $3.3 billion in March 2022. In April, 10% of the loan resolutions were categorized as dispositions, liquidations, or discounted payoffs, which was in line with the prior month. An additional 13% of the loans paid off with prepayment penalties.
By property type, mixed-use had the highest total of outstanding debt paid off in April. The high volume of mixed-use payoffs was driven by the retirement of a $1.4 billion mortgage secured by Ala Moana — a mixed-use complex in Honolulu, HI comprising a super-regional mall and two office towers.
About CRED iQ
CRED iQ is a commercial real estate data, analytics, and valuation platform designed to unlock investment, financing, and leasing opportunities. CRED iQ provides real-time property, loan, tenant, ownership, and valuation data for over $2.0 trillion of commercial real estate.
In this week’s WAR Report, CRED iQ calculated real-time valuations for five distressed properties that have transferred to special servicing in March and April 2022. Featured properties include a student housing complex serving the University of Akron as well as multiple office properties in the Hartford, Philadelphia and Chicago MSAs. CRED iQ’s special servicing rate for office loans increased to 3.73% in April 2022, moving inversely compared to the overall special servicing rate for all property types. Three of the five office properties highlighted this week were suburban office campuses — all with notable occupancy issues.
CRED iQ valuations factor in a base-case (most likely), a downside (significant loss of tenants), and dark scenarios (100% vacant). For full access to the valuation reports as well as full CMBS loan reporting, including detailed financials, updated tenant information, and borrower contact information, sign up for a free trial here.
This $34.9 million loan transferred to special servicing on March 11, 2022 due to imminent monetary default. The collateral property, University Edge, was impacted by the pandemic, resulting in a below breakeven DSCR for the loan during 2020 and through the nine-month period ended September 2021. The loan was current in payment as of April 2022, but workout negotiations have been initiated between the borrower and Midland Loan Services, acting as special servicer.
Historically, the August 2020 distressed workout of 22 Exchange is a notable comparison to University Edge for a potential range of outcomes. 22 Exchange was a 471-bed student housing property located about a half mile away from University Edge. The property became REO in December 2018 and was sold in August 2020 for approximately $12.5 million, equal to $26,539 per bed or $88,028 per unit. The new owner converted the property to traditional multifamily use after acquisition.
University Edge is a 148-unit student housing facility located adjacent to the University of Akron. The property contains 578 beds and 18,380 sf of ground-floor retail, which is primarily leased to food service tenants. Occupancy has slumped since the onset of the pandemic with remote learning opportunities allowing enrolled students more flexibility in housing location farther away from campus. The student housing portion of the property was approximately 84% occupied as of September 2021. Servicer commentary indicated the property was 54% pre-leased for the Fall 2022 semester. For the full valuation report and loan-level details, click here.
This $25.6 million loan transferred to special servicing on March 7, 2022 due to non-compliance with cash management provisions. The mortgage has multiple cash management triggers tied to tenant events, including a trigger connected to the collateral property’s 5th largest tenant — the US Department of Housing and Urban Development (HUD). HUD occupies 6% of the collateral property’s NRA pursuant to a lease that expires in October 2022. A cash trap was structured to take effect nine months prior to lease expiration if a renewal has not been signed. Concurrent with the loan’s transfer to special servicer, debt service payments were 30 days delinquent.
The loan is secured by the Stilts Building, a 23-story office tower in the CBD of Hartford, CT. The property was 79% occupied as of year-end 2021, which was a decline compared to 87% in 2020 but not too far off from the occupancy level of 82% in 2012 prior to loan origination. The property has concentrated near-term lease rollover risk with 35% of the property’s NRA expiring in the next 24 months. The elevated lease rollover risk and cash management issues may present complications for the loan’s impending maturity date in April 2023. For the full valuation report and loan-level details, click here.
201,167 sf, Suburban Office, Wilmington, DE [View Details]
This $24.6 million loan transferred to special servicing on March 15, 2022. The reason for the transfer was not specified at the time of writing. However, the collateral property’s largest tenant, DuPont Capital Management, failed to renew its lease within 12 months of expiration, which triggered a cash trap. DuPont Capital Management occupies 53,227 sf at 1 Righter Parkway, equal to 27% of the office complex’s aggregate NRA, pursuant to a lease that expires in December 2022. The tenant has two, five-year extension options available.
The loan is secured by a leasehold interest in two, three-story office buildings located in the suburbs of Wilmington, DE. Each building — 1 Righter Parkway and 2 Righter Parkway —is subject to individual ground leases that expire in 2046 and 2048, respectively. The ground leases reset every five years with CPI increases. The two office buildings were 96% occupied as of year-end 2021. Occupancy has the potential to decline to approximately 69% should DuPont Capital Management vacate at lease expiration. For the full valuation report and loan-level details, click here.
311,772 sf, Suburban Office, Oak Brook, IL [View Details]
This $19.9 million loan transferred to special servicing on April 1, 2022 due to delinquency. The loan became 60 days delinquent in April 2022. The collateral property’s largest tenant, Sanford LP, had a lease expiration in December 2021. Servicer commentary indicated the tenant, which occupied 39% of the collateral property’s NRA, was looking to downsize its space. The tenant’s search for a smaller office footprint included other properties in the local market.
Oak Brook Office Center is a four-building suburban office park located approximately 20 miles west of Chicago, IL. Sanford LP’s lease was for the entirety of the building located at 2707 Butterfield Road. Occupancy across all four buildings in the office park was 75% as of year-end 2021. Any reduction in space or departure by Sanford LP will likely lead to a below breakeven DSCR for the loan if the vacant space is not backfilled in a timely matter. For the full valuation report and loan-level details, click here.
198,946 sf, Suburban Office, Albany, NY [View Details]
This $11.1 million loan transferred to special servicing on April 7, 2022 due to imminent monetary default. Servicer commentary for the loan stated the borrower had requested COVID-related relief but credit issues appear to be more sustained than implied by a temporary relief request. The loan is secured by West Mall Office Park, a three-building office park located in Albany, NY. Occupancy across all three buildings was 71% as of June 2021 and one of the buildings appears to be vacant. The property’s former largest tenant, for-profit college operator Midred Elley, reduced its footprint at the office park in 2019 from 28% of the aggregate NRA to 19%. Despite the transfer to special servicing, the loan was current in payment as of April 2022. For the full valuation report and loan-level details, click here.
CRED iQ is a commercial real estate data, analytics, and valuation platform providing actionable intelligence to CRE and capital markets investors. Subscribers to CRED iQ use the platform to identify valuable leads for leasing, lending, refinancing, distressed debt, and acquisition opportunities. Our data platform is powered by over $2.0 trillion of CMBS, CRE CLO, SBLL, Ginnie Mae, FHA/HUD, and Freddie Mac loan and property data.
CRED iQ monitors distressed rates and market performance for nearly 400 MSAs across the United States, covering over $900 billion in outstanding commercial real estate (CRE) debt. Distressed rates (DQ + SS%) include loans that are specially serviced, delinquent, or a combination of both. Distressed rates and month-over-month changes are presented below for the 50 largest MSAs, including distressed rates that are stratified by property type/sector, resulting in a granular view of distress by market-sector.
Distressed figures include all properties listed as 30 day delinquent or worse, as well as specially serviced loans within the securitized universe including Conduit, Agency, SBLL, and CRE CLO.
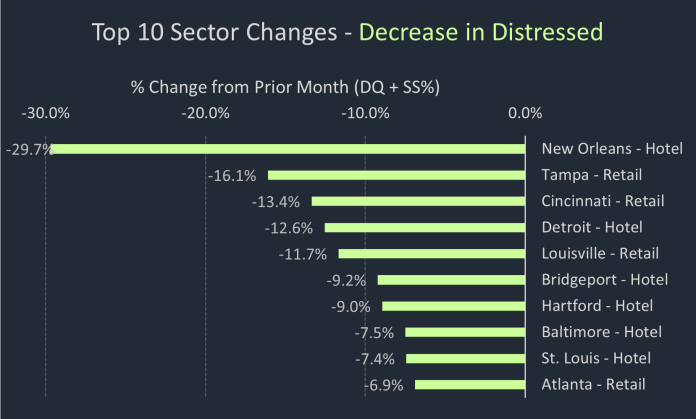
The majority of Top 50 MSAs exhibited an improvement in the overall rate of distressed commercial mortgages in April 2022. There were approximately 36 markets, or 72% of the Top 50, with month-over-month declines in the percentage of distressed CRE loans. Among the MSAs with the sharpest declines this month were Memphis and Birmingham, AL. By property type, much of the improvement was attributed to the lodging sector. Loans secured by lodging properties accounted for nine of the 10 largest declines in distress by market-sector, including Birmingham, AL, Philadelphia, and Detroit.
Conversely, the Baltimore market had the highest increase in distressed CRE loans compared to the prior month. The increase was primarily driven by a 30-day delinquency from a loan secured by Chatham Gardens Apartments, a 414-unit multifamily property located in Ellicott City, MD.
Office was the most prevalent property type among increases in distress by market-sector, accounting for four of the Top 10 increases in distress. The Hartford office market experienced the highest month-over-month increase in distress. A $25.6 million mortgage secured by the Stilts Building at 20 Church Street transferred to special servicing in March 2022. The Atlanta office market was also among the Top 10 market-sectors to show a higher month-over-month rate of distress. A major contributor to Atlanta’s office distress is a $115.3 million mortgage secured by the Peachtree Center, which transferred to special servicing ahead of its April 2022 maturity date. Peachtree Center is a seven-building office complex located in the CBD of Atlanta. Reported occupancy across the seven buildings was 61% as of September 2021. The loan’s initial maturity date was in April 2022, but the borrower has a 12-month extension option.
Distressed rates for the industrial sector exhibited notable increases in multiple markets this month due to delinquencies and transfers to special servicing. In one example, the $26.1 million FMC Technologies loan transferred to special servicing. The FMC Technologies loan was last featured in CRED iQ’s November 30, 2021 Weekly Asset Review, which detailed the implications of single tenant TechnipFMC’s lease expiration on March 31, 2022. The loan’s transfer to special servicing adversely impacted the distressed rate for Houston industrial properties. The distressed rate for industrial properties in the New York City MSA was also adversely impacted this month — the $51.2 million Supor Industrial Portfolio loan, secured by a portfolio of properties in Harrison, NJ, became 30 days delinquent in April 2022.
The Minneapolis MSA has the highest overall distressed rate at 22.3%, which was a slight decline compared to the prior month. Louisville (17.4%), New Orleans (13.3%), Milwaukee (11.0%), and Cleveland (9.5%) comprise the remaining markets with the highest rates of distress. After a one-month hiatus, the Cleveland MSA re-entered the Top 5 markets with CRE distress. The Sacramento market (0.43%) had the lowest percentage of distress among the Top 50 MSAs, supplanting the Raleigh MSA, which held the distinction previously.
Riverside – Riverside-San Bernardino-Ontario, CA MSA
$274.0
3.1%
-0.2%
Riverside – Hotel
$64.8
23.1%
-2.7%
Riverside – Industrial
$0.0
0.0%
0.0%
Riverside – Multifamily
$08.1
0.2%
0.0%
Riverside – Office
$0.0
0.0%
0.0%
Riverside – Other
$0.0
0.0%
0.0%
Riverside – Retail
$201.0
9.7%
-0.7%
Riverside – Self Storage
$0.0
0.0%
0.0%
Sacramento – Sacramento-Arden-Arcade-Roseville, CA MSA
$25.4
0.4%
-0.6%
Sacramento – Hotel
$05.7
1.6%
-9.3%
Sacramento – Industrial
$0.0
0.0%
0.0%
Sacramento – Multifamily
$0.0
0.0%
0.0%
Sacramento – Office
$06.1
0.8%
0.0%
Sacramento – Other
$0.0
0.0%
0.0%
Sacramento – Retail
$13.6
1.7%
0.0%
Sacramento – Self Storage
$0.0
0.0%
0.0%
Salt Lake City – Salt Lake City, UT MSA
$46.8
1.3%
0.0%
Salt Lake City – Hotel
$46.8
16.6%
-0.3%
Salt Lake City – Industrial
$0.0
0.0%
0.0%
Salt Lake City – Multifamily
$0.0
0.0%
0.0%
Salt Lake City – Office
$0.0
0.0%
0.0%
Salt Lake City – Other
$0.0
0.0%
0.0%
Salt Lake City – Retail
$0.0
0.0%
0.0%
Salt Lake City – Self Storage
$0.0
0.0%
0.0%
San Antonio – San Antonio, TX MSA
$142.9
2.2%
0.1%
San Antonio – Hotel
$08.4
3.1%
0.8%
San Antonio – Industrial
$01.4
0.8%
0.8%
San Antonio – Multifamily
$08.0
0.2%
0.2%
San Antonio – Office
$0.0
0.0%
0.0%
San Antonio – Other
$0.0
0.0%
0.0%
San Antonio – Retail
$125.1
14.0%
-0.1%
San Antonio – Self Storage
$0.0
0.0%
0.0%
San Diego – San Diego-Carlsbad-San Marcos, CA MSA
$87.9
0.7%
-0.3%
San Diego – Hotel
$61.7
3.1%
-0.8%
San Diego – Industrial
$0.0
0.0%
0.0%
San Diego – Multifamily
$01.4
0.0%
-0.2%
San Diego – Office
$0.0
0.0%
0.0%
San Diego – Other
$20.5
2.9%
-0.1%
San Diego – Retail
$04.3
0.4%
0.0%
San Diego – Self Storage
$0.0
0.0%
0.0%
San Francisco – San Francisco-Oakland-Fremont, CA MSA
$169.8
0.7%
-0.9%
San Francisco – Hotel
$62.8
2.8%
-4.5%
San Francisco – Industrial
$0.0
0.0%
0.0%
San Francisco – Multifamily
$20.8
0.3%
0.0%
San Francisco – Office
$0.0
0.0%
-1.1%
San Francisco – Other
$38.6
2.2%
0.0%
San Francisco – Retail
$47.6
4.1%
0.1%
San Francisco – Self Storage
$0.0
0.0%
0.0%
San Jose – San Jose-Sunnyvale-Santa Clara, CA MSA
$135.7
1.0%
0.0%
San Jose – Hotel
$121.0
5.8%
0.0%
San Jose – Industrial
$0.0
0.0%
0.0%
San Jose – Multifamily
$0.0
0.0%
0.0%
San Jose – Office
$14.7
0.2%
0.0%
San Jose – Other
$0.0
0.0%
0.0%
San Jose – Retail
$0.0
0.0%
0.0%
San Jose – Self Storage
$0.0
0.0%
0.0%
Seattle – Seattle-Tacoma-Bellevue, WA MSA
$76.2
0.4%
-0.2%
Seattle – Hotel
$71.8
5.9%
-2.4%
Seattle – Industrial
$0.0
0.0%
0.0%
Seattle – Multifamily
$04.3
0.1%
0.0%
Seattle – Office
$0.0
0.0%
0.0%
Seattle – Other
$0.0
0.0%
0.0%
Seattle – Retail
$0.0
0.0%
0.0%
Seattle – Self Storage
$0.0
0.0%
0.0%
St. Louis – St. Louis, MO-IL MSA
$376.4
9.0%
-0.7%
St. Louis – Hotel
$42.2
15.7%
-5.0%
St. Louis – Industrial
$0.0
0.0%
0.0%
St. Louis – Multifamily
$07.7
0.5%
-1.0%
St. Louis – Office
$108.9
20.1%
0.9%
St. Louis – Other
$23.0
4.2%
0.0%
St. Louis – Retail
$194.5
19.8%
0.0%
St. Louis – Self Storage
$0.0
0.0%
0.0%
Tampa – Tampa-St. Petersburg-Clearwater, FL
$300.0
3.4%
-0.1%
Tampa – Hotel
$29.9
4.4%
0.1%
Tampa – Industrial
$0.0
0.0%
0.0%
Tampa – Multifamily
$02.5
0.0%
0.0%
Tampa – Office
$23.7
3.9%
-0.2%
Tampa – Other
$0.0
0.0%
0.0%
Tampa – Retail
$243.9
27.2%
0.5%
Tampa – Self Storage
$0.0
0.0%
0.0%
Tucson – Tucson, AZ MSA
$165.9
5.3%
-0.6%
Tucson – Hotel
$04.7
1.6%
-6.5%
Tucson – Industrial
$0.0
0.0%
0.0%
Tucson – Multifamily
$0.0
0.0%
0.0%
Tucson – Office
$0.0
0.0%
0.0%
Tucson – Other
$0.0
0.0%
0.0%
Tucson – Retail
$161.3
20.1%
0.0%
Tucson – Self Storage
$0.0
0.0%
0.0%
Virginia Beach – Virginia Beach-Norfolk-Newport News, VA-NC MSA
$226.2
5.0%
-0.2%
Virginia Beach – Hotel
$0.0
0.0%
-2.1%
Virginia Beach – Industrial
$21.2
6.9%
0.0%
Virginia Beach – Multifamily
$0.0
0.0%
0.0%
Virginia Beach – Office
$02.8
0.7%
0.7%
Virginia Beach – Other
$0.0
0.0%
0.0%
Virginia Beach – Retail
$202.2
23.2%
0.2%
Virginia Beach – Self Storage
$0.0
0.0%
0.0%
Washington, DC – Washington-Arlington-Alexandria, DC-VA-MD-WV MSA
$537.8
1.9%
-0.3%
Washington, DC – Hotel
$14.8
1.6%
-1.8%
Washington, DC – Industrial
$11.2
2.0%
0.0%
Washington, DC – Multifamily
$01.2
0.0%
0.0%
Washington, DC – Office
$323.6
4.8%
-0.6%
Washington, DC – Other
$44.7
2.7%
0.0%
Washington, DC – Retail
$142.2
4.9%
-0.3%
Washington, DC – Self Storage
$0.0
0.0%
0.0%
Grand Total
$23,696.8
3.5%
-0.2%
About CRED iQ
CRED iQ is a commercial real estate data, analytics, and valuation platform providing actionable intelligence to CRE and capital markets investors. Subscribers to CRED iQ use the platform to identify valuable leads for leasing, lending, refinancing, distressed debt, and acquisition opportunities. Our data platform is powered by over $2.0 trillion of CMBS, CRE CLO, SBLL, Ginnie Mae, FHA/HUD, and Freddie Mac loan and property data.
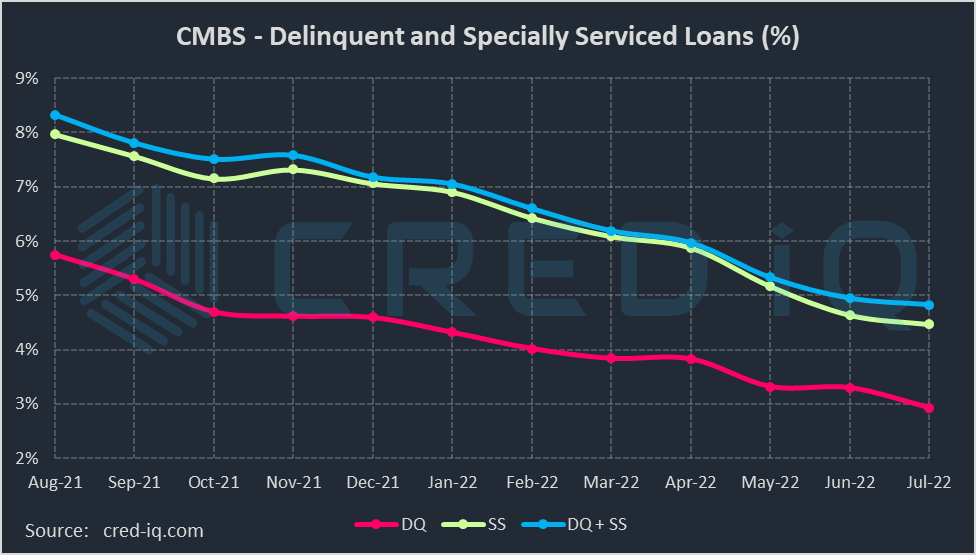
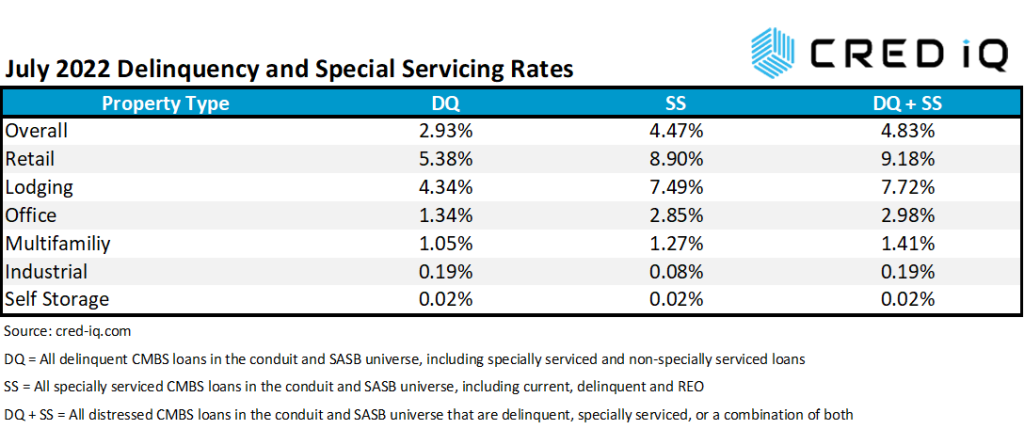
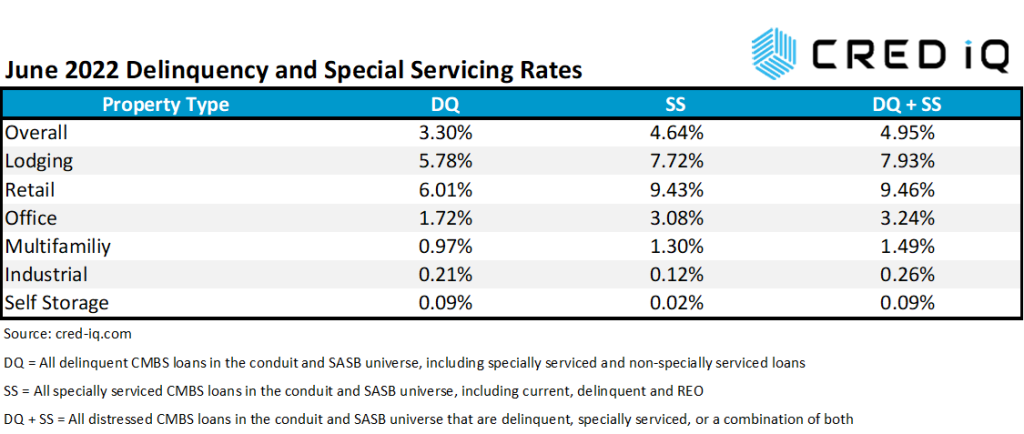
DQ = All delinquent CMBS loans in the conduit and SASB universe, including specially serviced and non-specially serviced loans SS = All specially serviced CMBS loans in the conduit and SASB universe, including current, delinquent and REO DQ + SS = All distressed CMBS loans in the conduit and SASB universe that are delinquent, specially serviced, or a combination of both
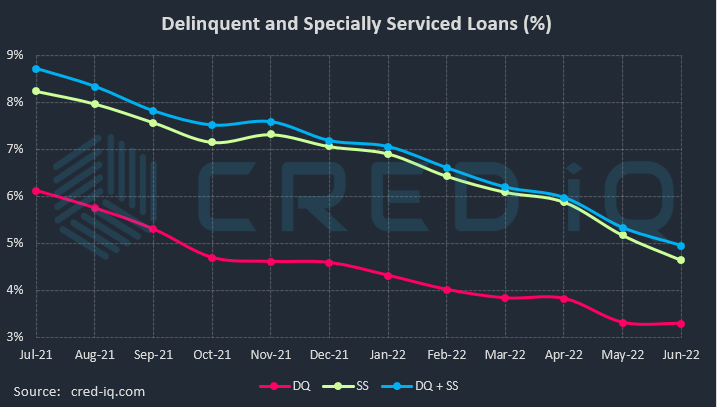
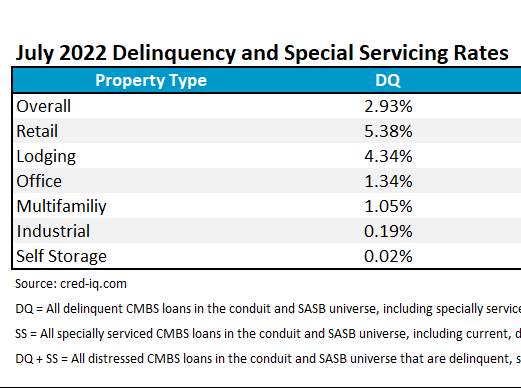
The CRED iQ overall delinquency rate for CMBS showed nominal movement during the April 2022 remittance period but still tallied a decline for the 23rd consecutive month. The delinquency rate, equal to the percentage of all delinquent specially serviced loans and delinquent non-specially serviced loans, for CRED iQ’s sample universe of $500+ billion in CMBS conduit and single asset single-borrower (SASB) loans was 3.83%, which compares to the prior month’s rate of 3.84%. CRED iQ’s special servicing rate, equal to the percentage of CMBS loans that are with the special servicer (delinquent and non-delinquent), declined month-over month to 5.88% from 6.09%. The special servicing rate is now approximately 45% lower than its pandemic-era peak of 10.79% in October 2020. Aggregating the two indicators of distress – delinquency rate and special servicing rate – into an overall distressed rate (DQ + SS%) equals 5.97% of CMBS loans that are specially serviced, delinquent, or a combination of both. The overall distressed rate declined compared to the prior month rate of 6.19%. The overall distressed rates typically track slightly higher than special servicing rates as most delinquent loans are also with the special servicer.
DQ = All delinquent CMBS loans in the conduit and SASB universe, including specially serviced and non-specially serviced loans SS = All specially serviced CMBS loans in the conduit and SASB universe, including current, delinquent and REO DQ + SS = All distressed CMBS loans in the conduit and SASB universe that are delinquent, specially serviced, or a combination of both
The individual delinquency rate for the retail sector spiked higher this month to 7.34%, compared to 7.06% as of March 2022. The sharp increase can be attributed partially to a reversion to delinquent payments from the $125 million Westfield Palm Desert loan, which is secured by a regional mall in California. The loan was marked as current in payment during previous months but became 30 days delinquent as of April 2022. Westfield Palm Desert transferred to special servicing in August 2020 and was delinquent for nearly all of 2021. Notably, the loan sponsor, Unibail-Rodamco-Westfield, was featured in the news in early-April 2022 for providing an update on its planned divestiture of U.S.-based regional malls.
The delinquency rate for lodging properties continued to show meaningful and consistent improvement. For a second consecutive month, the outstanding balance of delinquent lodging loans declined by more than $450 million. The lodging delinquency rate was 7.55% this month, which compared to 7.99% last month. One of the largest delinquency cures this month was the $135.1 million Marriott LAX loan, which is secured by a 1,004-room hotel adjacent to the Los Angeles International Airport. The loan was modified in February 2022 and terms of the agreement brought the loan current in payment. The loan transferred to special servicing in December 2020 and had been delinquent in payment until the closing of the modification agreement.
Changes in special servicing rates by individual property type were a mixed bag this month. The special servicing rate for lodging declined by approximately 15% this month. A large component of the shift was caused by the $982 million loan secured by the Ashford Hospitality Trust Portfolio. The loan transferred to special servicing in June 2020. The loan returned to the master servicer this month after furniture, fixture, and equipment (FF&E) reserves were replenished from being used to pay debt service during a forbearance period.
Special servicing rates for retail (11.21%) and office (3.73%) both increased compared to the prior month. The increase in the office special servicing rate was anticipated given last month’s revelation of Blackstone’s intentions to hand 1740 Broadway back to the lender. The increase in the special servicing rate for retail was driven by Destiny USA – a 2.1 million-sf regional mall in Syracuse, NY that is owned by Pyramid Management Group. The distressed shopping center secures a $430 million loan that is securitized in the JPMCC 2014-DSTY CMBS transaction. The loan transferred to special servicing due to imminent default ahead of the loan’s June 2022 maturity date. The loan had previously transferred to special servicing in April 2020 and returned to the master servicer in March 2021 after a loan modification. Another one of Pyramid’s properties, Walden Galleria, was a major driver behind increases in retail distress last month.
DQ + SS = All distressed CMBS loans in the conduit and SASB universe that are delinquent, specially serviced, or a combination of both
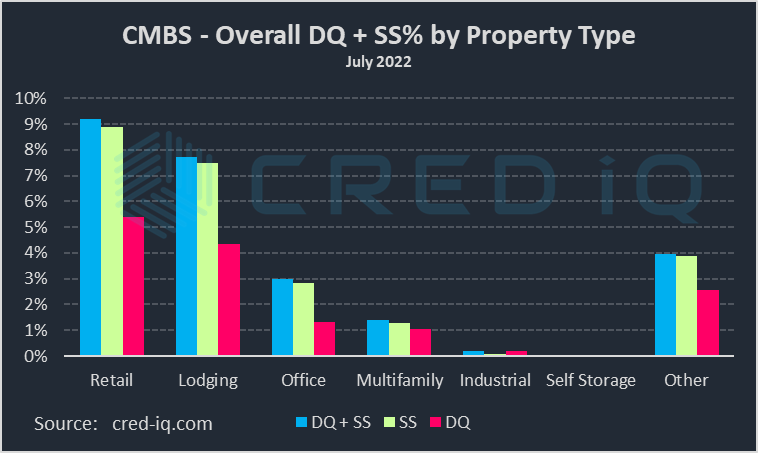
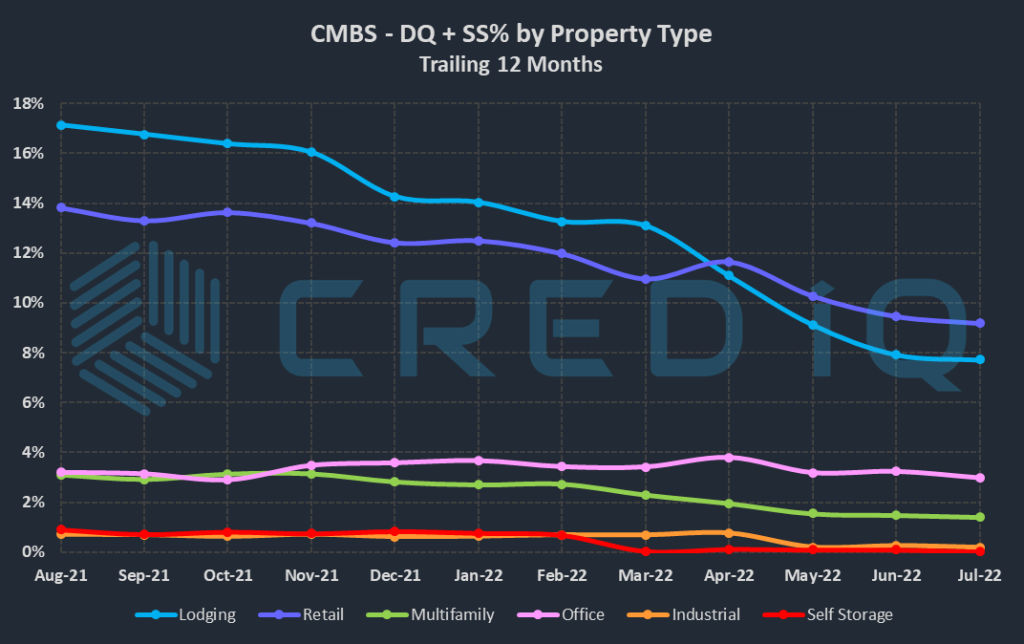
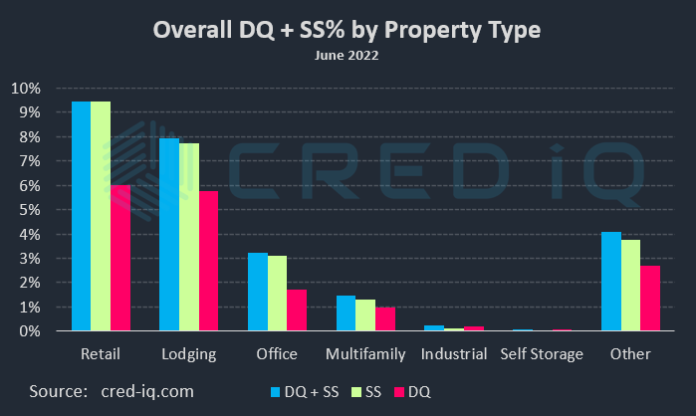
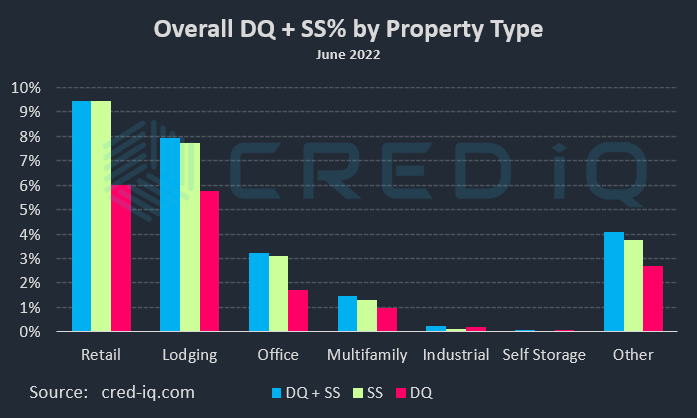
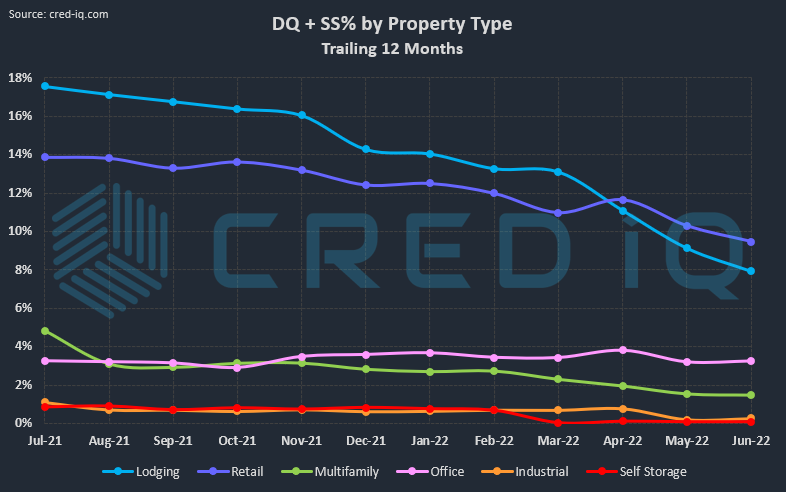
CRED iQ’s overall CMBS distressed rate (DQ + SS%) by property type accounts for loans that qualify for either delinquent or special servicing subsets. This month, overall distressed rates for retail, office, industrial, and self storage increased while lodging and multifamily exhibited declines in overall distress. Two of the largest loans added to the distressed category this month, both via transfers to special servicing, were the aforementioned 1740 Broadway and Destiny USA. For additional information about these two loans, click View Details below:
CRED iQ is a commercial real estate data, analytics, and valuation platform providing actionable intelligence to CRE and capital markets investors. Subscribers to CRED iQ use the platform to identify valuable leads for leasing, lending, refinancing, distressed debt, and acquisition opportunities. Our data platform is powered by over $2.0 trillion of CMBS, CRE CLO, SBLL, and GSE Agency loan and property data.
This week, CRED iQ calculated real-time valuations for five properties that are either vacant or have extremely low occupancy. Vacant or non-operational properties are opportunities for off-market transactions. In cases of distress, new ownership has the ability to infuse capital into a project for repositioning vacant space and attracting new tenants. Additionally, vacant suites are on the radar of leasing brokers.
Featured properties this week include a storied asset from a legacy CMBS transaction as well as CBD office properties in San Francisco, CA and Chicago, IL. Also featured are a limited-service hotel and a vacant freestanding retail building. CRED iQ valuations are included for each of the properties. For full access to the valuation reports as well as full CMBS loan reporting, with detailed financials, updated tenant information, and borrower contact information, sign up for a free trial here.
909 Chestnut Street (One AT&T Center)
1.2 million sf, CBD Office, St. Louis, MO [View Details]
The 46-story office tower formerly known as One AT&T Center has been one of the most recognizable vacant properties in a Top 50 MSA for nearly five years. The property was foreclosed on in 2017 after its sole tenant, AT&T, vacated at lease expiration. The REO office tower is reported under contract to sell, with closing slated for Q2 2022. The sale price is expected to be less than $10 million or $8/sf. The final sale price represents more than a 95% decline in value from the property’s $207.3 million ($169/sf) appraisal in 2006 when a mortgage on the property for $112.7 million was originated. There is still $107.1 million in outstanding debt on the property that will be resolved when the sale closes.
A revelation that was made clear through the property’s nearly five years of vacancy and several unsuccessful sale attempts was the building’s need for repositioning. Several alternative uses have been considered including multifamily, lodging, or even parking. Various forms of development incentives from the local municipality were also considered. However, redevelopment costs for the tower appear to be difficult to estimate, which has reportedly caused several previous sales offers to fall through before closing. For the full valuation report and loan-level details, click here.
75,523 sf, Mixed-Use (Office/Retail), San Francisco, CA [View Details]
This mixed-use building located in the Theater district of San Francisco has been nearly vacant for approximately a year. The property’s primary office tenant, Zendesk, vacated after it terminated its lease in April 2021. Zendesk occupied 97% of the building’s NRA. The remaining 3% of NRA is occupied by ground-floor retail tenant, David Rio Chai Bar. The vacant office space is being listed for $20/sf.
The property secures a $33.5 million mortgage that is scheduled to mature in January 2030. The loan has been current in payment throughout its term. As part of Zendesk’s lease termination agreement, the former tenant deposited $4.9 million into a leasing reserve account in April 2021. Total reserves for the loan still total $4.9 million, now almost a year later. The possibility of Zendesk vacating prior to lease expiration was acknowledged at loan origination in December 2019. A dark value appraisal of $59.5 million, equal to $788/sf, was provided in November 2019, prior to loan origination, alongside an “as-is” appraisal value of $71.4 million, equal to $945/sf. For the full valuation report and loan-level details, click here.
This three-story, Class-B office building in Chicago’s West Loop has been vacant since March 2020. Crate & Barrel was formerly the primary tenant at the office building, occupying 80% of the NRA. The tenant originally had a lease expiration in June 2019 but maintained a presence at the property through March 2020. Crate & Barrel vacated the building in favor of a property located in the Logan Square submarket of Chicago.
The 240 N Ashland office building secures an $11.7 million mortgage that is scheduled to mature in July 2025. Despite the vacancy of the collateral building, the loan has been current in payment throughout its term. The loan sponsor, Peppercorn Capital, appears to be using the vacancy as an opportunity to reposition the property, which is evidenced by the firm’s release of new renderings for the property in 2021. Despite a potential repositioning of the property, its vacancy is a substantial credit risk for the mortgage given the need for the loan sponsor to fund debt service shortfalls out of pocket. For the full valuation report and loan-level details, click here.
90 keys, Limited-Service Hotel, Bentonville, AR [View Details]
This limited-service hotel located in Bentonville, AR has exhibited severely low occupancy levels since the onset of the pandemic, rendering it essentially vacant for much of 2021. The property secures a $9.1 million loan that matures in 2028. The borrower received COVID-related relief in 2020 after the loan became delinquent. Forms of relief included the approval of a PPP loan and permission to use Furniture, Fixtures, and Equipment (FF&E) reserves to cure delinquent payments. The loan was current in payment as of April 2022.
According to commentary from the loan’s master servicer, the property had an average occupancy rate of just 2% for the trailing 12-month period ending June 2021. This includes an extended period when zero rooms were sold at the hotel, which operates as a Courtyard by Marriot through a franchise agreement that expires in June 2033. The hotel was open and taking reservations as of writing. For the full valuation report and loan-level details, click here.
57,510 sf, Retail, Virginia Beach, VA [View Details]
This REO single-tenant retail building located at Princess Anne Marketplace in Virginia Beach, VA has been vacant since 2018. The property transferred to special servicing in January 2020 and there has been difficulty in finding a replacement tenant since the property’s transfer. A foreclosure sale occurred in January 2021 and the property is still being marketed for lease. A sale of the property could occur by September 2022, according to special servicer commentary. Outstanding debt for the property totaled approximately $6.6 million.
The property was formerly occupied by Farm Fresh, a regional grocer that sold most of its store locations to Kroger and Food Lion in 2018. Several Farm Fresh locations closed because of the transaction, including the Princess Anne Marketplace store. The building is attached to a Target, which also offers grocery services. A grocery replacement tenant is unlikely given the adjacent competition from Target. Additionally, there is a vacant freestanding former Party City building located at Princess Anne Marketplace, which will compete for prospective tenants. For the full valuation report and loan-level details, click here.
CRED iQ is a commercial real estate data, analytics, and valuation platform providing actionable intelligence to CRE and capital markets investors. Subscribers to CRED iQ use the platform to identify valuable leads for leasing, lending, refinancing, distressed debt, and acquisition opportunities. Our data platform is powered by over $2.0 trillion of CMBS, CRE CLO, SBLL, and GSE Agency loan and property data.
CMBS securities have a highly variable presence in ESG fixed-income funds and bond ETFs with concentrations in individual funds ranging from 0.26% to 20%.
Single-Asset Single-Borrower deals accounted for 58% of the market value of all CMBS securities held in ESG-labeled funds.
CMBS investments by ESG-labeled bond funds and bond ETFs were disparate without many common attributes. Approximately 40% of CMBS deals held in ESG-labeled funds, or 121 securitizations, had only one position represented across the entire subset of funds analyzed.
CRED iQ analyzed CMBS holdings for fixed-income mutual funds and bond ETFs branded with Environmental Social Governance (ESG) labels. Data was compiled from foodtruck.ai, a data literacy and catalog platform. For clarification, any fixed-income mutual fund or bond ETF with ESG in its name was included in our analysis. A subset of 17 fixed-income funds and bond ETFs was identified as having an ESG label. An analysis of individual portfolio holdings, primarily from 2021 through year-to-date 2022, indicated that ESG-labeled funds held CMBS securities with a market value of approximately $245 million, inclusive of an outstanding par amount of $230 million and a $368 million aggregate notional balance for interest-only positions. Approximately 231 unique CMBS securities across 190 different securitizations were held in ESG-labeled funds. CMBS securitizations allow for investment at different subordination levels within their capital structure based on risk preference and allocation mandates.
The percentage of market value of CMBS investments relative to all assets of a specific fund varied widely across funds included in the analysis, with a minimum concentration of 0.26% to a maximum of 20%. The minimum CMBS concentration was in an ETF with a broad allocation strategy that included a wide array of fixed-income and asset-backed securities as well as commercial mortgage-backed securities; whereas the maximum concentration of CMBS positions was in a fund that specialized in securitized products.
By deal type, single-asset single-borrower (SASB) transactions accounted for 58% of the market value of CMBS securities held by ESG-labeled funds. The comfort level of an investor analyzing both credit risk and ESG metrics for a single asset is relatively higher than similar analysis for a conduit fusion transaction with a large group of loans secured by multiple types of properties in geographically diverse markets. Agency transactions, mainly comprising Freddie K transactions, accounted for 25% of the market value of all CMBS securities held in ESG-labeled funds while conduit transactions accounted for only 17%.
Looking at commonalities among holdings, there was little crossover in CMBS deals held by more than one fund. Of the 310 individual CMBS holdings included in the analysis, there were 121 securitizations, equal to 39%, that were only held by one individual fund in the subset. This may be unsurprising as each fund has its own investment objectives and selection criteria; however, one could reasonably expect industry-wide ESG evaluations of the CMBS sector and third-party ESG advisory firms to converge on a select group of CMBS deals that are relatively more suited to be included in an ESG-labeled bond fund. One surface-level characteristic observed among commonly held SASB CMBS positions across funds was collateral with LEED certification, which implies a high level of sustainability and energy efficiency. However, such a designation is fairly common for trophy assets, office properties in many cases, often found in SASB transactions.
Notably absent from the fund holdings in our study was SLG 2021-OVA, a green bond securitization totaling $2.3 billion secured by the trophy office asset, One Vanderbilt. The green CMBS bonds were not present in any of the ESG-labeled publicly traded ’40 Act funds included in our analysis. Also missing from ESG-labeled fund holdings were rake certificates totaling $72 million tied to 85 Broad Street in CSAIL 2017-C8, which were also considered green bonds. Conversely, a Bank of America single-asset deal with green bonds, collateralized by a $425 million mortgage secured by The JACX office development in Long Island City, NY appeared in two ESG-labeled funds, showing some, albeit limited, overlap of common holdings.
Looking more closely at common CMBS holdings across funds, several of Freddie Mac’s ESG-friendly K certificates, KG00 Series and KSG00 Series, appeared in as many as three separate funds. However, these holdings were too infrequent to discern any patterns of investments across fund portfolios.
By market value, Freddie Mac’s FREMF 2019-KG01 transaction was the largest CMBS position across all ESG-labeled funds. But this securitization was only held by two of the 17 funds in the study.
By frequency of position, the most commonly held CMBS deal by ESG-branded funds was the DROP 2021-FILE single-asset single borrower securitization, which was represented in five of the 17 funds in the study. The transaction is collateralized by a $600 million mortgage that is secured by The Exchange, a 12-story, 750,000 sf office property located in the Mission Bay submarket of San Francisco. From an ESG perspective, the transaction did not appear to be structured as a green bond offering, but certificate payments passed through from cash flows from the collateral may seem appealing due to the office building’s LEED Platinum certification. The office serves as the global headquarters for Dropbox, which subleases to multiple tenants that operate in the life sciences sector. A small percentage of the building’s NRA is leased to Ballast Point Brewery, a subsidiary of lease guarantor Constellation Brands. Ironically, several ESG-labeled fund prospectuses state that investments will not be made in securities of any issuers engaged in certain screened industries, including the manufacturing of alcohol, but fund prospectus language stopped short of underlying tenant exclusion for CMBS securities.
Expansion of exclusionary screening for CMBS investments can be explored by tenant, industry, loan sponsor, or any other direct or indirect party to a securitization. The operation of gambling casinos is a commonly excluded industry stated by several ESG-labeled bond fund prospectuses from the analysis. However, high profile CMBS loans backed by the Bellagio Hotel and Casino and MGM Grand & Mandalay Bay are well represented in the portfolio holdings of ESG-labeled funds, with investment positions across six of the 17 (35%) ESG-labeled funds.
The absence of any discernible patterns of the types of CMBS investments that are included in ESG-labeled funds can be attributed to a number of factors. Variability can arise from differing methodologies used by portfolio managers to score or identify worthy investments. Execution of strategies may be inhibited by market competition for the same deals that are universally accepted as ESG-friendly. Over time, a reasonable expectation is for CMBS investments to converge towards a relative hierarchy to see more consensus and less randomness in the CMBS deals that are held in ESG bond funds and bond ETFs.
About CRED iQ
CRED iQ is a commercial real estate data, analytics, and valuation platform designed to unlock investment, financing, and leasing opportunities. CRED iQ provides real-time property, loan, tenant, ownership, and valuation data for over $2.0 trillion of commercial real estate.
This week, CRED iQ reviewed real-time valuations for several assets that secure non-performing matured loans. Maturity defaults often can be a result of distress but may also be a mismatch in the timing of a refinancing effort or a sale closing. Non-performing matured loans are opportunities for distressed investors to step in and infuse capital in situations where traditional solutions may not be an option. Most of this week’s loans are secured by various subtypes of retail properties, including a distressed regional mall in northern Washington and a trio of Manhattan ground-floor retail buildings.
CRED iQ valuations factor in a base-case (most likely), a downside (significant loss of tenants), and dark scenarios (100% vacant). For full access to the valuation reports as well as full CMBS loan reporting, with detailed financials, updated tenant information, and borrower contact information, sign up for a free trial here.
Bellis Fair Mall
538,226 sf, Regional Mall, Bellingham, WA [View Details]
This $76.5 million loan failed to pay off at its February 6, 2022 maturity date after the borrower, Brookfield Property Partners, was unable or unwilling to secure refinancing. The loan transferred to special servicing shortly after its maturity default. All workout options appear to be on the table including receivership, foreclosure, discounted payoff scenarios, or a modification agreement that could potentially delay any resolution for an extended period. However, Brookfield Property Partners has established a willingness to cooperate in the conveyance of title for properties with similar credit issues, including examples such as the Florence Mall in January 2021 and the imminent foreclosure of the Pierre Bossier Mall. Bellis Fair Mall was featured in CRED iQ’s March 2022 Delinquency Report as one of the largest new loans to recently transfer to special servicing.
The loan is secured by 538,226 sf of in-line and anchor space at the 776,000-sf Bellis Fair Mall in Bellingham, WA, which is approximately 50 miles southeast of Vancouver BC, Canada. Traditional department store anchors for the mall include Macy’s, Target, Kohl’s, and JCPenney. Of those, only the Macy’s box serves as collateral for the mortgage. Junior anchors include Dick’s Sporting Goods and Ashley Furniture HomeStore – both of which occupy space that was repositioned from a vacant former Sears parcel. Even with established anchor boxes and repositioning of junior anchors, Bellis Fair Mall has struggled with in-line occupancy throughout the pandemic. Many in-line tenants had termination options tied to sales targets, which were triggered during the pandemic, causing a high volume of tenant departures. Additionally, mall foot traffic was partially reliant on cross-border visitors from Canada, which was disrupted by pandemic lockdowns. CRED iQ estimates in-line occupancy declined to approximately 68% from a pre-pandemic level of about 80%. For the full valuation report and loan-level details, click here.
Three loans with an aggregate outstanding balance of $11 million failed to pay off at maturity on April 6, 2022. The collateral properties, three limited-service hotels, were severely impacted by the pandemic and were not fully stabilized by the time maturity balloon payments were due. All three loans share the same borrower and transferred to special servicing in June 2020. The latest commentary from the loan’s special servicer indicates the borrower received a financing commitment from Northrim Bank to fully satisfy the loans’ outstanding balances. Based on LTVs, cited by servicer commentary, from 40% to 60% and November 2021 appraisals for each of the properties, the estimated refinancing package would total approximately $10.2 million, which is still a deficit from the aggregate debt amount.
The three hotel properties secured three individual loans, although two of the loans are cross-collateralized and cross-defaulted. Two of the hotels — Motel 6 and Comfort Inn Ship Creek — represent a leasehold ownership interest and the third hotel, Microtel Inn and Suites, represents a fee simple ownership interest. All three hotels were appraised for an aggregate value of $18.8 million in November 2021, equal to $71,212/key, which represented a 22% decline from origination appraisals. For the full valuation report and loan-level details, click here.
This $9.1 million loan failed to pay off at its April 1, 2022 maturity date. Prior to the maturity default, the loan transferred to special servicing in February 2020 due to imminent default, following a decline in collateral occupancy. The loan remained current in payment from the time of its transfer to special servicing until its maturity date. The borrower’s commitment to keeping the loan current until maturity, despite collateral occupancy issues, was a positive signal for a potential scenario with a full payoff. However, the maturity default may expedite negotiations between the borrower and special servicer towards a less favorable resolution where the special servicer may pursue foreclosure if the borrower is uncooperative.
The loan is secured by a 112,260-sf retail center in Stuart, FL. The property’s largest tenant, Martin Diagnostic Center, vacated at lease expiration in November 2019. The tenant occupied 42,011 sf of space, accounting for 37% of the property’s NRA. Occupancy declined to approximately 45% after the property’s anchor tenant vacated. Medical office tenants may be a possibility for a potential backfill of the vacant anchor space given its former use and prevalence of medical tenants in the immediate market. For the full valuation report and loan-level details, click here.
13,349 sf, High Street Retail, New York, NY [View Details]
This $7.9 million loan failed to pay off at its April 10, 2022 maturity date. Prior to the maturity default, there were negotiations between the borrower, Thor Equities, and the loan’s special servicer regarding forbearance. The loan transferred to special servicing in September 2020 but returned to the master servicer in April 2021 without a modification. Updated servicer data indicates the workout situation has possibly been resolved and the borrower may have secured refinancing. Even if the loan pays off in the near term, the collateral properties could still be for sale. The property at 933 Broadway was reportedly under contract to be sold in early-2020 before the pandemic caused the deal to fall through.
The loan collateral consists of three, three-story retail buildings located in the Flatiron District of Manhattan, NY. The properties were 100% occupied as of year-end 2020 but some tenants were unable to pay rent at the time. A few struggling tenants vacated, and the properties were 63% occupied for most of 2021. For the full valuation report and loan-level details, click here.
129 units, Senior Housing, Springfield, IL [View Details]
This $7.5 million loan failed to pay off at maturity on February 6, 2022. The loan transferred to special servicing in January 2022 in anticipation of the maturity default. The workout plan appears to be to sell the collateral property. The borrower had attempted to sell the senior housing facility in the months leading up to the loan’s maturity, but the few offers that came in were below the outstanding debt amount.
The loan is secured by a 129-unit senior housing facility in Springfield, IL. Occupancy at the property declined from a pre-pandemic level of 81% to approximately 56% as of September 2021. Cash flow from the property was sufficient for a DSCR of 1.54 during 2020 but the loan’s DSCR declined to below breakeven levels in 2021. For the full valuation report and loan-level details, click here.
CRED iQ is a commercial real estate data, analytics, and valuation platform providing actionable intelligence to CRE and capital markets investors. Subscribers to CRED iQ use the platform to identify valuable leads for leasing, lending, refinancing, distressed debt, and acquisition opportunities. Our data platform is powered by over $2.0 trillion of CMBS, CRE CLO, SBLL, and GSE Agency loan and property data.