The CRED iQ team made the most out of 2021 by providing market constituents with commercial real estate analytics, loan and property data, as well as fresh takes on commercial real estate trends and new cycles. CRED iQ’s WAR Report (Weekly Asset Review) is among its most popular reads, providing in-depth analysis on a variety of topics including distressed asset valuations and credit risk analysis. CRED iQ’s commentary on commercial mortgage origination trends has gained popularity this year as well, examining lender terms and loan structures for new originations. Lastly, our CRED DQ report — featuring CMBS delinquency and special servicing rates as well as market delinquency tracking — has been featured in several widely recognized media outlets.
The team here at CRED iQ looks forward to providing more great content in 2022!
One of our most popular WAR Report posts that featured a regional mall located in Lancaster, PA and 2 mixed-used properties located in Lower Manhattan.
CRED iQ is a commercial real estate data, analytics, and valuation platform providing actionable intelligence to CRE and capital markets investors. Subscribers to CRED iQ use the platform to identify valuable leads for leasing, lending, refinancing, distressed debt, and acquisition opportunities. Our data platform is powered by over $2.0 trillion of CMBS, CRE CLO, SBLL, Ginnie Mae, FHA/HUD, and Agency loan and property data.
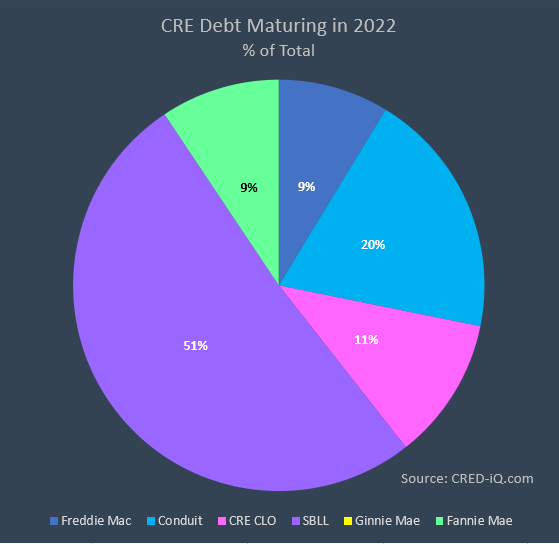
This week, CRED iQ looks to the year ahead in commercial real estate and examines commercial mortgages with maturity dates scheduled in 2022. CRED iQ’s database has approximately $97 billion in commercial mortgages that are scheduled to mature in 2022, including loans securitized in CMBS conduit trusts, single-asset single-borrower deals (SASB), and CRE CLOs, as well as multifamily mortgages securitized through government-sponsored entities. The SASB subset of nearly $50 billion comprises the majority of scheduled maturities in 2022; however, approximately 83% of that balance is tied to floating-rate loans that have extension options available, providing no assurances of refinancing or new origination opportunities.
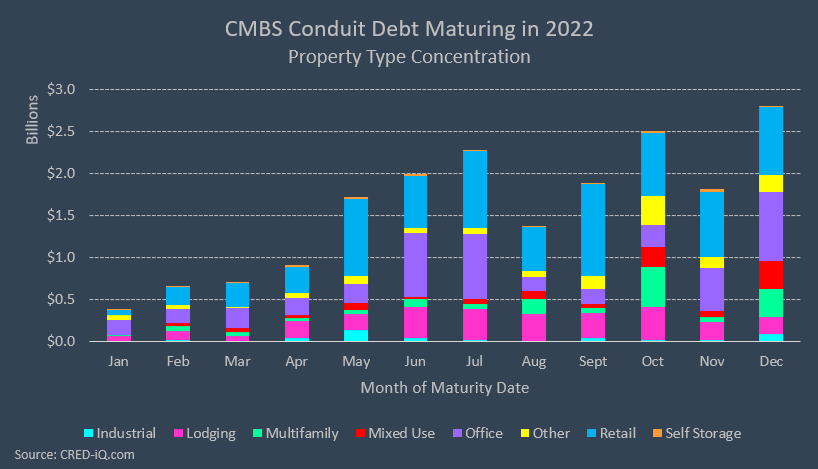
For this charting session, we focus on 2022 maturing loans that have been securitized in CMBS conduit transactions, which totals approximately $19 billion. This group of loans provides for a more diverse observation of loans across property type, class, and geographic location. Breaking down 2022 maturities by property type, retail has the highest concentration with 38% of outstanding debt and is followed by office with 24%. Lodging has the third-highest concentration with 14% of the outstanding balance of scheduled maturities in 2022. Property type concentrations for 2022 maturities shadow the makeup of 2012 vintage conduits, which were only a few years removed from the great financial crisis and consist primarily of 10-year mortgages that are coming due this year. Within 2012 vintage conduit deals, concentrations in multifamily loans were smaller due to the post-crisis re-emergence of Freddie Mac securitizations, which provided for greater volume in retail, office, and lodging loans.
From a monthly perspective, the second half of 2022 has the highest concentration of scheduled maturities. Many CRE professionals recently experienced the time compression of closing new deals by year-end 2021 and the trope holds true with December 2022 having the highest total of scheduled maturities, $2.8 billion, out of any month. October 2022 is second-highest with $2.5 billion in scheduled maturities and is following by July 2022 with $2.3 billion. Loans generally have 3 to 4-month open periods so lenders often have opportunity to provide refinancing earlier than stated maturity dates.
Approximately 14% of the 2022 scheduled maturity debt is already delinquent or in special servicing, which portends maturity defaults, delayed payoffs, or extended workouts. Furthermore, an additional 4% of the total debt has received some type of forbearance in 2020 or 2021 to provide COVID-19 relief. Cure statuses vary among loans with forbearance agreements, and many loans have not been able to recover to pre-pandemic performance levels with the relief that had been provided. Such examples include a $55.6 million loan secured by Southpark Mall in Colonial Heights, VA, which was granted forbearance in July 2020. The loan is scheduled to mature in June 2022, but a timely payoff appears unlikely given its most recent transfer to special servicing in February 2021.
Factors for a timely payoff at maturity can differ by property type. Lodging and non-essential retail had the most pronounced adverse impacts from the pandemic, whereas cracks in the office sector are appearing for lower-tier assets.
Retail
Retail is the property type that contributes most to potential 2022 maturity risk — of the $7.3 billion in conduit retail loans scheduled to mature in 2022, loans totaling $2 billion have already transferred to special servicing. Much of the distress is attributed to outsized loans backed by regional malls, which were a popular securitization choice for 2012 vintage conduits. From another angle, the average size of a retail loan that is scheduled to mature in 2022 was about $16.8 million but the average size of a distressed retail loan maturing in 2022 is approximately $44.1 million.
Stabilization is a key issue for lodging loans with near-term maturities. For a successful maturity resolution, stable collateral performance is a primary consideration for refinancing. Recovery and stabilization within this sector may be facing headwinds as the Omicron COVID variant continues to sweep across the country. Hotel loans accounting for 23% of the aggregate balance of scheduled lodging maturities have had forbearance agreements in 2022, highest of any property type by a wide margin. The repayment of forbearance and the replenishment of reserves accounts will be a consideration for monitoring lodging loans scheduled to mature in 2022.
Although office loans have relatively low delinquency and special servicing rates compared to lodging and retail, many office properties are being evaluated with a high level of scrutiny. With nearly $4.5 billion in office CMBS debt coming due in 2022, lenders are focused on several credit factors including lease rollover. CMBS office loans with 2022 maturity dates are secured by more than 538 million square of office space, of which 76 million square feet, or 14% of total GLA, is attached to leases that expire within the next 12 months. Office properties with high concentrations of near-term lease rollover present issues with long-term refinancing due to uncertainty of cash flows should tenants vacate or renew at lower rates.
Aside from a focus on 2022 maturities, the year ahead brings plenty of opportunities within the CRE industry. Looking back — there is $18.9 billion in outstanding debt with a scheduled maturity date in 2021 that still needs to be worked out as well as several billion in REO assets that are on track to be liquidated. Looking ahead to 2023 — CRED iQ’s early estimates indicated nearly $154 billion in scheduled maturities; however, the aggregate total is fluid when considering loan extensions and potential prepayments throughout 2022.
About CRED iQ
CRED iQ is a commercial real estate data, analytics, and valuation platform providing actionable intelligence to CRE and capital markets investors. Subscribers to CRED iQ use the platform to identify valuable leads for leasing, lending, refinancing, distressed debt, and acquisition opportunities. Our data platform is powered by over $2.0 trillion of CMBS, CRE CLO, SBLL, Ginnie Mae, FHA/HUD, and Agency loan and property data.
This week’s landscape takes us to a view of Raleigh, NC, which is the location of one of this week’s highlighted properties — Arbor Creek Apartment Homes.
This week, CRED iQ reviewed the commercial real estate lending landscape and highlighted multifamily properties that have secured financing in the past 2 months. The highlighted loan originations featured 4 properties within the New York-Northern NJ MSA as well as a property located in the highly sought-after Sun Belt market of Raleigh, NC. In certain cases, mortgage loans from properties’ prior financing packages were catalogued in CRED iQ’s database, which enables users to evaluate prior loans terms and pre-origination financial history.
Using CRED iQ’s proprietary Commercial Real Estate Comp scoring functionality, we compared CMBS lender terms and loan structures for newly originated loans to ascertain trends in the commercial real estate lending environment. Additionally, we provide valuations for each asset to evaluate leverage levels in relation to originators’ LTVs. The CRED iQ valuations factor in a base-case (Most Likely), a downside (significant loss of tenants), and dark scenarios (100% vacant). Base-case valuations for select properties are provided below. For full access to the valuation reports as well as full CMBS loan reporting, including detailed financials, updated tenant information, and borrower contact information, sign up for a free trial here.
The Eddy
310 units, Mid-Rise Multifamily, Harrison, NJ
Ironstate Development secured $90 million in mortgage debt from Deutsche Bank on November 23, 2021 in the form of a $43 million first mortgage and a $47 million subordinate loan to refinance existing debt on The Eddy multifamily complex. The loan was structured with a 10-year term and an initial 5-year interest-only period. The weighted average interest rate for the financing package was 2.89% — consisting of 2.45% for the senior debt and 3.29% for the junior debt. The loan will be locked out from prepayment for 3 years, and then require a yield maintenance charge for prepayment until its open period 3 months prior to maturity in December 2031. Many of CRED iQ’s loan comparisons are secured by properties located across the Passaic River in Newark, NJ; however, one of the more relevant comps is the $97 million mortgage, originated in June 2018, that is secured by the Harrison Urby Apartments. The loan had an interest rate of 2.04% with a 5-year interest-only period.
The Eddy’s mortgage debt is secured by fee interest in a 310-unit mid-rise multifamily property in Harrison, NJ. The property was developed in 2021 and comprises studios, 1-bedroom, and 2-bedroom unit types. The property leased up quickly after coming online in February 2021 and was 98% occupied as of November 2021. The development of the property included a Payment in Lieu of Taxes (PILOT) agreement that is effectively a temporary tax abatement.
The property was appraised at a value of $140.1 million, equal to $451,935/unit, as of October 13, 2021, which implied a whole-loan LTV of 64% and a capitalization rate of 4.38% based on the originator’s underwritten NCF. For the full valuation report and loan-level details, click here.
Subject Property
Name
The Eddy
Address
555 South 1st Street Harrison, NJ 07029
Property Type
Multifamily
Property Subtype
Mid Rise
Building Size
310 units
Year Built
2021
Submarket
Newark
County
Hudson
MSA
New York-Northern New Jersey-Long Island, NY-NJ-PA MSA
Origination Date
11/21/2021
Loan Amount
$90,000,000
Interest Rate
2.89%
Valuation
Appraised Value
$140,100,000 ($451,935/unit)
Appraisal Date
10/13/2021
Appraisal LTV
64.24%
CRED iQ Base-Case Value
$138,400,000 ($446,444/unit)
Arbor Creek Apartment Homes
347 units, Garden-Style Multifamily, Raleigh, NC
Bellwether Enterprise originated a $35.6 million mortgage on October 26, 2021 to refinance existing debt on a multifamily property in Raleigh, NC. The floating-rate loan had a 10-year term, a 5-year interest-only period, and was indexed to 30-day SOFR plus 2.40%. The loan will be locked out from prepayment for 1 year and will require a prepayment penalty of 1% until its open period beings 4 months prior to maturity. For those looking for origination opportunities in the Sun Belt, one of CRED iQ’s most relevant comps in a $24.4 million loan secured by The Retreat at Raleigh — a 554-unit multifamily property located less than a mile away from Arbor Creek Apartment Homes. The comparable loan has a maturity date on January 1, 2023 but will be open for prepayment on September 1, 2022.
The Arbor Creek Apartment Homes loan is secured by a 347-unit affordable housing property located west of the Raleigh, NC CBD. All but 10 of the units offer rents at less than or equal to 80% of Area Median Income (AMI). There are 132 units, equal to 38% of total units, that are rented at less than or equal to 50% AMI. The apartments were 95% occupied as of August 2021. The property was appraised for $54.3 million, equal to $156,484/unit, as of August 5, 2021, which results in an LTV of 65.6% and an implied cap rate of 4.11% based on the originator’s underwritten NCF. For the full valuation report and loan-level details, click here.
Subject Property
Name
Arbor Creek Apartment Homes
Address
5400 Portree Place Raleigh, NC 27606
Property Type
Multifamily
Property Subtype
Garden
Building Size
347
Year Built
1969
Submarket
West Raleigh
County
Wake
MSA
Raleigh-Cary, NC MSA
Origination Date
10/26/2021
Loan Amount
$35,639,000
Interest Rate
30-Day Avg SOFR In Advance + 2.40%
Valuation
Appraised Value
$54,300,000 ($156,484/unit)
Appraisal Date
8/5/2021
Appraisal LTV
56.48%
CRED iQ Base-Case Value
$51,440,000 ($148,251/unit)
New Floral Gardens (II and IB)
260 units, Multifamily, North Bergen, NJ
NorthMarq originated two loans totaling $34 million on November 1, 2020 to refinance $15.8 million in existing debt on 260 affordable housing units in North Bergen, NJ. The two loans each have an interest rate of 2.88% and are structured with 10-year terms and 30-year amortization schedules. The loans will be locked out from prepayment for 2 years, and defeasance will be permitted after lockout through the remainder of the loan term. Both loans will be open for prepayment four months prior to maturity. CRED iQ’s highest scoring loan comp is the $47.55 million Hudson Mews loan, which was originated on December 9, 2020 and has an interest rate of 2.39%. Hudson Mews is a 198-unit multifamily property located approximately a half mile away from the New Floral Gardens properties.
New Floral Gardens consists of two properties — building IB contains 145 units and building II contains 115 units. The properties are located within the Hudson Waterfront of northern New Jersey with immediate access to the Lincoln Tunnel. Occupancy at both properties has been stable since 2012 and was most recently greater than 95% as of September 2021. Over 80% of the units offer rents less than or equal to 50% of Area Median Income (AMI).
The New Floral Gardens IB property had the higher appraised value of the two, equal to $37.3 million, or $257,310/unit. The New Floral Gardens II property was appraised for a value of $19.8 million, or $172,087/unit. For the full valuation reports and loan-level details, click here.
Subject Properties
Name
New Floral Gardens IB
New Floral Gardens II
Address
1200-1220 26th Street North Bergen, NJ 07047
2625 Kennedy Boulevard North Bergen, NJ 07047
Property Type
Multifamily
Multifamily
Property Subtype
High Rise
High Rise
Building Size
145
115
Year Built
1959
1952
Submarket
Hudson Waterfront
Hudson Waterfront
County
Hudson
Hudson
MSA
New York-Northern New Jersey-Long Island, NY-NJ-PA MSA
New York-Northern New Jersey-Long Island, NY-NJ-PA MSA
Origination Date
11/1/2021
11/1/2021
Loan Amount
$22,000,000
$12,000,000
Interest Rate
2.88%
2.88%
Valuation
Appraised Value
$37,310,000 ($257,310/unit)
$19,790,000 ($172,087/unit)
Appraisal Date
8/24/2021
8/24/2021
Appraisal LTV
58.90%
60.50%
CRED iQ Base-Case Value
$35,420,000 ($244,276/unit)
$19,360,000 ($168,373/unit)
Forest Hills South Co-Op
605 units, Cooperative Housing, Forest Hills, NY
A $16.9 million mortgage was originated by National Cooperative Bank on November 18, 2021 to refinance existing debt on a cooperative housing property in central Queens, NY. The 10-year loan was structured with a 30-year amortization period and an interest rate of 2.85%. The loan would require a yield maintenance charge for prepayment for most of its term until prepayment provisions ease up to a 1% penalty, starting 7 months prior to maturity. One of CRED iQ’s highest scoring loan comps is a $17 million loan secured by the Hampton Court CoOp in the Kew Gardens neighborhood of Queens. The comparable loan was originated in December 2019 and had an interest rate of 2.92%. Hampton Court contained 323 units across 4 buildings.
The Forest Hills cooperative housing property spans 7 buildings along 113th Street in the Forest Hills neighborhood of Queens. Three of the buildings have frontage along Queens Boulevard. Of the 605 units, 584 units are owned by tenant-shareholders and 21 units owned by the loan sponsor or cooperative. Additionally, there are 18 commercial units that function primarily as ground-floor retail.
The property was appraised at a value of $253 million ($418,182/unit) as of September 23, 2021, which aligns with CRED iQ’s analysis of over 40 sales transactions of units at the property in 2021. CRED iQ’s average sales price was equal to $421,451/unit or $255 million. However, CRED iQ’s Base-Case valuation of $173.7 million, equal to $287,056/unit), is based on the scenario of the property operating as traditional multifamily. For the full valuation report and loan-level details, click here.
Subject Property
Name
Forest Hills South Owners, Inc.
Address
77-15 113th Street Queens, NY 11375
Property Type
Multifamily
Property Subtype
Cooperative Housing
Building Size
605 units
Year Built
1939
Submarket
Forest Hills
County
Queens
MSA
New York-Northern New Jersey-Long Island, NY-NJ-PA MSA
Origination Date
11/18/2021
Loan Amount
$16,900,000
Interest Rate
2.85%
Valuation
Appraised Value
$253,000,000 ($418,182/unit)
Appraisal Date
9/23/2021
Appraisal LTV
6.68%
CRED iQ Base-Case Value
$173,700,000 ($287,056/unit)
Coolidge Hill Road Apartments
28 units, Low-Rise Multifamily, Watertown, MA
A $4 million loan was originated by Bank of America on November 19, 2021 to refinance existing debt on a 28-unit multifamily property in Watertown, MA. The interest-only loan has a 10-year term and an interest rate of 3.77%. The loan will be locked out from prepayment for 2 years, and defeasance will be permitted after lockout through the remainder of the loan term. One of CRED iQ’s highest rated comps for this new origination is a $9.4 million loan that is secured by Homer Apartments — a 58-unit multifamily property located in Cambridge, MA. This comparable loan was originated on December 31, 2020 and had an interest rate of 2.92%.
Coolidge Hill Road Apartments consists of two buildings — a 24-unit, 3-story building known as Coolidge Hill Manor and an adjacent quadplex. The property was 100% occupied as of October 26, 2021 and was appraised for a value of $7.1 million ($253,571/unit). The appraisal value resulted in an LTV of 56.5% and an implied cap rate of 4.54%. For the full valuation report and loan-level details, click here.
Subject Property
Name
Coolidge Hill Apartments
Address
39 Coolidge Hill Road Watertown, MA 02472
Property Type
Multifamily
Property Subtype
Low Rise
Building Size
28 units
Year Built
1925
Submarket
Waltham/Watertown
County
Middlesex
MSA
Boston-Cambridge-Quincy, MA-NH MSA
Origination Date
11/19/2021
Loan Amount
$4,010,000
Interest Rate
3.77%
Valuation
Appraised Value
$7,100,000 ($253,571/unit)
Appraisal Date
10/26/2021
Appraisal LTV
56.48%
CRED iQ Base-Case Value
$6,067,000 ($216,691/unit)
For full access to our loan database and valuation platform, sign up for a free trial below:
CRED iQ is a commercial real estate data, analytics, and valuation platform providing actionable intelligence to CRE and capital markets investors. Subscribers to CRED iQ use the platform to identify valuable leads for leasing, lending, refinancing, distressed debt, and acquisition opportunities. Our data platform is powered by over $2.0 trillion of CMBS, CRE CLO, SBLL, Ginnie Mae, FHA/HUD, and Agency loan and property data.
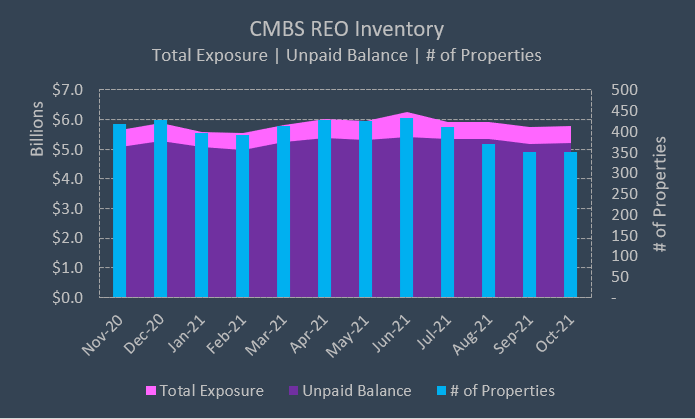
CRE professionals are in the midst of the holiday season and while some may reminisce about the glory days of the Sears and JCPenney holiday catalogs — others are closing deals for now-vacant Sears and JCPenney boxes. CRED iQ welcomes the CRE community in finding their next gift (opportunity) with an examination of commercial real estate properties that are REO within CMBS. As of October 2021, there were approximately 350 properties in CMBS transactions that are REO. Unpaid balances for these properties total approximately $5.2 billion. However, distressed assets typically have additional amounts due in terms of property protection and debt service advances by servicers, which in this case totals about $584 million, for a total exposure of approximately $5.8 billion. These REO assets have a finite holding period and will be sold to market at some point in the future. Special servicers, on behalf of CMBS trusts, are generally required to sell REO assets by the end of the 3rd year following a title transfer but may be granted extensions under certain conditions. Circumstance provides opportunity for distressed investors, especially with a notable increase in volume of distressed CRE opportunity funds that have seeded in 2021.
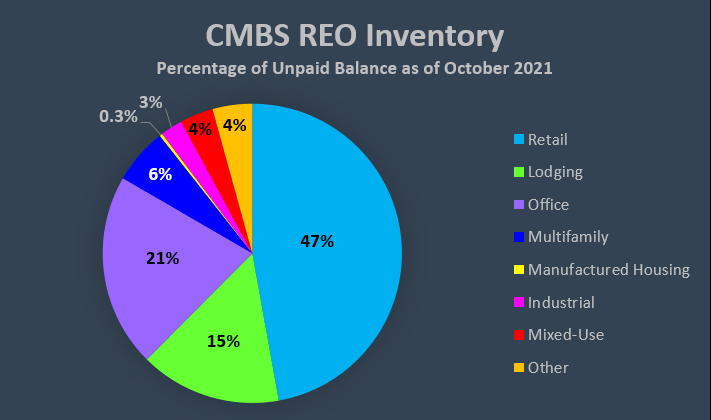
The vast majority of CMBS REO inventory is retail, accounting for 47% of the aggregate outstanding debt for all REO properties. Office, 21% of the total, and Lodging, 15% of the total, round out the top 3 property types. Akin to a Teddy Ruxpin or limited-edition Squishmallow, Manufactured Housing and Industrial REO assets are positioned as the hard-to-get property types with limited inventory. There were only 3 manufactured housing properties and 11 industrial properties that were REO.
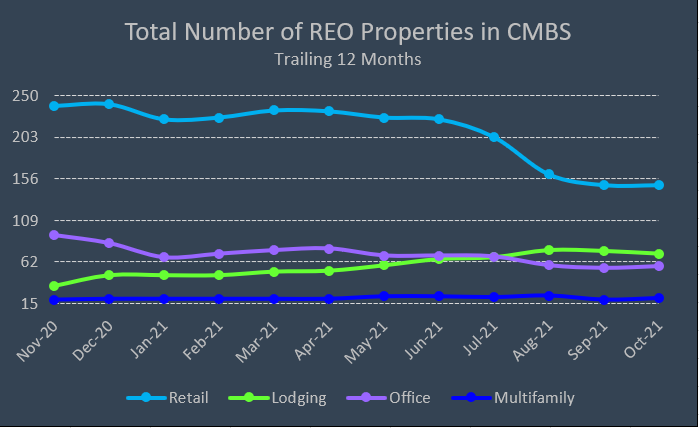
From a historical perspective, the total number of REO assets has declined by 5% over the prior 12 months. The decline in the number of REO assets was led by Retail which saw a net reduction of about 60 assets over the course of a year. However, as the number of retail assets has been trending downwards, the total number of REO hotels has more than doubled in the past year — increasing by a factor of 2.4x. The number of office properties has declined year-over-year as well, exhibiting a 40% decrease. Despite reductions in the number of REO assets, the total outstanding debt on REO has increased by approximately 13%. The most logical explanation is that REO assets with smaller unpaid debt amounts are also generally smaller basis properties that can attract a wider range of acquisition prospects and more efficient closings. High basis assets, especially those in severe distress or in need of CapEx and repositioning, with large outstanding debt amounts, may have more limited buyer pools. This is most evident with Retail REO inventory, which had its outstanding balance increase by $201.6 million, despite approximately 60 fewer assets. Smaller community centers and strip centers were liquidated while larger basis regional malls remained unsold with limited buyer pools.
Of the largest REO assets by total exposure, six out of 10 are regional malls. The remaining 4 are office properties. The highlighted regional malls have been REO for an average of just under 3 years — the title to Ingram Park Mall in San Antonio, TX was most recently conveyed to the special servicer in April 2021. Portals I, an office property in Washington, DC, has been REO for 5 and a half years, which is the longest among the Top 10. Value depreciation of these assets may be the most noticeable at first glance. Seven of the 10 properties have been re-appraised and the average decline in value compared to loan origination was 70%, a glaring example of the severity of distress present with REO assets. Looking ahead, there are over 350 properties totaling close to $5.7 billion that are delinquent with a workout strategy of foreclosure cited by servicers. These properties serve as the potential pipeline for additional REO assets; however, workouts of CRE properties are very fluid and often do not result in the acquisition of title by special servicers and lenders. Regardless, distressed investors should not limit their opportunities and explore these properties as additional options. Happy holiday hunting!
Largest REO Properties in CMBS by Total Exposure
Name
Address
Property Type
Unpaid Balance
Total Exposure
Years REO
Appraisal Value at Loan Origination
Most Recent Appraisal Value
Decline in Appraisal Value
Town Center at Cobb
400 Ernest West Barrett Parkway Kennsesaw, GA 30144
Regional Mall
$172,217,882
$179,156,107
1.5
$322,000,000
NAV
NAV
Portals I
1250 Maryland Avenue Southwest Washington, DC 20024
Office
$155,000,000
$158,272,544
5.5
$235,000,000
$136,700,000
-41.8%
One AT&T Center
909 Pine Street St. Louis, MO 63101
Office
$107,147,765
$125,775,049
4.7
$207,260,000
$9,200,000
-95.6%
Ingram Park Mall
6301 Northwest Loop 410 San Antonio, TX 78238
Regional Mall
$119,627,225
$119,627,225
0.6
$215,400,000
NAV
NAV
Koger Center
2540 W Executive Circle Tallahassee, FL 32301
Office
$103,271,007
$112,722,443
0.7
$145,000,000
$39,800,000
-72.6%
University Mall
155 Dorset Street South Burlington, VT 05403
Regional Mall
$92,000,000
$97,440,784
6.4
$116,300,000
$45,200,000
-61.1%
Florence Mall
2028 Florence Mall Florence, KY 41042
Regional Mall
$89,404,415
$91,665,476
1.4
$158,600,000
NAV
NAV
Three Westlake Park
550 Westlake Park Boulevard Houston, TX 77079
Office
$76,651,330
$91,375,698
3.1
$121,150,000
$25,175,000
-79.2%
Rushmore Mall
2200 N Maple Ave Rapid City, SD 57701
Regional Mall
$89,000,000
$89,109,564
3.1
$117,500,000
$23,500,000
-80.0%
Killeen Mall
2100 South W S Young Drive Killeen, TX 76543
Regional Mall
$82,000,000
$82,267,263
4.5
$102,500,000
$39,100,000
-61.9%
About CRED iQ
CRED iQ is a commercial real estate data, analytics, and valuation platform providing actionable intelligence to CRE and capital markets investors. Subscribers to CRED iQ use the platform to identify valuable leads for leasing, lending, refinancing, distressed debt, and acquisition opportunities. Our data platform is powered by over $2.0 trillion of CMBS, CRE CLO, SBLL, Ginnie Mae, FHA/HUD, and Agency loan and property data.
CRED iQ was happy to contribute data and analysis to last week’s insightful article in Commercial Observer by @AndrewCoen discussing the impacts of remote working on CMBS debt, and, in particular, loans secured by office properties. CRED iQ provided delinquency rates and special servicing rates for loans secured by office properties for primary markets across the U.S. Additionally, we offered guidance on identifying potential credit risks within the office sector as well as insights into the remote working dynamic. For those our followers that missed the story, below is a link to the article.
The COVID-19 pandemic has thus far not caused any material distress to CMBS office debt. Only 2.89 percent is in either delinquency or special servicing compared to 1.9 percent in 2019, according to data from commercial real estate data firm CRED iQ. Markets with the highest delinquency/special servicing rates including Hartford, Conn. (22.3 percent), St. Louis (19.2 percent), Houston (13.9 percent) and Indianapolis (13.62 percent).”
Marc McDevitt, senior managing director at CRED iQ, noted that delinquency and special servicing rates historically don’t provide guidance for future levels of distress. Lease rollover risk and market vacancy trends are instead better indicators of credit risks. McDevitt said many of the increased vacancies are tied to flight to quality with firms seeking office space with “higher wellness attributes” along with downsizing as companies reevaluate spacing needs amid the evolution of remote working habits.
“The office environment is a concern for CMBS investors in the long term as they monitor the rise in market vacancy rates, especially in [central business district] submarkets,” McDevitt said. “However, corresponding increases in delinquency will likely be delayed due to longer lease terms relative to retail. In the near-to-medium term, investors are likely concerned about pockets of lease rollover for certain assets in specific markets.
For full access to our loan database and valuation platform, sign up for a free trial below:
CRED iQ is a commercial real estate data, analytics, and valuation platform providing actionable intelligence to CRE and capital markets investors. Subscribers to CRED iQ use the platform to identify valuable leads for leasing, lending, refinancing, distressed debt, and acquisition opportunities. Our data platform is powered by over $2.0 trillion of CMBS, CRE CLO, SBLL, Ginnie Mae, FHA/HUD, and Agency loan and property data.
This week, CRED iQ examines the impact of commercial real estate values following a November 18, 2021 announcement by CVS Health regarding its strategic review of its retail business. New initiatives in the healthcare company’s omnichannel health strategy include the closures of 300 retail locations per year over the next 3 years. A total of approximately 900 store closures may be unwelcoming news to commercial real estate investors with CVS as primary tenant — property owners may face uncertain prospects for replacement tenants and the costs of backfilling a former CVS location.
For background, CVS listed a retail portfolio of approximately 80.1 million sf in its 2020 annual report, comprising 8,115 stores. CVS owns about 405 of those locations and leases the remainder as a tenant. Additionally, the company operates pharmacies for nearly 2,000 retail chains, including several grocers as well as Target via a 2015 agreement. Specific locations of stores closures have not yet been announced, but a reduction in store density will likely include overlapping operations in particular markets that may be deemed low growth. CVS locations with near-term lease expirations are candidates for closure, or renegotiations of rental rates; however, in the likely scenario where CVS closes stores prior to lease expiration, we expect the company would continue to honor its rent obligations.
CRED iQ leveraged its platform to identify properties leased to CVS as a single tenant or properties leased to CVS as one the 5 largest tenants by GLA on the property’s rent roll. CRED iQ’s subset of nearly 400 properties with CVS as a Top 5 tenant secures approximately $4 billion in outstanding commercial real estate debt. More than half of the properties, accounting for only 19% of the aggregate securitized debt, are single tenant or net lease properties. Classifying properties by lease expiration date, CRED iQ was further able to isolate properties with CVS lease expirations over the next 3 years as shown in the table below:
Lease Expiration Year
# of Properties
Aggregate Outstanding Balance ($000’s)
2021 or Earlier
11
$291,532
2022
14
$163,782
2023
27
$327,592
2024
24
$341,789
For a copy of the comprehensive list of all CMBS properties with CVS as a Top 5 tenant — including over 200 single tenant locations, please reach out to Shane Beeson (shane@cred-iq.com) or click the link below.
This week’s WAR Report focuses specifically on net lease properties, a property sub-type of retail where the credit quality of a commercial real estate mortgage is often tied to the credit quality of the single tenant’s corporate entity. CVS is a popular tenant among net lease investors because pharmacies qualify as an essential retail use and locations are often centrally located to primary corridors of commerce such as signalized intersections and desirable corner lots. Absent a credit tenant, a property’s location, age, and quality become pertinent factors in evaluating valuation scenarios. Featured properties below include single tenant CVS retail locations with near-term lease expirations or CVS locations that secure loans in special servicing.
The CRED iQ valuations factor in a base-case (expected lease renewal at in-place rent), a downside (lease renewal at 50% reduction in rent), and dark scenarios (100% vacant). Select valuations are provided for the properties below. For full access to the valuation reports including all 3 valuation scenarios as well as full CMBS loan reporting, with detailed financials, updated tenant information, and borrower contact information, sign up for a free trial here.
Solomon CVS Portfolio
37,431 sf, Single Tenant Retail, Texas and Mississippi[View Details]
This $6.8 million loan is secured by a portfolio of 3 single tenant CVS Pharmacy retail stores. Two of the properties are located outside of Dallas, TX and the third property is located outside of Jackson, MS. The CVS location at 1501 Independence Parkway in Plano, TX had a lease expiration on October 26, 2021. CVS was still operational at the location into November; however, store density may be a concern with another CVS located less than 2 miles away. Both stores are well-positioned on corner lots but the competitive CVS benefits from Aldi as a grocery anchor whereas the subject CVS has less compelling demand generators. Other competition in the area includes several Walgreens locations and pharmacies operated by Walmart, Kroger, and Tom Thumb. The property was constructed in 1996 and does not appear to have been renovated.
The CVS in Brandon, MS has a lease expiration in August 2023 and the CVS in Paris, TX has a lease expiration in April 2024. Both locations are strategically located at intersections with minimal cannibalization from proximate CVS locations. Loan maturity is slated for September 6, 2025. For the full valuation report and loan-level details for the CVS Plano property, click here.
10,000 sf, Single Tenant Retail, Goshen, IN[View Details]
This $3.0 million loan transferred to special servicing on February 26, 2020 due to delinquency and an unresponsive borrower. The loan was originated in March 2018 but the borrower has not reported updated financial statements since origination. CVS pays $25/sf at the freestanding building with a lease that expires in January 2038. The borrower estimated sales at the property to be approximately $1,350 per square foot. However, local residents have noted the pharmacy’s inability to stay open regularly throughout the pandemic amid staff shortages. Also notable, there is a Target, which contains a CVS Pharmacy, located 5 miles away that may be the more preferable option in terms of convenience, reliability, and amenities. The property has been listed for sale for $5 million, equal to $500/sf. The long-term lease is a positive factor; however, this particular location may be at risk of having a dark tenant. The property was constructed in 2000. For the full valuation report and loan-level details, click here.
10,125 sf, Single Tenant Retail, Johnson City, NY[View Details]
This 10,125-sf freestanding CVS Pharmacy, located in Johnson City, NY, is part of a 2-property portfolio that serves as collateral for a $3.8 million loan. The property’s lease with CVS expires on January 31, 2024, which is within the company’s 3-year timeframe for closures. The building, which was constructed in 1998, is one of the oldest single tenant CVS locations within CRED iQ’s database. The property’s location is on a main thoroughfare but is inferior to a neighboring Walgreens, which has a dedicated turning lane and a three-way junction. This particular CVS location on Main Street also competes with another CVS Pharmacy, located less than a mile away; although the Main Street pharmacy is more proximate to a UHS medical center, which is part of the region’s primary healthcare system, and several medical offices. Loan maturity is scheduled for August 6, 2025. For the full valuation report and loan-level details, click here.
This $1.5 million loan is secured by a 10,125-sf freestanding CVS Pharmacy in Akron, OH. The loan was added to the servicer’s watchlist in August 2019 with commentary stating that CVS vacated at lease expiration in January 2020; however, additional servicer data offers a contradictory lease expiration date of January 31, 2025, which is in the final year of announced store closures. CRED iQ confirmed the 780 Brittain Road location was operational shortly following the closure announcement; however financial statements for year end 2020 indicate base rent was reduced by approximately 32% compared to the prior year. The property shares a signalized intersection with Walgreens. A superior CVS with more flexible store hours is located only 1.5 miles away in an Acme-anchored shopping center. The property was constructed in 1999. For the full valuation report and loan-level details, click here.
13,824 sf, Single Tenant Retail, Conroe, TX[View Details]
This $364,000 loan is secured by a CVS Pharmacy in Conroe, TX, located approximately 40 miles north of Houston. CVS has a lease expiration in October 2022. The near-term lease expiration suggests the Conroe location is a candidate for closure. The property competes with 3 Walgreens stores within a 5 miles radius but there are no other CVS locations in the area. One option for CVS is to open a Pharmacy or MinuteClinic in a neighboring Target, which was last remodeled in 2018. The Conroe location was constructed in 2002. For the full valuation report and loan-level details, click here.
CRED iQ is a commercial real estate data, analytics, and valuation platform providing actionable intelligence to CRE and capital markets investors. Subscribers to CRED iQ use the platform to identify valuable leads for leasing, lending, refinancing, distressed debt, and acquisition opportunities. Our data platform is powered by over $2.0 trillion of CMBS, CRE CLO, SBLL, Ginnie Mae, FHA/HUD, and Agency loan and property data.
The CRE Data, Analytics, and Valuation platform has entered the Operating Advisor business within the CMBS Industry
RADNOR, Pa. – CRED iQ, a data, analytics and valuation platform serving the commercial real estate finance and investment communities announced its expansion into the Operating Advisory business for Commercial Mortgage-Backed Securities (CMBS). The Operating Advisor role was introduced to the industry post financial crisis to review Asset Status Reports for defaulted loans, evaluate proposals by the special servicer in handling defaults, and recalculate appraisal reduction amounts. Additional responsibilities are triggered once a Control Termination Event occurs within a transaction.
As part of its newly expanded role, CRED iQ made critical hires of industry veterans, Jim Reed and Marc McDevitt. Jim Reed has over 15 years of asset management and workout experience with Oppenheimer and Capmark. Marc McDevitt was a senior member of Kroll Bond Rating Agency (KBRA) where he led a team of analysts tasked with identifying, monitoring and valuing distressed commercial properties.
CRED iQ Co-Founder Bill Petersen explains “Moving into the Operating Advisor role was a natural progression for the platform since we are already monitoring and valuing distressed assets across the CMBS universe. We often identify loans at risk of default long before they become delinquent or transfer to the special.” Prior to Co-founding CRED iQ, Petersen ran the CMBS Ratings Surveillance group for Kroll Bond Rating Agency. “We have decades of experience with identifying, monitoring, and valuing risky assets, as well as a deep understanding of CMBS structures and processes. We look forward to drawing upon our experience to inform our discussions with the servicers.”
“We are thrilled to have Jim and Marc join CRED iQ and help us expand into a new business line that serves the CMBS industry”, said CRED iQ Co-Founder, Michael Haas.
CRED iQ is a commercial real estate data, analytics and valuation platform serving professionals across the CRE investment, brokerage, and lending industries. Updated monthly, CRED iQ’s robust database is powered by over $2.0 trillion of loan and property data from the securitized universe. CRED iQ tracks data on CMBS Conduit, SBLL, CRE CLO, and Agency debt combined with verified borrower and true ownership contact details.
CMBS conduit issuance through mid-November 2021 totaled approximately $26.4 billion as the market gears up for a final push to close out the year. Parsing out issuance and origination trends for loans securitized in 2021 conduit deals provides insight into the commercial real estate lending landscape across all major property types.
Evaluating YTD 2021 conduit issuance by property type concentration reveals a heavy preference for office collateral, which made up 33% of total securitized conduit debt. Office was followed by retail, multifamily, industrial, and mixed-use, respectively, in conduit issuance through mid-November 2021. Hotel collateral significantly lagged these property types based on pandemic-related concerns. Retail may come as a surprise for its showing as second-overall in issuance with $5.3 billion; however, long gone are frequent originations of massive debt packages secured by super-regional malls. Instead, retail originations now comprise more net lease portfolios and grocery-anchored centers. There are two malls securing notes that were securitized in 2021; however, both loans — Kings Plaza and The Westchester — were originated in December 2019 and January 2020, respectively. Retail loans were generally seasoned for twice as long as office loans before being securitized. About 20% of the retail loans securitized in 2021 conduit deals were originated in 2019 or 2020, indicating investors’ higher perception of credit risk associated with the collateral.
Seasoning has become more common for the 2021 vintage with lenders holding on to loans comparatively longer than in the past. Approximately 20% of CMBS conduit loans securitized this year were originated prior to 2021. Seasoning was especially noticeable for loans secured by lodging properties with 78% of originations occurring prior to July 1, 2020. The most severe example was a $6.3 million loan that was originated in October 2018, secured by a hotel located in NJ, within the Philadelphia, PA MSA. After two modifications and, presumably, improved collateral performance since the onset of the pandemic, the loan was sold to a CMBS securitization. On average, hospitality loans were seasoned 9 months before securitization, which was by far the longest among all property types. Self-Storage and Industrial loans were the quickest between origination and securitization with an average just under one month.
Exploring loan and property metrics a bit further for 2021 CMBS conduit issuance again puts the spotlight on lodging loans. CRED iQ examined four primary loan and property metrics for each major property type and found that hospitality loans, on average, were structured the most conservatively. Interest rates for lodging loans were the second highest at a weighted average of 3.79%, trailing only manufactured housing loans. Hotel loans had the lowest LTVs among 2021 issuance, which may be derived from several factors, including value depreciation since April 2020, stricter underwriting requirements by originators, and lenders’ overall wariness of the risks associated with a property type that was hit hardest by the pandemic. Lenders’ risk appetite for hotel loans is further evidenced by weighted average debt yield metrics. Loans secured by lodging assets had a debt yield of 15.86%, which was at least 500 basis points greater than the next highest property type, office, with a 10.69% weighted average debt yield.
Loan and Property Metrics for 2021 YTD CMBS Conduit Issuance
WA Interest Rate
WA LTV
WA Debt Yield (UW NCF)
WA Implied Cap Rate (UW NCF)
Office
3.30%
54.47%
10.69%
4.29%
Retail
3.61%
57.63%
10.55%
5.38%
Multifamily1
3.70%
60.99%
8.53%
4.54%
Industrial
3.51%
57.40%
10.08%
4.31%
Mixed Use1
3.42%
56.77%
9.48%
3.98%
Self Storage
3.58%
59.29%
9.83%
4.92%
Hospitality
3.79%
49.02%
15.86%
7.10%
Other
3.43%
49.86%
8.42%
4.03%
Manufactured Housing
4.09%
57.56%
9.78%
4.60%
1 Excludes Cooperatives * Through November 17, 2021
Using appraisal values from origination and the originators’ underwritten net cash flow, CRED iQ calculated implied capitalization rates for each sector and the results were consistent with previously examined loan metrics. The weighted average cap rate for lodging collateral was 7.10%, which was considerably higher than the next highest, retail, at 5.38%. Mixed-use properties had the lowest weighted average cap rate at 3.98%. Much of the mixed-use collateral consisted of properties with a multifamily component located in a gateway or primary market, contributing to comparatively lower cap rates. Additionally, industrial and office collateral had relatively low cap rates compared to most property types, averaging about 4.30%. With year-end 2021 quickly approaching, we don’t expect to see meaningful variation from the highlighted metrics in newly securitized conduit loans; although, collateral mix and originators’ comfort levels with hospitality will continue to be closely monitored.
About CRED iQ
CRED iQ is a commercial real estate data, analytics, and valuation platform providing actionable intelligence to CRE and capital markets investors. Subscribers to CRED iQ use the platform to identify valuable leads for leasing, lending, refinancing, distressed debt, and acquisition opportunities. Our data platform is powered by over $2.0 trillion of CMBS, CRE CLO, SBLL, Ginnie Mae, FHA/HUD, and Agency loan and property data.
Freddie Mac loans secured by distressed properties are sources for opportunities within the multifamily sector that include traditional garden-style and high-rise as well as multiple property sub-types, including student housing and senior housing properties that were among those highlighted this week. Mortgage originators, distressed investors, and commercial brokers are able to search CRED iQ’s database of approximately 26,000 Freddie Mac loans totaling $336 billion in outstanding debt for their next opportunity. The properties featured in this week’s WAR Report secure a subset of distressed Freddie Mac loans across multiple primary markets, including Philadelphia, San Diego, San Antonio, and Los Angeles. This week, CRED iQ calculated real-time valuations for 5 distressed multifamily properties that secure Freddie Mac loans. Click the link below for a list of all multifamily properties.
CRED iQ valuations factor in base-case (Most Likely), downside (significant loss of tenants), and dark scenarios (100% vacant). For full access to the valuation reports as well as full CMBS loan reporting, including detailed financials, updated tenant information, and borrower contact information, sign up for a free trial here.
This $40.1 million loan transferred to special servicing on October 28, 2020 and has been over 90 days delinquent since. CWCapital, as special servicer, has filed for receivership multiple times but the motions were denied. A short-term forbearance agreement was initially agreed upon in April 2021 at the onset of the pandemic but the property’s poor performance can be traced back to pre-pandemic operational struggles. For this reason, the borrower’s request for an extension of forbearance after the initial 3-month period was denied. Workout of the loan is ongoing and the special servicer appears to be continuing with its strategy of foreclosure.
The mortgage is secured by a 9-story, 265-unit loft-style multifamily property in the Fairmount submarket of Philadelphia. Occupancy at the property started to show declines in 2016 when it dropped to 91 from 96%. Occupancy then continued to decline below 90% in the following years and was as low as 75% during the pandemic before recovering to 97% as of September 2021. Additionally, the property benefitted from a 10-year real estate tax abatement from the City of Philadelphia that expired at year-end 2016. In 2017, unabated real estate taxes increased nearly 5x to approximately $769,000. By the end of 2019, net cash flow from the property was not sufficient to cover the loan’s debt service.
The property appraised for $53.9 million ($203,396/unit) in February 2021, which represented a 14% decline in value compared to the property’s 2011 appraisal. For the full valuation report and loan-level details, click here.
This $24.6 million loan transferred to special servicing on February 3, 2021 after failing to stay current following the end of a forbearance period. An initial forbearance agreement was granted in September 2020 to provide COVID relief and the payback period was scheduled to begin in December 2020; however, the tenants-in-common borrowing entity did not make any repayments. The loan became severely delinquent for several months after it transferred to special servicing. CWCapital, as special servicer, reached an agreement with the borrower to cure the loan and a second forbearance agreement was signed in September 2021. The loan has been current in payment in accordance with the terms of the forbearance since the second agreement was executed. The window for clearing up credit issues for this loan is getting shorter with loan maturity scheduled for January 2023.
The loan is secured by a 186-unit student housing facility located in Waco, TX. The property contains 564 beds and provides housing to students enrolled at Baylor University, which is located about 1.5 miles away. Despite receiving COVID-related forbearance, the property has had occupancy issues prior to the pandemic and was 70% occupied in 2019. Newer housing options and locations closer to campus were reasons cited for low occupancy. Occupancy appears to have recovered for the 2021 academic year and was most recently reported as 97% as of October 2021. The property was appraised for $23.2 million ($41,135/bed) in February 2021, which represented a 34% decline in value compared to the property’s August 2015 appraisal at origination. For the full valuation report and loan-level details, click here.
60 units, Assisted Living Facility, San Diego, CA[View Details]
This $9.8 million loan has had delinquency issues since July 2021 and was most recently over 90 days delinquent in November. The loan is secured by a 60-unit senior living facility in San Diego, CA that provides memory care and specialized assisted living accommodations. The loan first became delinquent after a 3-month forbearance period ended in May 2021. A second forbearance period was agreed upon by the servicer and the relief period appears to have been extended. Occupancy at the property was 37% as of July 2021, which is a reflection of the severe impact from the pandemic. However, the borrower has stated plans to partner with local non-profits to provide residential housing to those in need of assisted living care. Contract revenue from such a partnership may aid in the property’s stabilization as forbearance is repaid over the next 24 months. For the full valuation report and loan-level details, click here.
This 75-unit multifamily property in northeast San Antonio, TX is facing foreclosure due to payment default on a $4.9 million mortgage. The loan transferred to special servicing in August 2021 and the foreclosure sale is scheduled for December 2021. A 3-month forbearance agreement for the loan had been signed in March 2021 but the borrower was unable to keep up with repayments starting in June 2021. Occupancy at the property was impacted by the pandemic and declined to as low as 72% during 2020 before recovering to 91% as of June 2021. For the full valuation report and loan-level details, click here.
This $2.6 million loan transferred to special servicing on November 4, 2021 due to delinquency. The loan is secured by a 10-unit multifamily building in the Echo Park neighborhood of central Los Angeles. The 2-story property is built into a hillside and is located just off Sunset Boulevard, in close proximity to Dodgers Stadium. The mortgage, which was 60 days delinquent as of November, is still in the early stages of workout. The property was 100% occupied as of year-end 2020; however, updated occupancy and performance figures were not yet reported for 2021. For the full valuation report and loan-level details, click here.
CRED iQ is a commercial real estate data, analytics, and valuation platform providing actionable intelligence to CRE and capital markets investors. Subscribers to CRED iQ use the platform to identify valuable leads for leasing, lending, refinancing, distressed debt, and acquisition opportunities. Our data platform is powered by over $2.0 trillion of CMBS, CRE CLO, SBLL, Ginnie Mae, FHA/HUD, and Agency loan and property data.
CRED iQ monitors distressed rates (DQ + SS%) and market performance for nearly 400 MSAs across the United States, covering over $900 billion in outstanding CRE debt. Distressed rates for the current month and month-over-month changes are presented below, by property type, for the 50 largest markets. The lodging sector continues to be the most volatile, accounting for four of the 10 largest percentage increases in distress by market-sector and five of the 10 biggest percentage decreases in distress by market-sector.
The retail market in Nashville exhibited the highest increase in distress this month, which was caused by the transfer of a $155 million mortgage secured by regional mall CoolSprings Galleria to special servicing. The loan transferred to special servicer due to the bankruptcy of the loan sponsor, CBL Properties. Another notable market sector was Chicago office, which saw its distress rate increase 3.6% to 9.2%. The increase in Chicago office distress was primarily driven by 175 West Jackson, which secures a $280 million mortgage that recently transferred to special servicing.
The Austin hotel market exhibited the greatest month-over-month improvement following a positive development with one of the city’s most prominent hotels. The Fairmont Austin, which secures a $300 million mortgage, returned to the master servicer following a modification.
The Top 5 distressed markets remained unchanged from the prior month. The Minneapolis MSA has the highest overall distressed rate at 23.7%. Louisville (21.1%), New Orleans (14.8%), Cleveland (12.1%), and Milwaukee (10.7%) round out the list of markets with the highest rates of distress. The Allentown and Sacramento MSAs have the lowest percentage of distress among the Top 50 with rates less than 1%.