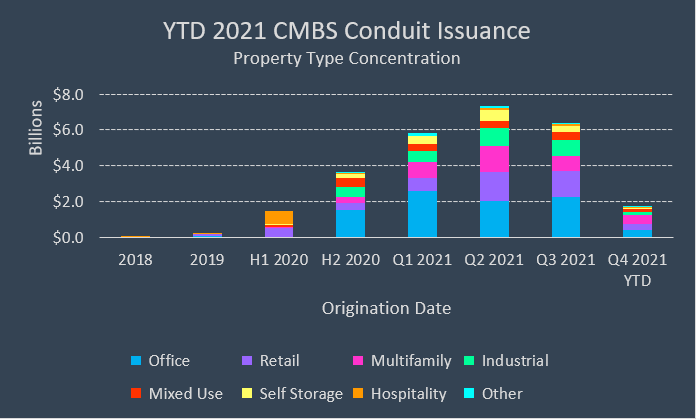
CMBS conduit issuance through mid-November 2021 totaled approximately $26.4 billion as the market gears up for a final push to close out the year. Parsing out issuance and origination trends for loans securitized in 2021 conduit deals provides insight into the commercial real estate lending landscape across all major property types.
Evaluating YTD 2021 conduit issuance by property type concentration reveals a heavy preference for office collateral, which made up 33% of total securitized conduit debt. Office was followed by retail, multifamily, industrial, and mixed-use, respectively, in conduit issuance through mid-November 2021. Hotel collateral significantly lagged these property types based on pandemic-related concerns. Retail may come as a surprise for its showing as second-overall in issuance with $5.3 billion; however, long gone are frequent originations of massive debt packages secured by super-regional malls. Instead, retail originations now comprise more net lease portfolios and grocery-anchored centers. There are two malls securing notes that were securitized in 2021; however, both loans — Kings Plaza and The Westchester — were originated in December 2019 and January 2020, respectively. Retail loans were generally seasoned for twice as long as office loans before being securitized. About 20% of the retail loans securitized in 2021 conduit deals were originated in 2019 or 2020, indicating investors’ higher perception of credit risk associated with the collateral.
Seasoning has become more common for the 2021 vintage with lenders holding on to loans comparatively longer than in the past. Approximately 20% of CMBS conduit loans securitized this year were originated prior to 2021. Seasoning was especially noticeable for loans secured by lodging properties with 78% of originations occurring prior to July 1, 2020. The most severe example was a $6.3 million loan that was originated in October 2018, secured by a hotel located in NJ, within the Philadelphia, PA MSA. After two modifications and, presumably, improved collateral performance since the onset of the pandemic, the loan was sold to a CMBS securitization. On average, hospitality loans were seasoned 9 months before securitization, which was by far the longest among all property types. Self-Storage and Industrial loans were the quickest between origination and securitization with an average just under one month.
Exploring loan and property metrics a bit further for 2021 CMBS conduit issuance again puts the spotlight on lodging loans. CRED iQ examined four primary loan and property metrics for each major property type and found that hospitality loans, on average, were structured the most conservatively. Interest rates for lodging loans were the second highest at a weighted average of 3.79%, trailing only manufactured housing loans. Hotel loans had the lowest LTVs among 2021 issuance, which may be derived from several factors, including value depreciation since April 2020, stricter underwriting requirements by originators, and lenders’ overall wariness of the risks associated with a property type that was hit hardest by the pandemic. Lenders’ risk appetite for hotel loans is further evidenced by weighted average debt yield metrics. Loans secured by lodging assets had a debt yield of 15.86%, which was at least 500 basis points greater than the next highest property type, office, with a 10.69% weighted average debt yield.
Loan and Property Metrics for 2021 YTD CMBS Conduit Issuance
| WA Interest Rate | WA LTV | WA Debt Yield (UW NCF) | WA Implied Cap Rate (UW NCF) | |
| Office | 3.30% | 54.47% | 10.69% | 4.29% |
| Retail | 3.61% | 57.63% | 10.55% | 5.38% |
| Multifamily1 | 3.70% | 60.99% | 8.53% | 4.54% |
| Industrial | 3.51% | 57.40% | 10.08% | 4.31% |
| Mixed Use1 | 3.42% | 56.77% | 9.48% | 3.98% |
| Self Storage | 3.58% | 59.29% | 9.83% | 4.92% |
| Hospitality | 3.79% | 49.02% | 15.86% | 7.10% |
| Other | 3.43% | 49.86% | 8.42% | 4.03% |
| Manufactured Housing | 4.09% | 57.56% | 9.78% | 4.60% |
* Through November 17, 2021
Using appraisal values from origination and the originators’ underwritten net cash flow, CRED iQ calculated implied capitalization rates for each sector and the results were consistent with previously examined loan metrics. The weighted average cap rate for lodging collateral was 7.10%, which was considerably higher than the next highest, retail, at 5.38%. Mixed-use properties had the lowest weighted average cap rate at 3.98%. Much of the mixed-use collateral consisted of properties with a multifamily component located in a gateway or primary market, contributing to comparatively lower cap rates. Additionally, industrial and office collateral had relatively low cap rates compared to most property types, averaging about 4.30%. With year-end 2021 quickly approaching, we don’t expect to see meaningful variation from the highlighted metrics in newly securitized conduit loans; although, collateral mix and originators’ comfort levels with hospitality will continue to be closely monitored.
About CRED iQ
CRED iQ is a commercial real estate data, analytics, and valuation platform providing actionable intelligence to CRE and capital markets investors. Subscribers to CRED iQ use the platform to identify valuable leads for leasing, lending, refinancing, distressed debt, and acquisition opportunities. Our data platform is powered by over $2.0 trillion of CMBS, CRE CLO, SBLL, Ginnie Mae, FHA/HUD, and Agency loan and property data.


