SS = All specially serviced CMBS loans in the conduit and SASB universe, including current, delinquent and REO
DQ + SS = All distressed CMBS loans in the conduit and SASB universe that are delinquent, specially serviced, or a combination of both
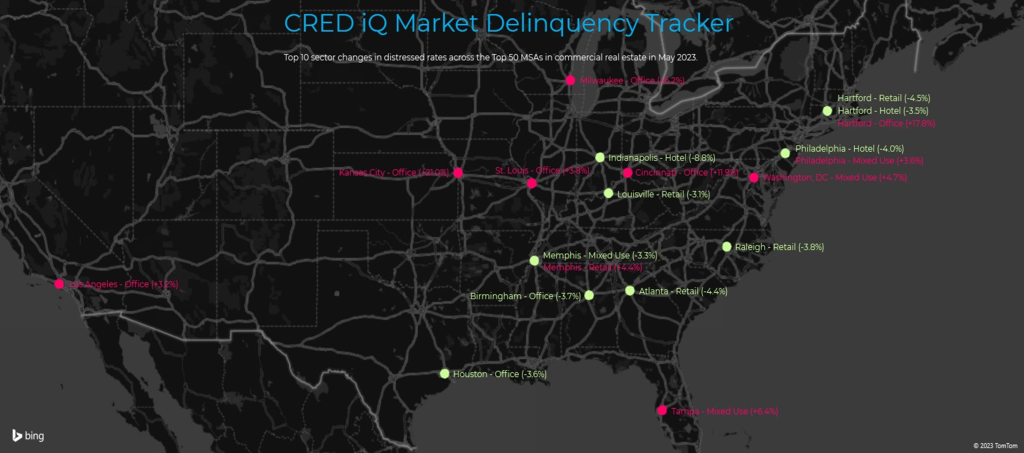
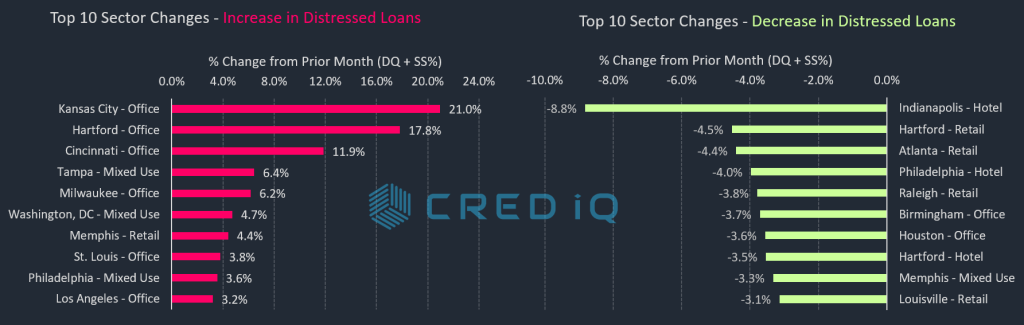
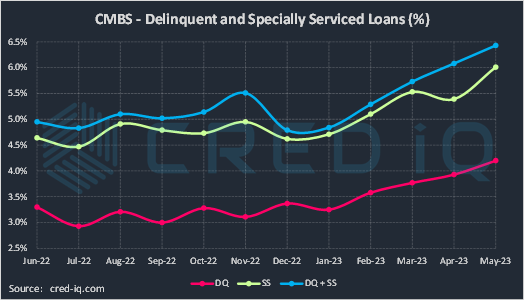
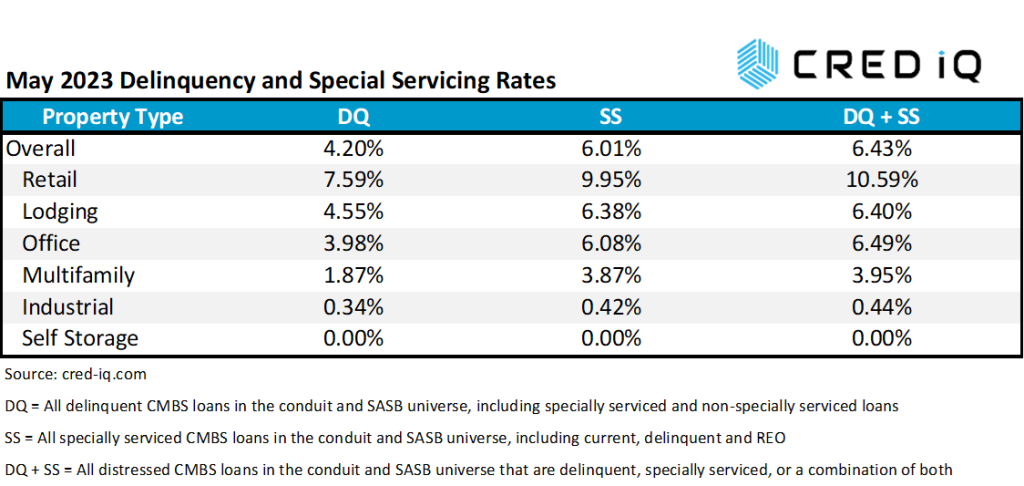
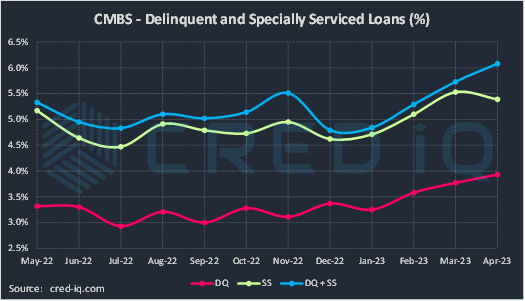
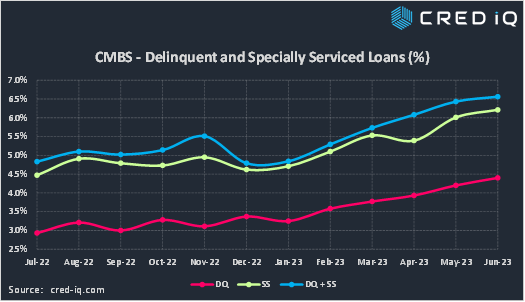
The CRED iQ delinquency rate for CMBS for June 2023 increased for the fifth consecutive month to 4.40%. The delinquency rate was 20 basis points higher than the prior month’s rate of 4.20%, equal to a 5% increase. CMBS delinquency is at its highest level since the end of 2021. Over $4 billion in aggregate CMBS debt was reported as newly delinquency as of June 2023, and over 80% of newly delinquent loans by outstanding balance was attributed to maturity defaults or refinancing issues. The delinquency rate is equal to the percentage of all delinquent specially serviced loans and delinquent non-specially serviced loans, for CRED iQ’s sample universe of $600+ billion in CMBS conduit and single asset single-borrower (SASB) loans. CRED iQ’s special servicing rate, equal to the percentage of CMBS loans that are with the special servicer (delinquent and non-delinquent), increased month-over-month to 6.21%, from 6.01%. The special servicing rate has climbed in five out of six months so far in 2023. Aggregating the two indicators of distress – delinquency rate and special servicing rate – into an overall distressed rate (DQ + SS%) equals 6.56% of CMBS loans that are specially serviced, delinquent, or a combination of both. Last month’s distressed rate was equal to 6.43%, which was 13 basis points lower than the June 2023 distressed rate. The month-over-month increase in the overall distressed rate mirrors increases in the delinquency and special servicing rates. Distressed rates generally track slightly higher than special servicing rates as most delinquent loans are also with the special servicer.
SS = All specially serviced CMBS loans in the conduit and SASB universe, including current, delinquent and REO
DQ + SS = All distressed CMBS loans in the conduit and SASB universe that are delinquent, specially serviced, or a combination of both
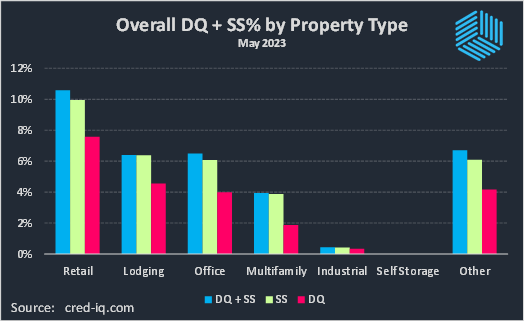
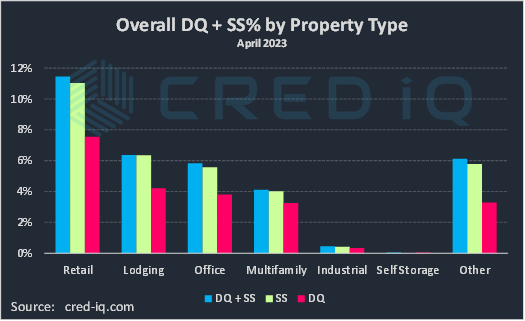
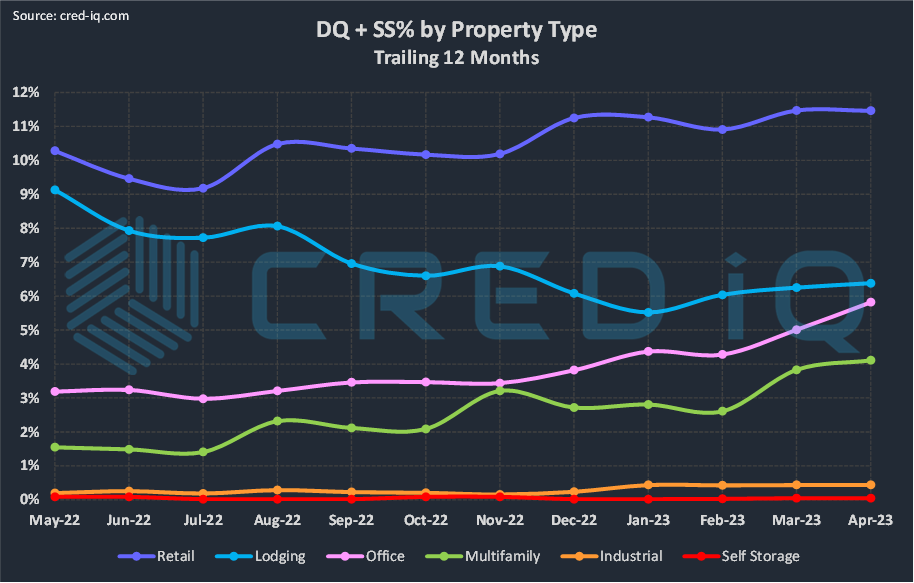
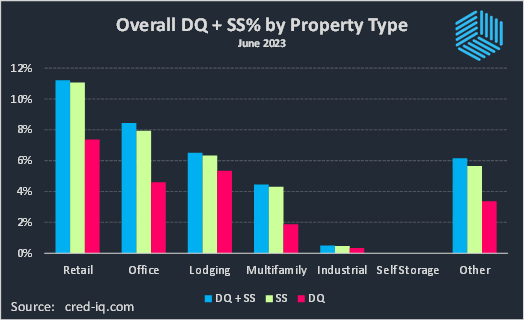
By property type, distress in the office sector continued to build in June 2023. The office delinquency rate increased to 4.60%, which compared to 3.98% as of May 2023. The month-over-month surge of 62 basis points in office delinquency was equal to a 16% increase. Comparing data across the trailing 12 months, the delinquency rate for office is nearly 2.5X higher than July 2022. The natural progression of long to intermediate-term rolling leases coupled with ongoing refinancing difficulties at loan maturity have caused the velocity of new delinquencies to accelerate during the first half of 2023.
One of the largest contributors to the spike in office delinquency during June 2023 was the maturity default of a $691 million mortgage secured by a 2.1 million-SF office portfolio in Rosslyn, VA. In addition to the senior mortgage, financing for the Rosslyn Office Portfolio also included $150 million in mezzanine debt. The floating-rate loan transferred to special servicing shortly after its initial maturity date in May 2023. The loan was structured with three, one-year extension options but the borrower was constrained in its ability to execute an extension and refinancing was even less plausible.
The delinquency rate for lodging properties exhibited a similar one-month surge to the office sector. Hotel delinquency for June 2023 measured at 5.34%, up from 4.55% in May. The increase is June is attributed to several untimely maturity defaults, including Holiday Inn – 6th Avenue, a 226-key hotel in Manhattan, NY that secures a $72.8 million mortgage. The loan failed to pay off at maturity, but the borrower requested a two-year extension. Rounding out delinquency rates for remaining property types, retail delinquency (7.37%) declined from May to June. Multifamily delinquency (1.87%) and industrial delinquency (0.33%) were flat month over month while self-storage delinquency was negligible.
From the perspective of special servicing rates, distress in the office sector maintained position as the dominant theme. The office special servicing rate as of June 2023 was 7.95%, which represented a 31% increase from May 2023’s office special servicing rate of 6.08%. Maturity defaults and refinancing risk are forces that need to be worked though — both of these reasons were the primary citations for newly transferred office loans. A high-profile example included a $310 million mortgage secured by the 1.3 million-SF River North Point office property in Chicago, IL.
Aside from the office sector, the special servicing rate for retail loans declined to 9.95%, compared to 11.04% as of May 2023. The special servicing rate for loans secured by lodging properties (6.33%) also declined compared to May 2023. The special servicing rates for multifamily (4.31%) and industrial (0.47%) both exhibited month-over-month increases. There was no self-storage specially serviced inventory.
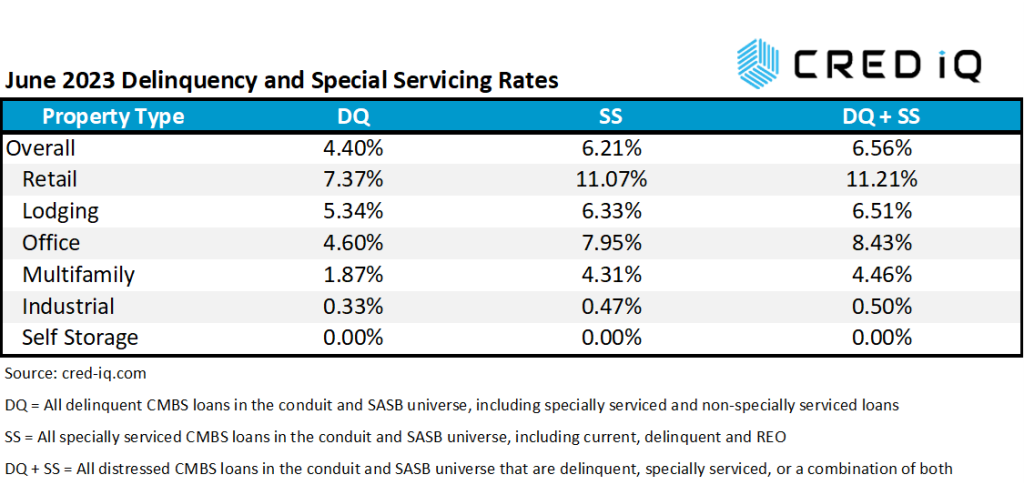
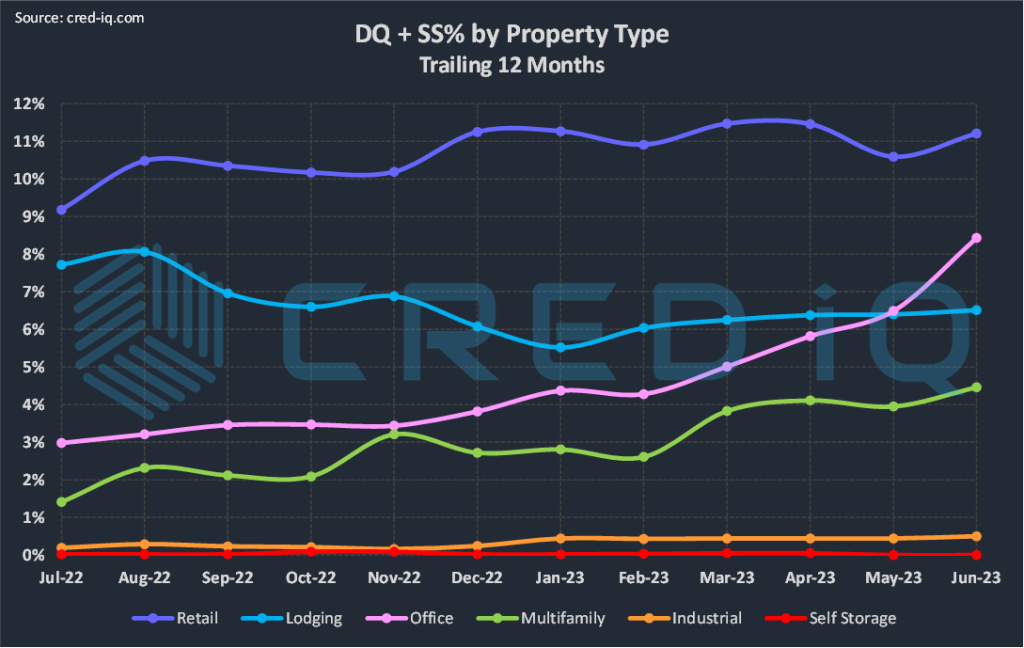
CRED iQ’s CMBS distressed rate (DQ + SS%) by property type accounts for loans that qualify for either delinquent or special servicing subsets. This month, the overall distressed rate for CMBS increased to 6.56%. The increase was 13 basis points higher than May’s distressed rate (6.43%), equal to a 2% increase. A severely limited refinancing market for office properties and a ‘higher for longer’ interest rate environment continue to contribute to sustained increases in commercial real estate distress.
For additional information about two of this month’s largest loans that became distressed, click View Details below:
| [View Details] | [View Details] | |
| Loan | River North Point | Holiday Inn – 6th Avenue |
| Balance | $310 million | $72.8 million |
| Special Servicer Transfer Date | 5/11/2023 | NAP |
About CRED iQ
CRED iQ is a commercial real estate data, analytics, and valuation platform providing actionable intelligence to CRE and capital markets investors. Subscribers use the platform to identify valuable leads for leasing, lending, refinancing, distressed debt, and acquisition opportunities.
The platform also offers a highly efficient valuation engine which can be leveraged across all property types and geographies. Our data platform is powered by over $2.0 trillion in transactions and data covering CRE, CMBS, CRE CLO, Single Asset Single Borrower (SASB), and all of GSE / Agency.