Home Blog Page 28

Non-Performing Matured Loans

0

This week, CRED iQ reviewed real-time valuations for several assets that secure non-performing matured loans. Maturity defaults often can be a result of distress but may also be a mismatch in the timing of a refinancing effort or a sale closing. Non-performing matured loans are opportunities for distressed investors to step in and infuse capital in situations where traditional solutions may not be an option. Most of this week’s loans are secured by various subtypes of retail properties, including a distressed regional mall in northern Washington and a trio of Manhattan ground-floor retail buildings.

CRED iQ valuations factor in a base-case (most likely), a downside (significant loss of tenants), and dark scenarios (100% vacant). For full access to the valuation reports as well as full CMBS loan reporting, with detailed financials, updated tenant information, and borrower contact information, sign up for a free trial here.

Bellis Fair Mall

538,226 sf, Regional Mall, Bellingham, WA  [View Details]

This $76.5 million loan failed to pay off at its February 6, 2022 maturity date after the borrower, Brookfield Property Partners, was unable or unwilling to secure refinancing. The loan transferred to special servicing shortly after its maturity default. All workout options appear to be on the table including receivership, foreclosure, discounted payoff scenarios, or a modification agreement that could potentially delay any resolution for an extended period. However, Brookfield Property Partners has established a willingness to cooperate in the conveyance of title for properties with similar credit issues, including examples such as the Florence Mall in January 2021 and the imminent foreclosure of the Pierre Bossier Mall. Bellis Fair Mall was featured in CRED iQ’s March 2022 Delinquency Report as one of the largest new loans to recently transfer to special servicing.

The loan is secured by 538,226 sf of in-line and anchor space at the 776,000-sf Bellis Fair Mall in Bellingham, WA, which is approximately 50 miles southeast of Vancouver BC, Canada. Traditional department store anchors for the mall include Macy’s, Target, Kohl’s, and JCPenney. Of those, only the Macy’s box serves as collateral for the mortgage. Junior anchors include Dick’s Sporting Goods and Ashley Furniture HomeStore – both of which occupy space that was repositioned from a vacant former Sears parcel. Even with established anchor boxes and repositioning of junior anchors, Bellis Fair Mall has struggled with in-line occupancy throughout the pandemic. Many in-line tenants had termination options tied to sales targets, which were triggered during the pandemic, causing a high volume of tenant departures. Additionally, mall foot traffic was partially reliant on cross-border visitors from Canada, which was disrupted by pandemic lockdowns. CRED iQ estimates in-line occupancy declined to approximately 68% from a pre-pandemic level of about 80%. For the full valuation report and loan-level details, click here.

Property NameBellis Fair Mall
Address1 Bellis Fair Parkway
Bellingham, WA 98226
Outstanding Balance$76,502,895
Interest Rate5.23%
Maturity Date2/6/2022
Most Recent Appraisal$145,000,000 ($269/sf)
Most Recent Appraisal Date11/30/2011

Anchorage Hotel Portfolio

264 keys, Hotel, Anchorage, AK  [View Details]

Three loans with an aggregate outstanding balance of $11 million failed to pay off at maturity on April 6, 2022. The collateral properties, three limited-service hotels, were severely impacted by the pandemic and were not fully stabilized by the time maturity balloon payments were due. All three loans share the same borrower and transferred to special servicing in June 2020. The latest commentary from the loan’s special servicer indicates the borrower received a financing commitment from Northrim Bank to fully satisfy the loans’ outstanding balances. Based on LTVs, cited by servicer commentary, from 40% to 60% and November 2021 appraisals for each of the properties, the estimated refinancing package would total approximately $10.2 million, which is still a deficit from the aggregate debt amount.

The three hotel properties secured three individual loans, although two of the loans are cross-collateralized and cross-defaulted. Two of the hotels — Motel 6 and Comfort Inn Ship Creek — represent a leasehold ownership interest and the third hotel, Microtel Inn and Suites, represents a fee simple ownership interest. All three hotels were appraised for an aggregate value of $18.8 million in November 2021, equal to $71,212/key, which represented a 22% decline from origination appraisals. For the full valuation report and loan-level details, click here.

Property NameSize (keys)AddressOutstanding BalanceCRED iQ Base-Case Value
Motel 6855000 A Street
Anchorage, AK 99503
$4,080,333$5,630,000 ($66,230/key)
Comfort Inn Ship Creek100111 Ship Creek Avenue
Anchorage, AK 99501
$3,452,590$6,402,000 ($64,019/key)
Microtel Inn and Suites795205 Northwood Drive
Anchorage, AK 99517
$3,452,590$4,774,000 ($60,434/key)

Ocean East Mall

112,260 sf, Retail, Stuart, FL  [View Details]

This $9.1 million loan failed to pay off at its April 1, 2022 maturity date. Prior to the maturity default, the loan transferred to special servicing in February 2020 due to imminent default, following a decline in collateral occupancy. The loan remained current in payment from the time of its transfer to special servicing until its maturity date. The borrower’s commitment to keeping the loan current until maturity, despite collateral occupancy issues, was a positive signal for a potential scenario with a full payoff. However, the maturity default may expedite negotiations between the borrower and special servicer towards a less favorable resolution where the special servicer may pursue foreclosure if the borrower is uncooperative.

The loan is secured by a 112,260-sf retail center in Stuart, FL. The property’s largest tenant, Martin Diagnostic Center, vacated at lease expiration in November 2019. The tenant occupied 42,011 sf of space, accounting for 37% of the property’s NRA. Occupancy declined to approximately 45% after the property’s anchor tenant vacated. Medical office tenants may be a possibility for a potential backfill of the vacant anchor space given its former use and prevalence of medical tenants in the immediate market. For the full valuation report and loan-level details, click here.

Property NameOcean East Mall
Address2300 SE Ocean Blvd
Stuart, FL 34996
Outstanding Balance$9,119,304
Interest Rate5.26%
Maturity Date4/1/2022
Most Recent Appraisal$18,500,000 ($165/sf)
Most Recent Appraisal Date2/16/2012

929 – 933 Broadway

13,349 sf, High Street Retail, New York, NY  [View Details]

This $7.9 million loan failed to pay off at its April 10, 2022 maturity date. Prior to the maturity default, there were negotiations between the borrower, Thor Equities, and the loan’s special servicer regarding forbearance. The loan transferred to special servicing in September 2020 but returned to the master servicer in April 2021 without a modification. Updated servicer data indicates the workout situation has possibly been resolved and the borrower may have secured refinancing. Even if the loan pays off in the near term, the collateral properties could still be for sale. The property at 933 Broadway was reportedly under contract to be sold in early-2020 before the pandemic caused the deal to fall through.

The loan collateral consists of three, three-story retail buildings located in the Flatiron District of Manhattan, NY. The properties were 100% occupied as of year-end 2020 but some tenants were unable to pay rent at the time. A few struggling tenants vacated, and the properties were 63% occupied for most of 2021. For the full valuation report and loan-level details, click here.

Property Name933 Broadway
Address929 – 933 Broadway
New York, NY 10017
Outstanding Balance$7,886,298
Interest Rate5.51%
Maturity Date4/10/2022
Most Recent Appraisal$15,800,000 ($1,184/sf)
Most Recent Appraisal Date1/25/2012

Hickory Glen Apartments

129 units, Senior Housing, Springfield, IL  [View Details]

This $7.5 million loan failed to pay off at maturity on February 6, 2022. The loan transferred to special servicing in January 2022 in anticipation of the maturity default. The workout plan appears to be to sell the collateral property. The borrower had attempted to sell the senior housing facility in the months leading up to the loan’s maturity, but the few offers that came in were below the outstanding debt amount.

The loan is secured by a 129-unit senior housing facility in Springfield, IL. Occupancy at the property declined from a pre-pandemic level of 81% to approximately 56% as of September 2021. Cash flow from the property was sufficient for a DSCR of 1.54 during 2020 but the loan’s DSCR declined to below breakeven levels in 2021. For the full valuation report and loan-level details, click here.

Property NameHickory Glen Apartments
Address1700 West Washington Street
Springfield, IL 62702
Outstanding Balance$7,518,473
Interest Rate5.65%
Maturity Date2/6/2022
Most Recent Appraisal$12,900,000 ($100,000/unit)
Most Recent Appraisal Date12/2/2011

For full access to our loan database and valuation platform, sign up for a free trial below:

About CRED iQ

CRED iQ is a commercial real estate data, analytics, and valuation platform providing actionable intelligence to CRE and capital markets investors. Subscribers to CRED iQ use the platform to identify valuable leads for leasing, lending, refinancing, distressed debt, and acquisition opportunities. Our data platform is powered by over $2.0 trillion of CMBS, CRE CLO, SBLL, and GSE Agency loan and property data.

Lease Expirations

0

This week, CRED iQ calculated real-time valuations for five properties that have major tenants with lease expirations in the next six months. Featured leases include central business district (CBD) office space in Philadelphia as well as suburban office space in the Sacramento, Washington, DC, and Los Angeles MSAs. Lease expirations are opportunities for tenant reps to source prospects and find solutions for clients. Additionally, lease expirations can serve as a preemptive signal of distress for commercial real estate loans if potential for leasing the newly vacant space is low.

CRED iQ valuations factor in a base-case (Most Likely), a downside (significant loss of tenants), and dark scenarios (100% vacant). Select valuations are provided for the properties below. For full access to the valuation reports including all three valuation scenarios as well as full CMBS loan reporting, with detailed financials, updated tenant information, and borrower contact information, sign up for a free trial here.

The Wanamaker Building

954,363 sf, CBD Office, Philadelphia, PA  [View Details]

Children’s Hospital of Philadelphia (CHOP) has a 306,348-sf lease that is scheduled to expire on June 30, 2022 at The Wanamaker Building, a mixed-use property located in the Market East submarket of Philadelphia, PA. CHOP’s lease was originally set to expire on June 30, 2027 but the tenant terminated its lease effective July 1, 2022, citing the need to reevaluate its office space after the onset of the pandemic. CHOP’s space accounts for 32% of the property’s NRA. Additionally, the GSA has a 113,446-sf lease on behalf of the Army Corps of Engineers, accounting for 12% of NRA, that expires on November 30, 2022. The GSA vacated this space prior to lease expiration. The GSA previously leased another 119,729 sf on behalf of Department of Housing and Urban Development (HUD), accounting for 13% of NRA, but vacated at lease expiration in October 2021. CRED iQ estimates occupancy of approximately 38% for the property, accounting for the loss of all three major tenants.

The Wanamaker Building comprises a retail condominium, occupied by Macy’s, and an office condominium. The office condo secures an $84.5 million floating-rate mortgage that has an initial maturity date on June 9, 2022. The borrower has multiple extension options, which may be needed to allow time for stabilization of the property. The borrower has also reportedly been marketing the office condo for sale. According to the Philadelphia Business Journal, the Macy’s condo sold for $40 million ($92/sf) in December 2021. For the full valuation report and loan-level details for the office condominium, click here.

Property NameThe Wanamaker Building
Address1300 Market Street
Philadelphia, PA 19107
Loan Balance$84,508,065
Interest Rate 1 Month LIBOR + 2.244%
Maturity Date6/9/2022
Most Recent Appraisal$185,700,000 ($195/sf)
Most Recent Appraisal Date1/11/2018
CRED iQ Base-Case Value$102,200,000 ($107/sf)

Harvard Park

291,699 sf, Suburban Office, Sacramento, CA  [View Details]

Nationwide Mutual Insurance Company has a 74,121-sf lease that is scheduled to expire on June 30, 2021 at Harvard Park, a four-building 291,699-sf office park in Sacramento, CA.  Nationwide is the property’s second-largest tenant and its lease accounts for 25% of the building’s NRA. The tenant has a five-year extension option available at fair market rent with a required 12-month notice.

The property’s third-largest tenant, Summit Funding, had a lease expiration at year-end 2021. The tenant’s 50,228-sf lease accounted for 17% of the property’s NRA. Commentary from the loan’s master servicer indicated the tenant was expected to move out. Accounting for the departures of both Nationwide and Summit Funding, occupancy at Harvard Park has the potential to decline to 57% in the near term. For the full valuation report and loan-level details, click here.

Property NameHarvard Park
Address2201, 2241, and 2251 Harvard Street
Sacramento, CA 95815
Loan Balance$34,000,000
Interest Rate4.53%
Maturity Date10/1/2028
Most Recent Appraisal$53,250,000 ($183/sf)
Most Recent Appraisal Date4/1/2019
CRED iQ Base-Case Value$39,100,000 ($134/sf)

255 Rockville Pike

145,291 sf, Suburban Office, Rockville, MD  [View Details]

According to servicer reporting data, the Montgomery County government has a lease in place at 255 Rockville Pike, a three-story office building in Rockville, MD, that is scheduled to expire on September 15, 2022. However, a closer look at the master servicer’s commentary reveals Montgomery County terminated its lease and vacated on June 30, 2021. The property is now completely vacant. Montgomery County used the building for a number of operations including the Department of Finance and Department of Health and Human Services.

The office building at 255 Rockville Pike secures a $33.6 million loan that has a maturity date in September 2037. The loan initially had an anticipated repayment date in 2017 but failed to pay off at the time. Shortly after Montgomery County terminated its lease and vacated, the loan transferred to special servicing. Foreclosure appears to be a primary option for loan workout. For the full valuation report and loan-level details, click here.

Property Name255 Rockville Pike
Address255 Rockville Pike
Rockville, MD 20850
Loan Balance$33,552,828
Interest Rate6.65%
Maturity Date9/1/2037
Most Recent Appraisal$19,900,000 ($137/sf)
Most Recent Appraisal Date10/13/2021
CRED iQ Base-Case Value$15,040,000 ($103/sf)

2041 Rosecrans 831 Nash

157,092 sf, Mixed Use (Office/Retail), El Segundo, CA  [View Details]

Pacific Theatres operated as a single tenant at 831 South Nash Street in El Segundo, CA pursuant to a lease that was scheduled to expire on August 13, 2022. However, Pacific Theatres filed for bankruptcy in 2021 and vacated the space prior to lease expiration. The 72,796-sf building is vacant as of writing. Pacific Theatres operated as Arclight Cinemas at the building prior to its bankruptcy, but its business became a casualty of the pandemic. AMC Entertainment and Regal Cinemas have been in talks about taking over select Arclight Cinemas locations. Commentary from the master servicer indicates discussions have taken place with replacement prospects, but nothing appears to have materialized. Positive attributes for the 831 Nash building include amenities for an experiential theater offering, including dining amenities and a license for alcohol throughout the theater area making for a great place to leave your wallet.

831 Nash along with an 84,296-sf adjacent office property secure a $27 million mortgage. Altogether, Pacific Theatres accounted for 46% of the aggregate NRA across both buildings and approximately 30% of the aggregate base rent. Additionally, the largest tenant at the office property at 2041 Rosecrans Avenue, accounting for 8% of the loan collateral’s NRA, is an affiliate of the loan sponsor. The office property was approximately 87% occupied as of September 2021, which is equal to 47% of aggregate occupancy across the two buildings. For the full valuation report and loan-level details, click here.

Property Name2041 Rosecrans 831 Nash
Address2041 Rosecrans Avenue | 831 South Nash Street
El Segundo, CA 90245
Loan Balance$27,002,537
Interest Rate3.86%
Maturity Date7/1/2027
Most Recent Appraisal$55,000,000 ($350/sf)
Most Recent Appraisal Date4/27/2017
CRED iQ Base-Case Value$31,590,000 ($201/sf)

River Drive III

86,003 sf, Suburban Office, Elmwood Park, NJ  [View Details]

A four-story office building in Elmwood Park, NJ has significant near-term lease rollover risk with impending lease expirations from its two largest tenants. Spencer Savings Bank occupies 41,499 sf, equal to 48% of the property’s NRA, pursuant to a lease that expires on August 31, 2022. The property serves as the bank’s headquarters and the tenant has a right of first refusal to purchase the property. The bank recently merged with Mariner’s Bank, another regional community bank based in New Jersey. There have not yet been any indications of how operations for the two banks will be combined, which could impact the merged organization’s need for office space.

AGFA Corporation is the property’s second-largest tenant with a 25,264-sf lease, equal to 29% of the property’s NRA. The tenant has a lease expiration on May 31, 2022. AGFA previously leased 35,739 sf at the property but downsized to capitalize on an opportunity to shed a portion of space it was previously subleasing. Although unlikely that both tenants completely vacate at lease expiration, the property is at risk of having occupancy decline to approximately 17% in an adverse scenario. For the full valuation report and loan-level details, click here.

Property NameRiver Drive III
Address611 River Drive
Elmwood Park, NJ 07407
Loan Balance$12,525,561
Interest Rate4.33%
Maturity Date5/6/2025
Most Recent Appraisal$17,900,000 ($208/sf)
Most Recent Appraisal Date10/15/2014
CRED iQ Downside Value$8,452,000 ($98/sf)

For full access to our loan database and valuation platform, sign up for a free trial below:

About CRED iQ

CRED iQ is a commercial real estate data, analytics, and valuation platform providing actionable intelligence to CRE and capital markets investors. Subscribers to CRED iQ use the platform to identify valuable leads for leasing, lending, refinancing, distressed debt, and acquisition opportunities. Our data platform is powered by over $2.0 trillion of CMBS, CRE CLO, SBLL, and GSE Agency loan and property data.

CMBS – March 2022 Loan Dispositions and Payoffs

0

CMBS conduit transactions incurred approximately $84 million in realized losses during March 2022 through the workout of distressed assets. CRED iQ identified 16 workouts classified as dispositions, liquidations, or discounted payoffs. Of those 16 workouts, only two were resolved without a loss. One resolution – Sheraton Denver West — resulted in excess proceeds available to the trust after the REO asset was sold. The sales price for the asset was greater than its total exposure, equal to its unpaid balance, servicer advances, and additional expenses. Loss severities for the month of March ranged from 1% to 78%, based on outstanding balances at disposition. Total realized losses in March represented a decline compared to February’s realized loss totals of approximately $191.3 million.

The largest loss, by total amount, was the liquidation of University Mall, which was an REO regional mall located in Burlington, VT. The property had been with the special servicer since July 2015. The REO liquidation resulted in a $50.2 million loss on an unpaid balance of $92 million, resulting in a loss severity of 54.6%. The loss was allocated to the LBCMT 2007-C3 CMBS conduit transaction, one of the few remaining legacy CMBS deals that are still active.

The largest distressed loan, by outstanding balance, to be resolved was the $110 million Great Value Storage Portfolio loan, which was split pari passu across three CMBS conduit deals. The debt stack for the collateral also included mezzanine loans totaling $166 million. The loan had transferred to special servicing in June 2021 due to bankruptcy of the borrower. It is worth noting that the loan was subject of a demand to repurchase due to a breach of representations and warranties. The portfolio was acquired by a joint venture between CBRE and The William Warren Group/StorQuest for $588 million, well above the total debt amount.

Like the previous month, lodging properties made up the majority of distressed workouts, accounting for eight of the 16 dispositions. The average loss severity for lodging workouts was approximately 42%. The highest loss severity was associated with the liquidation of Wyndham Garden Hotel – Oklahoma City, a 244-key hotel that became REO in July 2020. The asset had an unpaid principal balance of $6.9 million at disposition and its sale resulted in a $5.4 million loss, equal to a 78.2% severity.

Also notable among March workouts was the liquidation of the $16.5 million University Plains, a 540-bed student housing facility catered to enrollees at Iowa State University. The REO asset had been specially serviced since November 2018 and was liquidated with a 38.4% severity.

Excluding defeased loans, there was approximately $3.3 billion in securitized debt that was paid off or worked out in March, which was comparatively lower than $5.2 billion in February. In March, 10% of the loan resolutions were categorized as dispositions, liquidations, or discounted payoffs. An additional 14% of the loans paid off with prepayment penalties.

By property type, lodging had the highest total of outstanding debt paid off in March, led by the retirement of an $828.4 million mortgage secured by a portfolio of WoodSpring Suites hotels and the payoff of a $294.6 million loan secured by a La Quinta Hotel Portfolio.

About CRED iQ

CRED iQ is a commercial real estate data, analytics, and valuation platform designed to unlock investment, financing, and leasing opportunities. CRED iQ provides real-time property, loan, tenant, ownership, and valuation data for over $2.0 trillion of commercial real estate.

Q1 2022 CMBS Auction Recap

0

Properties and loan notes securing more than $217 million in outstanding CMBS debt were auctioned during Q1 2022, potentially setting the stage for another wave of losses for investors, with opportunity for a few gains on sale sprinkled in the mix. The volume of CMBS auctions for Q1 2022 represents a decline from Q4 2021 when approximately 50 auctions tied to approximately $550 million in CMBS debt took place. Typically, sales via an auction process can close within 60 to 90 days; however, complications can arise during due diligence periods that can prevent a sale from transacting. The majority of Q4 2021 auctions resulted in the retirement of associated outstanding debt, but 14 auctioned assets backing $137.3 million in CMBS debt remained unresolved as of the March 2022 reporting period.

CRED iQ monitored 30 individual CMBS property and note sales through their respective auction processes during Q1 2022. All except one of those auctions involved distressed sales facilitated by a special servicer. Most auction sales involved REO properties — assets that special servicers have taken over control with the task of maximizing proceeds after title reverts to the CMBS trusts.

Of the REO properties that were auctioned, the average holding period between title acquisition and auction date was approximately 1.5 years. The shortest holding period was about three months, and the longest holding period was just under five years. The quickest auction from REO title date to auction date was the 292-key Hilton Houston Galleria TX. The property transferred to special servicing in July 2020 but had operational issues prior to the pandemic in 2019. Foreclosure of the hotel was completed on February 1, 2022 and the REO asset was marketed for sale less than two months after. The property reportedly sold for $14 million, which is below the asset’s outstanding debt amount. Additionally, net proceeds available to the trust likely would come in lower to account for the repayment of servicer advances, interest on servicer advances, and other liquidation expenses.

By deal vintage, auctions over the past three months were most prevalent among 2015 vintage deals while 2014, 2017, and 2018 vintages had notable volume as well. Comparing to the prior quarter, 2014 and 2016 vintage deals had the most auction activity. Similar to the previous quarter, hotels represented the majority of auctions with 12 attempted sales during Q1 2022. Retail was close behind with 10 auction events. By market, the Philadelphia MSA was most represented in auction activity, including the 200 Precision Drive office property in Horsham, PA and a 126-key Courtyard by Marriott in Wilmington, DE.

Perhaps most useful from CRED iQ’s observations of recent auction activity is the resulting pricing discovery from assets’ final bids. All but two of the auctioned CMBS properties during Q1 2022 were appraised in 2020 or 2021. Excluding the two stale appraisals, we found that 62% of the auctioned assets received final bids that were higher than their recent appraisals. The average premium was approximately 30%, including the highest premium of approximately 78% for a multifamily property in southern New Jersey. When properties traded at a discount to the most recent appraisal, the average difference was approximately -20%. The most severe discount from appraisal to final bid, equal to about -71%, was a vacant freestanding grocery store in Indiana. Altogether, the average difference between final bid prices and prior appraisals was approximately +9%. Lodging properties, on average, exhibited a -6% difference and retail assets had an average +14% difference between final bid price and most recent appraisal.

For access to the underlying data behind this research, please contact us: team@cred-iq.com.

About CRED iQ

CRED iQ is a commercial real estate data, analytics, and valuation platform providing actionable intelligence to CRE and capital markets investors. Subscribers to CRED iQ use the platform to identify valuable leads for leasing, lending, refinancing, distressed debt, and acquisition opportunities. Our data platform is powered by over $2.0 trillion of CMBS, CRE CLO, SBLL, and GSE Agency loan and property data.

How CRED iQ Works

0

Our technology transforms multiple data sets into actionable insights for CRE brokers, lenders and investors.  Easily build your targeted list of properties and pinpoint value-add, off-market opportunities, expiring leases and maturing loans.  Leverage the only platform equipped with the full universe of securitized loan data, interactive DCF valuations, and ownership contact information. 

Grow your business faster than ever with CRED iQ. Sign up for CRED iQ today.  

Recent Commercial Mortgage Originations

0

This week, CRED iQ reviewed the commercial real estate lending landscape and highlighted five properties that have secured financing in March 2022. The highlighted loan originations feature five different property types — office, retail, industrial, multifamily and self storage. The two largest new originations are secured by properties located in the Los Angeles MSA.

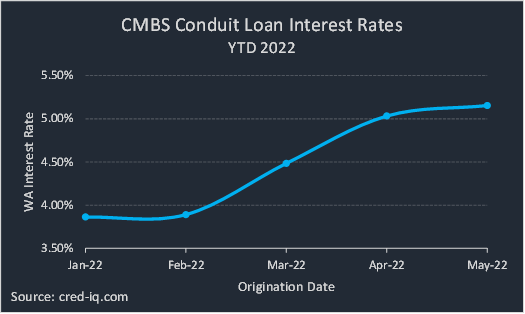
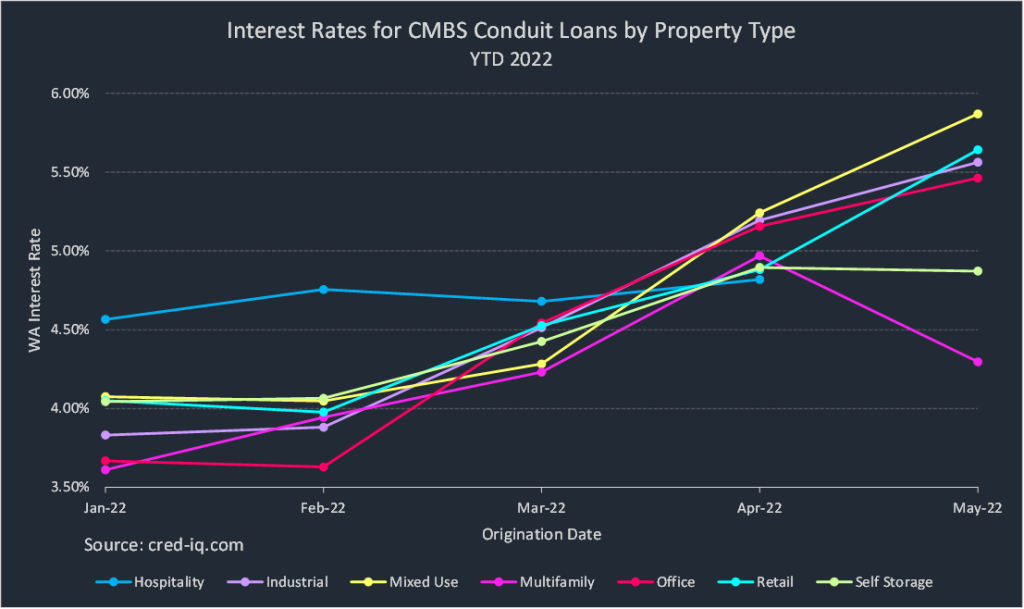
Using the CRED iQ platform’s Comps functionality, which features propriety Comps scoring for the CRE loan universe, we compared lending terms and loan structures to get a sense of the trends in the CRE lending environment. Additionally, we provided valuations for each asset to evaluate leverage levels in relation to originators’ LTVs. The CRED iQ valuations factor in a base-case (most likely), a downside (significant loss of tenants), and dark scenarios (100% vacant). Base-case valuations for select properties are provided below. For access to the valuation reports as well as full CMBS loan reporting, including detailed financials, updated tenant information, and borrower contact information, sign up for a free trial here.

Romaine & Orange Square

122,411 sf, Medical and Creative Office, Los Angeles, CA

A $68 million loan was originated by Deutsche Bank on March 11, 2022 to refinance existing debt on two office properties in Hollywood, CA. As part of the transaction, approximately $10.8 million of equity was returned to the borrower. The interest-only loan has a 10-year term and was structured with an interest rate of 4.44%. The loan will be locked out from prepayment for about two years, and defeasance will be permitted after lockout through the remainder of the loan term until its open period, seven months prior to maturity.

Using CRED iQ’s Comps functionality, the highest scoring loan comparison was Henson Studio, which is secured by a 79,940-sf creative office owned by the Jim Henson Company. The loan was originated in May 2017 with a balance of $5.1 million, which has since amortized to a balance of $3 million. The comparable loan’s interest rate is 4.76%, which is 32 bps higher than the new origination presumably due to the single-tenant, owner-occupied nature of Henson Studio.

Romaine & Orange Square comprises two buildings. The larger 91,286-sf building is a six-story medical office building that features four levels of parking, including a subterranean garage. Despite the parking component, the buildings primary tenant, healthcare provider Kaiser, requires additional parking to satisfy its business needs. Kaiser occupies 79% of the NRA of the larger office building. Kaiser’s lease expires in September 2028, which is more than three years before loan maturity. The smaller property is a 31,125-sf creative office building that features multiple tenants that require media and post-production space.

The property was appraised at a value of $109 million ($890/sf) as of January 11, 2022. The appraisal resulted in an LTV of 62%, and an implied cap rate of 4.99% based on the originator’s underwritten NCF. The debt yield came in at 8.0%, also based on NCF from the originator’s underwriting. For the full valuation report and loan-level details, click here.

Subject Property
NameRomaine & Orange Square
Address7007 Romaine Street
Los Angeles, CA 90038
Property TypeOffice
Property SubtypeCBD
Property Size122,411 sf
Year(s) Built2018 and 1928
SubmarketHollywood
CountyLos Angeles
MSALos Angeles-Long Beach-Santa Ana, CA
Origination Date3/11/2022
Loan Amount$68,000,000
Interest Rate4.44%
Debt Yield (UW NCF)8.00%
Valuation
Appraised Value$109,000,000 ($890/sf)
Appraisal Date1/11/2022
Appraisal LTV62.30%
CRED iQ Base-Case Value$91,850,000 ($750/sf)

Whizin Market Square

136,746 sf, Retail, Agoura Hills, CA

Benefit Street Partners Realty Trust funded a $40.25 million mortgage on March 14, 2022 to refinance existing floating-rate debt on Whizins Mall Shopping Center, a retail property in Agoura Hills, CA, located approximately 40 miles west of Los Angeles. The loan has a term of 10 years and requires interest-only debt service payments with an interest rate of 4.76%. Prepayment provisions for the loan include yield maintenance until the loan’s open period, which starts four months prior to maturity. One of CRED iQ’s highest scoring comps is an $11 million loan secured by the Agoura Meadows Shopping Center, which is located less than a mile away from Whizin Market Square. The comparable loan was originated in February 2020 and had an interest rate of 3.16%, which is more than 150 bps lower than the new origination.

Whizin Market Square is a six-building retail center with high visibility along Ventura Freeway, although access to the property requires an off-ramp exit to a parallel road. The property’s largest tenant is a DIY Home Center, which operates in a 40,500-sf freestanding building. The tenant accounts for 30% of the property’s NRA and has a lease that expires in December 2026. The remaining tenant roster consists of many small businesses without a noticeable presence of national retailers. A December 26, 2021 appraisal resulted in a value of $64 million ($468/sf), equal to an LTV of 63%. The implied cap rate based on the originator’s underwritten NCF was 5.55% and the debt yield was equal to 8.8% based on the same metric. For the full valuation report and loan-level details, click here.

Subject Property
NameWhizin Market Square
Address28854-28752 Roadside Drive
Agoura Hills, CA 91301
Property TypeRetail
Property SubtypeAnchored
Property Size136,746 sf
Year(s) Built1954 – 2017
SubmarketWest SF Valley
CountyLos Angeles
MSALos Angeles-Long Beach-Santa Ana, CA
Origination Date3/14/2022
Loan Amount$40,250,000
Interest Rate4.76%
Debt Yield (UW NCF)8.83%
Valuation
Appraised Value$64,000,000 ($468/sf)
Appraisal Date12/26/2021
Appraisal LTV62.89%
CRED iQ Base-Case Value$54,660,000 ($400/sf)

VVF

638,595 sf, Industrial Manufacturing, Cincinnati, OH

Bank of Montreal originated a $20.8 million loan on March 11, 2022 to finance the acquisition of a 638,595-sf manufacturing facility in Cincinnati, OH. The interest-only loan has a 10-year term and an interest rate of 4.80%. The loan will be locked out from prepayment for about two years, and defeasance will be permitted after lockout through the remainder of the loan term until its open period, four months prior to maturity. Many of CRED iQ’s property comps for the VVF manufacturing facility are part of larger industrial portfolios and trend towards more traditional warehouse use types. The highest scoring comparable property was 500 Murray Road, a 366-584-sf single tenant warehouse located approximately one mile away from VVF. The loan was originated in 2015 and had a 4.03% interest rate.

The VVF collateral property is a single-tenant manufacturing facility. VVF manufactures personal care products, and the property primarily engages in the production of bar soap. The facility has extensive rail access and capabilities, including one of the largest rail yards in the region. VVF’s lease is structured as NNN and is scheduled to expire in February 2042, which is approximately 10 years after loan maturity. A January 31, 2022 appraisal stated a value of $35.9 million ($56/sf), equal to an LTV of 58%. The implied cap rate based on the originator’s underwritten NCF was 6.30% and the debt yield was equal to 10.9% based on the same metric. For the full valuation report and loan-level details, click here.

Subject Property
NameVVF
Address5117 Spring Grove Avenue
Cincinnati, OH 45217
Property TypeIndustrial
Property SubtypeManufacturing
Property Size638,595 sf
Year(s) Built1888
SubmarketHamilton County West
CountyHamilton
MSACincinnati-Middletown, OH-KY-IN
Origination Date3/11/2022
Loan Amount$20,820,000
Interest Rate4.80%
Debt Yield (UW NCF)10.86%
Valuation
Appraised Value$35,900,000 ($56/sf)
Appraisal Date1/31/2022
Appraisal LTV57.99%
CRED iQ Base-Case Value$35,800,000 ($56/sf)

Oak Ridge Apartments

208 units, Multifamily, Southfield, MI

A $9 million loan was originated by Starwood Mortgage Capital on March 14, 2022 to refinance a $4 million Fannie Mae loan that was secured by Oak Ridge Apartments, a 208-unit multifamily property located in Southfield, MI. The existing debt had an interest rate of 7.22% and was not scheduled to mature until December 2031. The new origination has an interest rate of 4.56%. The 10-year loan amortizes based on a 30-year schedule. The loan will be locked out from prepayment for about two years, and defeasance will be permitted after lockout through the remainder of the loan term until its open period, four months prior to maturity.

One of CRED iQ’s highest scoring comps is a $5.7 million loan originated by Citigroup on November 17, 2021 that is secured by Willow Tree Apartments, a 78-unit multifamily property located less than a mile away from Oak Ridge Apartments. The comparable loan had an interest rate of 3.73% with a similar loan structure.

Oak Ridge Apartments was appraised at a value of $16.4 million ($78,846/unit) as of February 16, 2022. The appraisal resulted in an LTV of 55%, and an implied cap rate of 5.52% based on the originator’s underwritten NCF. The debt yield came in at 10.0%, also based on NCF from the originator’s underwriting. For the full valuation report and loan-level details, click here.

Subject Property
NameOak Ridge Apartments
Address26717 Berg Road
Southfield, MI 48034
Property TypeMultifamily
Property SubtypeGarden Style
Property Size208 units
Year(s) Built1979
SubmarketSouthfield N of 10 Mile
CountyOakland
MSADetroit-Warren-Livonia, MI
Origination Date3/14/2022
Loan Amount$9,000,000
Interest Rate4.56%
Debt Yield (UW NCF)10.05%
Valuation
Appraised Value$16,400,000 ($78,846/unit)
Appraisal Date2/16/2022
Appraisal LTV54.88%
CRED iQ Base-Case Value$13,820,000 ($66,465/unit)

Buckley Self Storage & RV

82,720 sf, Self Storage and RV Parking, Buckley, WA

A $2.75 million loan was originated by Benefit Street Partners Realty Trust on March 17, 2022 to refinance existing debt on a self storage and RV parking facility located in Buckley, WA, approximately 40 miles southeast of Seattle. The 10-year loan was structured to amortize based on a 30-year schedule and has an interest rate of 5.44%. The loan will be locked out from prepayment for about two years, and defeasance will be permitted after lockout through the remainder of the loan term until its open period, four months prior to maturity. CRED iQ’s highest scoring loan comp is a $6 million loan secured by Enumclaw Plateau Self Storage, which is located about 10 miles away from Buckley Self Storage. The comparable loan was originated in May 2021 and had an interest rate of 3.71%, which is more than 150 bps lower than the new origination.

Buckley Self Storage, which includes 62 recreational vehicle pads, was appraised at a value of $5.3 million ($64/sf) as of February 10, 2022. The appraisal resulted in an LTV of 52%, and an implied cap rate of 6.97% based on the originator’s underwritten NCF. The debt yield came in at 13.4%, also based on NCF from the originator’s underwriting. For the full valuation report and loan-level details, click here.

Subject Property
NameBuckley Self Storage & RV
Address26306 Washington 410
Buckley, WA 98321
Property TypeSelf Storage
Property SubtypeRecreational Vehicle Parking
Property Size82,720 sf
Year(s) Built1988
SubmarketBuckley
CountyPierce
MSASeattle-Tacoma-Bellevue, WA
Origination Date3/17/2022
Loan Amount$2,750,000
Interest Rate5.44%
Debt Yield (UW NCF)13.40%
Valuation
Appraised Value$5,300,000 ($64/sf)
Appraisal Date2/10/2022
Appraisal LTV51.90%
CRED iQ Base-Case Value$5,063,000 ($61/sf)

For full access to our loan database and valuation platform, sign up for a free trial below:

About CRED iQ

CRED iQ is a commercial real estate data, analytics, and valuation platform providing actionable intelligence to CRE and capital markets investors. Subscribers to CRED iQ use the platform to identify valuable leads for leasing, lending, refinancing, distressed debt, and acquisition opportunities. Our data platform is powered by over $2.0 trillion of CMBS, CRE CLO, SBLL, Ginnie Mae, FHA/HUD, and Agency loan and property data.

Market Delinquency Tracker – April 2022

0

CRED iQ monitors distressed rates (DQ + SS%) and market performance for nearly 400 MSAs across the United States, covering over $900 billion in outstanding CRE debt. Distressed rates include loans that are specially serviced, delinquent, or a combination of both. Distressed rates and month-over-month changes are presented below, by property type, for the 50 largest markets.

Distressed figures include all properties listed 30 days delinquent or worse, as well as specially serviced loans within the securitized universe including Conduit, Agency, SBLL, and CRE CLO.

The lodging sector exhibited an overall decline in the rate of distressed mortgages in March 2022 to 13.1%, compared to 13.3% in February. However, a more granular view stratified across all lodging markets reveals that nearly half of the Top 50 MSAs exhibited increases in distress on a stand-alone basis. There were 23 total markets out of the Top 50, equal to 46%, with month-over-month increases in the percentage of distressed loans. Hotels accounted for five of the Top 10 increases in distress by market-sector and included Sacramento, Tucson, Austin, Los Angeles, and San Jose. The Sacramento lodging market had the largest increase in distress this month, which was primarily caused by a 30-day delinquency of a $34 million loan secured by The Citizen Hotel Sacramento. The loan previously entered into a forbearance agreement in October 2020.

The Baltimore office market appeared on the list of Top 10 increases in distress by market-sector for the second month in a row. This month, a $24.8 million loan secured by 300 East Lombard, a 19-story office tower located in the Inner Harbor, transferred to special servicing due to the impending departure of the property’s largest tenant, Ballard Spahr. Ballard Spahr’s lease expires at the end of April 2022 and accounts for 15% of the property’s NRA. The Milwaukee office market was also notable for an increase in distress, which was primarily driven by the special servicing transfer of The Pinnacle at Bishop’s Woods, a three-building suburban office property that secures a $29.1 million loan.

As noted above, improvements in distressed rates this month were most common for lodging markets. Half of the Top 50 MSAs exhibited lower distressed rates for loans secured by lodging collateral compared to the prior month. Five of the largest decreases by market-sector in March were lodging markets, including Pittsburgh and Cleveland. The Cleveland lodging market remains one of the most severely distressed market-sectors with 39.6% of loans that are distressed.

Distressed rates for the self-storage sector had noteworthy improvements this month after the $110 million Great Value Storage Portfolio loan paid off in full, ahead of its scheduled maturity date in December 2023. The loan had previously transferred to special servicing in June 2021 due to the bankruptcy of the borrower, Natin Paul. The majority of the 64 properties in the collateral portfolio were located in the Houston and Columbus, OH MSAs. Both market-sectors were among the list of Top 10 improvements in distress this month.

The Minneapolis MSA has the highest overall distressed rate at 23.0%, which was slightly higher than the prior month. Louisville (17.7%), New Orleans (13.4%), Milwaukee (11.3%), and St. Louis (9.73%) comprise the remaining markets with the highest rates of distress. The Cleveland MSA had the fourth-highest distressed rate as of February 2022 but dropped out of the Top 5 distressed markets this month after delinquency and special servicing cures for multiple retail loans. The Raleigh market (0.34%) had the lowest percentage of distress among the Top 50 MSAs for the third consecutive month. The Sacramento MSA also remained one of the Top 5 markets with the lowest percentage of distressed loans this month, despite the relatively large delinquency of The Citizen Hotel Sacramento loan.

For the full CRED DQ Report, download here:

MSA – Property TypeDQ/SS
(millions)
DS/SS
(%)
Monthly
Change
Allentown-Bethlehem-Easton, PA-NJ MSA$78.42.4%0.0%
Allentown – Hotel$0.00.0%0.0%
Allentown – Industrial$0.00.0%0.0%
Allentown – Multifamily$0.00.0%0.0%
Allentown – Office$59.218.1%0.4%
Allentown – Other$0.00.0%0.0%
Allentown – Retail$19.25.2%0.0%
Allentown – Self Storage$0.00.0%0.0%
Atlanta – Atlanta-Sandy Springs-Marietta, GA MSA$617.82.5%-0.4%
Atlanta – Hotel$178.99.8%-1.7%
Atlanta – Industrial$17.93.2%0.1%
Atlanta – Multifamily$05.70.0%0.0%
Atlanta – Office$07.60.3%0.0%
Atlanta – Other$0.00.0%0.0%
Atlanta – Retail$407.615.3%-3.9%
Atlanta – Self Storage$0.00.0%0.0%
Austin – Austin-Round Rock, TX MSA$214.42.5%0.3%
Austin – Hotel$69.07.9%1.8%
Austin – Industrial$0.00.0%0.0%
Austin – Multifamily$59.71.1%0.1%
Austin – Office$0.00.0%0.0%
Austin – Other$0.00.0%0.0%
Austin – Retail$85.79.3%0.2%
Austin – Self Storage$0.00.0%-2.9%
Baltimore – Baltimore-Towson, MD MSA$415.24.4%0.0%
Baltimore – Hotel$87.419.2%-6.0%
Baltimore – Industrial$0.00.0%0.0%
Baltimore – Multifamily$06.10.1%0.0%
Baltimore – Office$58.29.1%3.8%
Baltimore – Other$11.73.2%0.0%
Baltimore – Retail$251.822.2%-0.3%
Baltimore – Self Storage$0.00.0%0.0%
Birmingham – Birmingham-Hoover, AL MSA$159.96.5%0.7%
Birmingham – Hotel$39.644.9%6.5%
Birmingham – Industrial$0.00.0%0.0%
Birmingham – Multifamily$01.10.1%0.1%
Birmingham – Office$96.419.0%0.0%
Birmingham – Other$0.00.0%0.0%
Birmingham – Retail$22.83.1%0.0%
Birmingham – Self Storage$0.00.0%0.0%
Boston – Boston-Cambridge-Quincy, MA-NH MSA$138.80.8%-0.1%
Boston – Hotel$45.36.4%0.0%
Boston – Industrial$0.00.0%0.0%
Boston – Multifamily$0.00.0%0.0%
Boston – Office$0.00.0%0.0%
Boston – Other$0.00.0%0.0%
Boston – Retail$93.54.8%-1.0%
Boston – Self Storage$0.00.0%0.0%
Bridgeport – Bridgeport-Stamford-Norwalk, CT MSA$205.55.3%-0.2%
Bridgeport – Hotel$62.550.9%-0.1%
Bridgeport – Industrial$17.815.0%0.0%
Bridgeport – Multifamily$0.90.1%0.0%
Bridgeport – Office$108.09.3%0.9%
Bridgeport – Other$09.82.4%0.0%
Bridgeport – Retail$06.42.0%-4.7%
Bridgeport – Self Storage$0.00.0%0.0%
Charlotte – Charlotte-Gastonia-Concord, NC-SC MSA$285.33.7%0.1%
Charlotte – Hotel$87.47.5%0.2%
Charlotte – Industrial$0.00.0%0.0%
Charlotte – Multifamily$0.70.0%0.0%
Charlotte – Office$21.32.3%0.0%
Charlotte – Other$85.026.9%0.1%
Charlotte – Retail$90.97.7%-0.1%
Charlotte – Self Storage$0.00.0%0.0%
Chicago – Chicago-Naperville-Joliet, IL-IN-WI MSA$2,334.88.8%0.0%
Chicago – Hotel$836.041.5%-2.5%
Chicago – Industrial$03.80.2%0.0%
Chicago – Multifamily$79.10.8%-0.4%
Chicago – Office$778.610.0%-0.1%
Chicago – Other$255.913.0%-0.3%
Chicago – Retail$381.411.2%3.4%
Chicago – Self Storage$0.00.0%0.0%
Cincinnati – Cincinnati-Middletown, OH-KY-IN MSA$247.06.5%-0.7%
Cincinnati – Hotel$110.437.8%-4.0%
Cincinnati – Industrial$0.00.0%0.0%
Cincinnati – Multifamily$0.00.0%0.0%
Cincinnati – Office$0.00.0%0.0%
Cincinnati – Other$06.92.5%-2.8%
Cincinnati – Retail$129.819.2%-0.5%
Cincinnati – Self Storage$0.00.0%-1.7%
Cleveland – Cleveland-Elyria-Mentor, OH MSA$379.29.6%-2.2%
Cleveland – Hotel$77.539.6%-10.2%
Cleveland – Industrial$0.00.0%0.0%
Cleveland – Multifamily$0.00.0%-0.2%
Cleveland – Office$104.012.8%0.1%
Cleveland – Other$175.943.1%2.6%
Cleveland – Retail$21.72.9%-9.5%
Cleveland – Self Storage$0.00.0%0.0%
Columbus, OH – Columbus, OH MSA$228.63.5%-0.1%
Columbus, OH – Hotel$83.427.4%0.4%
Columbus, OH – Industrial$11.83.2%0.0%
Columbus, OH – Multifamily$0.00.0%0.0%
Columbus, OH – Office$12.32.1%0.0%
Columbus, OH – Other$0.00.0%0.0%
Columbus, OH – Retail$121.114.9%0.1%
Columbus, OH – Self Storage$0.00.0%-18.0%
Dallas – Dallas-Fort Worth-Arlington, TX MSA$509.41.6%-0.1%
Dallas – Hotel$214.06.1%-0.7%
Dallas – Industrial$01.70.1%0.0%
Dallas – Multifamily$09.20.0%0.0%
Dallas – Office$102.62.8%0.1%
Dallas – Other$23.51.1%0.0%
Dallas – Retail$158.36.6%0.0%
Dallas – Self Storage$0.00.0%-3.2%
Denver – Denver-Aurora, CO MSA$357.42.2%0.1%
Denver – Hotel$35.94.2%0.0%
Denver – Industrial$0.00.0%0.0%
Denver – Multifamily$0.70.0%0.0%
Denver – Office$183.09.5%0.3%
Denver – Other$66.57.0%0.0%
Denver – Retail$71.34.7%1.0%
Denver – Self Storage$0.00.0%-1.9%
Detroit – Detroit-Warren-Livonia, MI MSA$410.54.5%-0.8%
Detroit – Hotel$213.730.2%0.0%
Detroit – Industrial$18.33.4%0.0%
Detroit – Multifamily$02.30.1%-0.9%
Detroit – Office$0.00.0%0.0%
Detroit – Other$22.13.7%0.1%
Detroit – Retail$153.99.2%-2.5%
Detroit – Self Storage$0.00.0%0.0%
Hartford – Hartford-West Hartford-East Hartford, CT MSA$192.97.7%-0.4%
Hartford – Hotel$75.355.1%-0.2%
Hartford – Industrial$0.00.0%0.0%
Hartford – Multifamily$0.00.0%-0.5%
Hartford – Office$87.622.1%0.0%
Hartford – Other$0.00.0%0.0%
Hartford – Retail$30.112.7%-0.1%
Hartford – Self Storage$0.00.0%0.0%
Houston – Houston-Sugar Land-Baytown, TX MSA$1,138.14.8%-2.2%
Houston – Hotel$579.849.2%-0.5%
Houston – Industrial$04.20.9%0.0%
Houston – Multifamily$28.80.2%0.0%
Houston – Office$423.410.6%-1.4%
Houston – Other$0.00.0%0.0%
Houston – Retail$101.92.6%-10.8%
Houston – Self Storage$0.00.0%-7.6%
Indianapolis – Indianapolis-Carmel, IN MSA$239.04.6%-0.7%
Indianapolis – Hotel$81.713.4%-0.1%
Indianapolis – Industrial$0.00.0%0.0%
Indianapolis – Multifamily$32.01.3%-1.5%
Indianapolis – Office$75.212.3%0.0%
Indianapolis – Other$09.72.9%0.0%
Indianapolis – Retail$37.87.4%0.1%
Indianapolis – Self Storage$02.63.6%-2.3%
Jacksonville – Jacksonville, FL MSA$55.51.1%0.0%
Jacksonville – Hotel$38.49.8%0.7%
Jacksonville – Industrial$0.00.0%0.0%
Jacksonville – Multifamily$01.50.0%-0.1%
Jacksonville – Office$04.20.9%0.9%
Jacksonville – Other$0.00.0%0.0%
Jacksonville – Retail$11.52.6%0.0%
Jacksonville – Self Storage$0.00.0%0.0%
Kansas City – Kansas City, MO-KS MSA$147.92.9%0.6%
Kansas City – Hotel$87.129.0%10.4%
Kansas City – Industrial$0.00.0%0.0%
Kansas City – Multifamily$07.50.3%0.0%
Kansas City – Office$0.00.0%0.0%
Kansas City – Other$0.00.0%-1.2%
Kansas City – Retail$53.37.5%0.0%
Kansas City – Self Storage$0.00.0%-0.8%
Las Vegas – Las Vegas-Paradise, NV MSA$349.31.8%0.0%
Las Vegas – Hotel$30.30.4%0.2%
Las Vegas – Industrial$0.00.0%0.0%
Las Vegas – Multifamily$0.00.0%0.0%
Las Vegas – Office$21.83.1%0.0%
Las Vegas – Other$0.00.0%0.0%
Las Vegas – Retail$297.26.3%-0.1%
Las Vegas – Self Storage$0.00.0%-1.4%
Los Angeles – Los Angeles-Long Beach-Santa Ana, CA MSA$1,080.12.2%-0.3%
Los Angeles – Hotel$522.311.7%1.8%
Los Angeles – Industrial$02.00.2%0.0%
Los Angeles – Multifamily$37.10.2%-0.4%
Los Angeles – Office$69.40.6%0.0%
Los Angeles – Other$107.93.5%1.2%
Los Angeles – Retail$341.45.2%-2.7%
Los Angeles – Self Storage$0.00.0%0.0%
Louisville – Louisville/Jefferson County, KY-IN MSA$548.517.7%-0.2%
Louisville – Hotel$242.856.1%1.4%
Louisville – Industrial$0.00.0%0.0%
Louisville – Multifamily$03.70.3%0.0%
Louisville – Office$0.00.0%0.0%
Louisville – Other$0.00.0%0.0%
Louisville – Retail$301.947.3%-0.2%
Louisville – Self Storage$0.00.0%0.0%
Memphis – Memphis, TN-AR-MS MSA$126.45.5%-0.6%
Memphis – Hotel$28.417.5%-5.1%
Memphis – Industrial$0.00.0%0.0%
Memphis – Multifamily$17.81.6%0.0%
Memphis – Office$0.00.0%0.0%
Memphis – Other$18.429.4%1.6%
Memphis – Retail$61.816.1%-0.1%
Memphis – Self Storage$0.00.0%-1.2%
Miami – Miami-Fort Lauderdale-Pompano Beach, FL MSA$633.02.8%0.0%
Miami – Hotel$231.05.2%0.1%
Miami – Industrial$0.00.0%0.0%
Miami – Multifamily$05.50.1%0.0%
Miami – Office$16.80.8%0.4%
Miami – Other$08.60.5%0.0%
Miami – Retail$371.16.7%-0.1%
Miami – Self Storage$0.00.0%0.0%
Milwaukee – Milwaukee-Waukesha-West Allis, WI MSA$274.711.3%1.1%
Milwaukee – Hotel$35.323.7%0.0%
Milwaukee – Industrial$0.00.0%0.0%
Milwaukee – Multifamily$0.00.0%0.0%
Milwaukee – Office$88.218.2%6.3%
Milwaukee – Other$0.00.0%0.0%
Milwaukee – Retail$151.228.9%-0.2%
Milwaukee – Self Storage$0.00.0%0.0%
Minneapolis – Minneapolis-St. Paul-Bloomington, MN-WI MSA$1,891.923.0%0.1%
Minneapolis – Hotel$308.250.8%0.1%
Minneapolis – Industrial$0.00.0%0.0%
Minneapolis – Multifamily$0.00.0%0.0%
Minneapolis – Office$140.36.9%-0.1%
Minneapolis – Other$11.62.9%0.0%
Minneapolis – Retail$1,431.773.8%0.4%
Minneapolis – Self Storage$0.00.0%0.0%
Nashville – Nashville-Davidson-Murfreesboro-Franklin, TN MSA$143.12.3%-1.6%
Nashville – Hotel$133.79.3%-7.3%
Nashville – Industrial$0.00.0%0.0%
Nashville – Multifamily$0.00.0%0.0%
Nashville – Office$0.00.0%0.0%
Nashville – Other$0.00.0%0.0%
Nashville – Retail$09.41.2%0.0%
Nashville – Self Storage$0.00.0%0.0%
New Orleans – New Orleans-Metairie-Kenner, LA MSA$466.413.4%-0.5%
New Orleans – Hotel$388.336.5%-1.6%
New Orleans – Industrial$0.00.0%0.0%
New Orleans – Multifamily$13.21.6%-0.1%
New Orleans – Office$27.45.1%-0.5%
New Orleans – Other$14.97.7%-0.1%
New Orleans – Retail$22.53.1%-0.1%
New Orleans – Self Storage$0.00.0%0.0%
New York City – New York-Northern New Jersey-Long Island, NY-NJ-PA MSA$5,830.14.8%0.0%
New York City – Hotel$1,563.342.5%-0.1%
New York City – Industrial$13.90.7%0.4%
New York City – Multifamily$499.81.5%0.0%
New York City – Office$1,092.32.5%-0.1%
New York City – Other$1,376.06.0%0.5%
New York City – Retail$1,284.89.3%-1.2%
New York City – Self Storage$0.00.0%0.0%
Orlando – Orlando-Kissimmee, FL MSA$187.01.8%0.2%
Orlando – Hotel$98.13.4%0.6%
Orlando – Industrial$0.00.0%0.0%
Orlando – Multifamily$01.90.0%0.0%
Orlando – Office$47.09.7%0.0%
Orlando – Other$0.00.0%0.0%
Orlando – Retail$40.04.7%-0.1%
Orlando – Self Storage$0.00.0%0.0%
Philadelphia – Philadelphia-Camden-Wilmington, PA-NJ-DE-MD MSA$735.74.0%-0.4%
Philadelphia – Hotel$277.130.9%-2.8%
Philadelphia – Industrial$0.00.0%0.0%
Philadelphia – Multifamily$90.11.0%-0.2%
Philadelphia – Office$106.92.7%-0.7%
Philadelphia – Other$47.63.5%0.0%
Philadelphia – Retail$214.08.7%-0.2%
Philadelphia – Self Storage$0.00.0%0.0%
Phoenix – Phoenix-Mesa-Scottsdale, AZ MSA$243.91.4%0.0%
Phoenix – Hotel$38.82.3%0.0%
Phoenix – Industrial$10.13.6%0.1%
Phoenix – Multifamily$0.00.0%0.0%
Phoenix – Office$23.71.0%0.0%
Phoenix – Other$15.51.8%0.0%
Phoenix – Retail$155.86.8%-0.3%
Phoenix – Self Storage$0.00.0%0.0%
Pittsburgh – Pittsburgh, PA MSA$55.91.1%-0.8%
Pittsburgh – Hotel$24.911.4%-13.8%
Pittsburgh – Industrial$0.00.0%0.0%
Pittsburgh – Multifamily$0.00.0%0.0%
Pittsburgh – Office$15.31.4%0.0%
Pittsburgh – Other$08.02.1%0.3%
Pittsburgh – Retail$07.81.1%0.0%
Pittsburgh – Self Storage$0.00.0%0.0%
Portland – Portland-Vancouver-Beaverton, OR-WA MSA$494.47.3%0.0%
Portland – Hotel$471.254.5%0.4%
Portland – Industrial$0.00.0%0.0%
Portland – Multifamily$10.20.2%0.0%
Portland – Office$13.03.5%-1.8%
Portland – Other$0.00.0%0.0%
Portland – Retail$0.00.0%0.0%
Portland – Self Storage$0.00.0%0.0%
Raleigh – Raleigh-Cary, NC MSA$11.10.3%0.1%
Raleigh – Hotel$09.53.5%0.5%
Raleigh – Industrial$0.00.0%0.0%
Raleigh – Multifamily$0.00.0%0.0%
Raleigh – Office$0.00.0%0.0%
Raleigh – Other$0.00.0%0.0%
Raleigh – Retail$01.60.5%0.5%
Raleigh – Self Storage$0.00.0%0.0%
Richmond – Richmond, VA MSA$82.12.4%0.0%
Richmond – Hotel$0.00.0%0.0%
Richmond – Industrial$0.00.0%0.0%
Richmond – Multifamily$0.00.0%0.0%
Richmond – Office$0.00.0%0.0%
Richmond – Other$0.00.0%0.0%
Richmond – Retail$82.114.6%0.0%
Richmond – Self Storage$0.00.0%0.0%
Riverside – Riverside-San Bernardino-Ontario, CA MSA$308.93.3%0.0%
Riverside – Hotel$79.425.8%-1.2%
Riverside – Industrial$0.00.0%0.0%
Riverside – Multifamily$08.10.2%0.2%
Riverside – Office$0.00.0%0.0%
Riverside – Other$0.00.0%0.0%
Riverside – Retail$221.410.4%-0.2%
Riverside – Self Storage$0.00.0%0.0%
Sacramento – Sacramento-Arden-Arcade-Roseville, CA MSA$59.41.0%0.6%
Sacramento – Hotel$39.710.9%9.3%
Sacramento – Industrial$0.00.0%0.0%
Sacramento – Multifamily$0.00.0%0.0%
Sacramento – Office$06.10.8%0.0%
Sacramento – Other$0.00.0%0.0%
Sacramento – Retail$13.61.7%0.0%
Sacramento – Self Storage$0.00.0%0.0%
Salt Lake City – Salt Lake City, UT MSA$46.91.3%0.0%
Salt Lake City – Hotel$46.916.9%0.6%
Salt Lake City – Industrial$0.00.0%0.0%
Salt Lake City – Multifamily$0.00.0%0.0%
Salt Lake City – Office$0.00.0%0.0%
Salt Lake City – Other$0.00.0%0.0%
Salt Lake City – Retail$0.00.0%0.0%
Salt Lake City – Self Storage$0.00.0%0.0%
San Antonio – San Antonio, TX MSA$133.82.1%-0.1%
San Antonio – Hotel$08.42.3%-0.1%
San Antonio – Industrial$0.00.0%0.0%
San Antonio – Multifamily$0.00.0%0.0%
San Antonio – Office$0.00.0%0.0%
San Antonio – Other$0.00.0%0.0%
San Antonio – Retail$125.414.1%-0.2%
San Antonio – Self Storage$0.00.0%-1.0%
San Diego – San Diego-Carlsbad-San Marcos, CA MSA$113.41.0%-0.9%
San Diego – Hotel$79.14.0%0.0%
San Diego – Industrial$0.00.0%0.0%
San Diego – Multifamily$09.50.2%0.2%
San Diego – Office$0.00.0%0.0%
San Diego – Other$20.53.0%0.1%
San Diego – Retail$04.30.3%-8.9%
San Diego – Self Storage$0.00.0%0.0%
San Francisco – San Francisco-Oakland-Fremont, CA MSA$383.11.6%0.3%
San Francisco – Hotel$171.67.3%0.0%
San Francisco – Industrial$0.00.0%0.0%
San Francisco – Multifamily$20.00.3%0.0%
San Francisco – Office$105.31.1%0.5%
San Francisco – Other$38.62.1%0.4%
San Francisco – Retail$47.64.0%-0.1%
San Francisco – Self Storage$0.00.0%0.0%
San Jose – San Jose-Sunnyvale-Santa Clara, CA MSA$135.90.9%0.2%
San Jose – Hotel$121.25.8%1.5%
San Jose – Industrial$0.00.0%0.0%
San Jose – Multifamily$0.00.0%0.0%
San Jose – Office$14.70.2%0.0%
San Jose – Other$0.00.0%0.0%
San Jose – Retail$0.00.0%0.0%
San Jose – Self Storage$0.00.0%0.0%
Seattle – Seattle-Tacoma-Bellevue, WA MSA$113.30.7%0.0%
Seattle – Hotel$109.08.3%0.0%
Seattle – Industrial$0.00.0%0.0%
Seattle – Multifamily$04.40.1%0.1%
Seattle – Office$0.00.0%0.0%
Seattle – Other$0.00.0%0.0%
Seattle – Retail$0.00.0%0.0%
Seattle – Self Storage$0.00.0%0.0%
St. Louis – St. Louis, MO-IL MSA$410.49.7%-0.1%
St. Louis – Hotel$58.120.6%-0.1%
St. Louis – Industrial$0.00.0%0.0%
St. Louis – Multifamily$24.21.5%0.0%
St. Louis – Office$107.119.3%0.1%
St. Louis – Other$23.04.2%-0.6%
St. Louis – Retail$197.919.8%-0.2%
St. Louis – Self Storage$0.00.0%0.0%
Tampa – Tampa-St. Petersburg-Clearwater, FL$300.43.5%0.2%
Tampa – Hotel$29.94.3%1.7%
Tampa – Industrial$0.00.0%0.0%
Tampa – Multifamily$02.50.0%0.0%
Tampa – Office$23.84.2%0.2%
Tampa – Other$0.00.0%0.0%
Tampa – Retail$244.226.7%-0.2%
Tampa – Self Storage$0.00.0%0.0%
Tucson – Tucson, AZ MSA$181.05.9%0.5%
Tucson – Hotel$19.48.1%6.2%
Tucson – Industrial$0.00.0%0.0%
Tucson – Multifamily$0.00.0%0.0%
Tucson – Office$0.00.0%0.0%
Tucson – Other$0.00.0%0.0%
Tucson – Retail$161.620.1%-0.1%
Tucson – Self Storage$0.00.0%0.0%
Virginia Beach – Virginia Beach-Norfolk-Newport News, VA-NC MSA$232.95.1%0.4%
Virginia Beach – Hotel$09.42.1%-0.5%
Virginia Beach – Industrial$21.26.9%0.2%
Virginia Beach – Multifamily$0.00.0%0.0%
Virginia Beach – Office$0.00.0%0.0%
Virginia Beach – Other$0.00.0%0.0%
Virginia Beach – Retail$202.323.0%2.2%
Virginia Beach – Self Storage$0.00.0%0.0%
Washington, DC – Washington-Arlington-Alexandria, DC-VA-MD-WV MSA$607.32.2%0.0%
Washington, DC – Hotel$30.03.4%-1.4%
Washington, DC – Industrial$11.22.0%0.0%
Washington, DC – Multifamily$01.20.0%0.0%
Washington, DC – Office$377.75.4%0.2%
Washington, DC – Other$44.72.8%0.0%
Washington, DC – Retail$142.55.2%-0.3%
Washington, DC – Self Storage$0.00.0%0.0%
Grand Total$24,536.33.7%-0.2%

About CRED iQ

CRED iQ is a commercial real estate data, analytics, and valuation platform providing actionable intelligence to CRE and capital markets investors. Subscribers to CRED iQ use the platform to identify valuable leads for leasing, lending, refinancing, distressed debt, and acquisition opportunities. Our data platform is powered by over $2.0 trillion of CMBS, CRE CLO, SBLL, Ginnie Mae, FHA/HUD, and Freddie Mac loan and property data.

April 2022 Delinquency Report

0
DQ = All delinquent CMBS loans in the conduit and SASB universe, including specially serviced and non-specially serviced loans
SS = All specially serviced CMBS loans in the conduit and SASB universe, including current, delinquent and REO
DQ + SS = All distressed CMBS loans in the conduit and SASB universe that are delinquent, specially serviced, or a combination of both

The CRED iQ overall delinquency rate for CMBS declined for the 22nd consecutive month with all major property types — retail, hotel, office, multifamily, and industrial — exhibiting improvements compared to the prior month. The delinquency rate, equal to the percentage of all delinquent specially serviced loans and delinquent non-specially serviced loans, for CRED iQ’s sample universe of $500+ billion in CMBS conduit and single asset single-borrower (SASB) loans was 3.84%, which compares to the prior month’s rate of 4.02%. CRED iQ’s special servicing rate, equal to the percentage of CMBS loans that are with the special servicer (delinquent and non-delinquent), declined month-over month to 6.09% from 6.43%. A combination of workouts, liquidations, cures, and mortgage rehabilitations have enabled the special servicing rate to decline for the fourth consecutive month. Aggregating the two indicators of distress – delinquency rate and special servicing rate – into an overall distressed rate (DQ + SS%) equals 6.19% of CMBS loans that are specially serviced, delinquent, or a combination of both. The overall distressed rate declined compared to the prior month rate of 6.40%. The overall distressed rates typically track slightly higher than special servicing rates as most delinquent loans are also with the special servicer.

DQ = All delinquent CMBS loans in the conduit and SASB universe, including specially serviced and non-specially serviced loans
SS = All specially serviced CMBS loans in the conduit and SASB universe, including current, delinquent and REO
DQ + SS = All distressed CMBS loans in the conduit and SASB universe that are delinquent, specially serviced, or a combination of both

Lodging has shown the most improvement in individual delinquency rates by property type with a 46% decline over the trailing 12 months. The outstanding balance of delinquent lodging loans decreased by more than $450 million compared to the prior month. The lodging delinquency rate was 7.99% this month, which compared to 8.46% a month ago and 14.73% a year ago. An example of a contribution to the decline in the delinquency rate for lodging was the $75.5 million W Chicago – City Center loan, which was paid current and returned to the master servicer in February after a modification.

The delinquency rate for office moved nominally to 1.88%, compared to 1.89% as of February 2022. A subplot to the nominal month-over-month decline is the industry’s anticipation of a special servicing transfer for the $308 million 1740 Broadway loan. Commercial Observer first broke the news of Blackstone handing back the keys to 1740 Broadway in a March 21, 2022 article. The property’s largest tenant, L Brands, had a lease expire in March 2022 and the company vacated, relocating to 55 Water Street. The transfer to special servicing was not reflected in March 2022 servicer data; however, a delinquency is possible in the near term given the recent developments with the loan. Adjusting for the potential delinquency of 1740 Broadway would push the office delinquency over 2.00%.

Special servicing rates for lodging (12.98%), retail (10.90%), and multifamily (2.08%) declined compared to the prior month. The special servicing rate for office increased to 3.38% this month, compared to 3.31% last month, and the industrial special servicing rate increased nominally. Special servicing transfers of loans secured by office properties have steadily occurred throughout Q1 2022. Notable transfers for the March 2022 reporting period include The Pinnacle at Bishop’s Woods in the Milwaukee, WI MSA and 300 East Lombard in Baltimore, MD.

One of the largest loans to transfer to special servicing this month was the $237.2 million Walden Galleria mortgage, which is secured by a 1.5 million-sf portion of a super-regional mall in Buffalo, NY. The loan is scheduled to mature in May 2022 and the borrower, Pyramid Management Group, has reportedly requested a maturity extension. Despite the special servicing transfer, the loan remained current in payment. The loan previously transferred to special servicing in April 2020 and subsequently returned to the master servicer in December 2020 after a modification.

DQ + SS = All distressed CMBS loans in the conduit and SASB universe that are delinquent, specially serviced, or a combination of both

CRED iQ’s overall CMBS distressed rate (DQ + SS%) by property type accounts for loans that qualify for either delinquent or special servicing subsets. This month, distressed rates decreased for all property types. In addition to Walden Galleria, the $80 million Chicago Ridge Mall was also one of the largest loans to transfer to special servicing this month. The Chicago Ridge Mall loan has a near-term maturity date, July 6, 2022, and a timely pay off appears to be unlikely. For additional information about these two loans, click View Details below:

[View Details][View Details]
LoanWalden GalleriaChicago Ridge Mall
Balance$237,181,455$80,000,000
Special Servicer Transfer Date2/2/20223/14/2022

About CRED iQ

CRED iQ is a commercial real estate data, analytics, and valuation platform providing actionable intelligence to CRE and capital markets investors. Subscribers to CRED iQ use the platform to identify valuable leads for leasing, lending, refinancing, distressed debt, and acquisition opportunities. Our data platform is powered by over $2.0 trillion of CMBS, CRE CLO, SBLL, and GSE Agency loan and property data.

Specially Serviced Loans

0

In this week’s WAR Report, CRED iQ calculated real-time valuations for five distressed properties that have transferred to special servicing in March 2022. Among these is a Chicago-area regional mall that is controlled by Starwood Capital Group. Additionally, there are two office properties featured, including a suburban office campus in the Milwaukee, WI MSA and a CBD office tower in Baltimore, MD. The final two highlighted properties comprise a student housing building in western Pennsylvania and a mixed-use property in San Francisco, CA.

CRED iQ valuations factor in a base-case (most likely), a downside (significant loss of tenants), and dark scenarios (100% vacant). For full access to the valuation reports as well as full CMBS loan reporting, including detailed financials, updated tenant information, and borrower contact information, sign up for a free trial here.

Chicago Ridge Mall

568,915 sf, Regional Mall, Chicago Ridge, IL  [View Details]

Yet another regional mall controlled by Starwood Capital Group will need a special servicing workout. The Chicago Ridge Mall, which secures an $80 million mortgage, transferred to Trimont Real Estate Advisors, as special servicer, on March 14, 2022. A reason for the transfer was not initially cited, but the mall’s cash flows were severely impacted by the pandemic and performance has not recovered to pre-pandemic levels. The loan sponsor is a joint venture that is controlled by Starwood Property Group ­— CRED iQ recently featured a portfolio of Starwood malls in its March 8, 2022 WAR Report. The loan was scheduled to mature in July 2022, but a payoff is unlikely given the value impairment of the collateral. CRED iQ is also watching for a potential title transfer from the borrowing entity to the CMBS trust.

Chicago Ridge Mall is located about 16 miles outside of Chicago, IL and has a total size of 867,955 sf, but only 568,915 sf serve as collateral for the mortgage. There is a vacant 211,858-sf parcel that was formerly occupied by Sears until it closed in 2021. The vacant anchor box is owned by Transformco and there are no immediate plans for redevelopment. Kohl’s also operates as an anchor at the mall and owns its building. Kohl’s, which has been the subject of takeover speculation over the past month, was featured in last week’s WAR Report, which explored CMBS exposure to Kohl’s store locations.

The largest collateral tenants at Chicago Ridge Mall include Dick’s Sporting Goods (9% of NRA), Bed Bath & Beyond (7% of NRA), and AMC Theatres (6% of NRA). Dick’s Sporting Goods opened in 2021 and partially backfilled space that was left vacant by Carson Pirie Scott, a former department store anchor. Aldi provides a grocery component at the mall with a 20,042-sf space, but the tenant has a right to terminate its lease at any time given a 24-month notice. The mall was 80% occupied as of September 2021, which was an improvement compared to 70% occupancy during the prior year. Net cash flow for 2021 was on pace to be over 30% below pre-pandemic levels from year-end 2019. For the full valuation report and property-level details, click here.

Chicago Ridge Mall – COMM 2012-CR2
Property NameChicago Ridge Mall
Address444 Chicago Ridge Mall
Chicago Ridge, IL 60415
Outstanding Balance$80,000,000
Interest Rate4.60%
Maturity Date7/6/2022
Most Recent Appraisal$129,700,000 ($228/sf)
Most Recent Appraisal Date4/17/2012

The Pinnacle at Bishop’s Woods

248,175 sf, Suburban Office, Brookfield, WI [View Details]

This $29.1 million loan transferred to special servicing on March 1, 2022 due to low occupancy at the collateral property, a three-building suburban office park. The loan’s DSCR has declined for three consecutive years and was most recently reported as 1.09 for the nine-month period ending September 2021. Occupancy across the three collateral office buildings was 67% as of September 2021. The next steps of workout are likely to address the low occupancy across the office portfolio and to mitigate a high concentration of lease rollover in 2022 at the smallest of the three buildings, Pinnacle I.

The Pinnacle at Bishop’s Woods consists of three office properties in Brookfield, WI, approximately 10 miles west of Milwaukee: Pinnacle I (13890 Bishop’s Drive), Pinnacle II (13935 Bishop’s Drive), and Pinnacle III (13845 Bishop’s Drive). The office park first exhibited occupancy declines in 2016 when the former largest tenant, Bader Rutter & Associates (27% of the NRA), vacated Pinnacle III in favor of a CBD location in Milwaukee. A portion of the space was backfilled by a new tenant, Pentair Residential Filtration, and an existing tenant, DeWitt Ross & Stevens SC, expanded its space to offset some of the loss from Bader Rutter. More recently, the office park’s second largest tenant, Travelers Indemnity (formerly 21% of the NRA; now 11%), reduced its footprint at Pinnacle II after signing a five-year renewal in August 2021. Overall, occupancy has declined by nearly 30% since loan origination. For the full valuation report and property-level details, click here.

The Pinnacle at Bishop’s Woods – CGCMT 2014-GC25
Property NameThe Pinnacle at Bishop’s Woods
Address13845-13935-13890 Bishop’s Drive
Brookfield, WI 53005
Outstanding Balance$29,136,932
Interest Rate4.67%
Maturity Date7/1/2024
Most Recent Appraisal$45,250,000 ($182/sf)
Most Recent Appraisal Date6/3/2014
CRED iQ Base-Case Value$30,903,000 ($124/sf)
Pinnacle II $14,090,000 ($138/sf)
Pinnacle III $9,955,000 ($124/sf)
Pinnacle I $6,858,000 ($105/sf)

300 East Lombard

225,485 sf, CBD Office, Baltimore, MD  [View Details]

This $24.8 million loan transferred to special servicing on March 14, 2022, likely due to an impending decline in collateral occupancy. The loan is secured by a 19-story office tower located in the Inner Harbor submarket of Baltimore, MD. The Baltimore Business Journal first reported that the building’s largest tenant, law firm Ballard Spahr, planned to vacate 300 East Lombard in favor of a smaller space at 111 S. Calvert Street, a newly renovated building with more tenant amenities that is located a block closer to the harbor. CRED iQ has featured multiple Baltimore CBD office buildings in WAR Reports so far in 2022, including 650 South Exeter Street and 201 North Charles. In each of these cases of distress, tenants have either vacated, downsized, or fled to higher quality locations — exhibiting how dynamic office markets can be in an environment with remote-work and pandemic considerations.

Ballard Spahr’s lease at 300 East Lombard is scheduled to expire on April 30, 2022. The tenant accounted for 15% of the property’s NRA. CRED iQ estimates occupancy will decline to approximately 65% following the tenant’s departure. For the full valuation report and property-level details, click here.

300 East Lombard – WFCM 2015-C27
Property Name300 East Lombard
Address300 East Lombard Street
Baltimore, MD 21202
Outstanding Balance$24,889,795
Interest Rate4.05%
Maturity Date2/11/2025
Most Recent Appraisal$38,500,000 ($171/sf)
Most Recent Appraisal Date12/17/2014

Philadelphia Square

259 units, Student Housing, Indiana, PA  [View Details]

This $10.5 million loan transferred to special servicing on March 11, 2022, which is two months ahead of the May 11, 2022 scheduled maturity date. The loan had a below breakeven DSCR during 2020 and through the nine-month period ended September 2021. The loan is secured by a 259-unit student housing property that caters to students enrolled at Indiana University of Pennsylvania (IUP). Enrollment at IUP has been falling for several years. Fall 2021 enrollment was 9,308 students, which represented a 7.5% decline compared to the prior year. Lower enrollment is a catalyst for lower demand and weakness in rental rates at off-campus student housing facilities. CRED iQ’s highest scoring comp for the property is IUP Pratt Studios, which transferred to special servicing in July 2021 and became REO in October 2021. For the full valuation report and property-level details for Philadelphia Square, click here.

Philadelphia Square – COMM 2012-CR1
Property NamePhiladelphia Square
Address1055 Philadelphia Street
Indiana, PA 15701
Outstanding Balance$10,521,706
Interest Rate5.35%
Maturity Date5/11/2022
Most Recent Appraisal$16,750,000 ($64,672/unit)
Most Recent Appraisal Date1/31/2012

1010 Bush

20,586 sf, Mixed-Use (Retail/Multifamily), San Francisco, CA  [View Details]

This $8 million loan transferred to special servicing on March 2, 2022 due to imminent monetary default. The loan is secured by a mixed-use property located in the Nob Hill submarket of San Francisco. The three-story building consists of ground floor retail and 65 residential hotel rooms that are operated as single-room occupancy units. The single-room occupancy units are master leased by Balmoral Residences, LLC for approximately $850 per unit per month. The master lease is scheduled to expire in February 2026. Multifamily and lodging property types have faced headwinds in the San Francisco MSA since the onset of the pandemic. Early in the pandemic, there was evidence of higher multifamily vacancies. Additionally, the lodging sector has been slow to recover. With a master lease in place, it is difficult to discern the performance of Balmoral Residences; however, the residential hotel company likely faces similar struggles to other distressed multifamily and lodging properties in San Francisco. For the full valuation report and property-level details, click here.

1010 Bush – CSAIL 2018-C14
Property Name1010 Bush
Address1010 Bush Street
San Francisco, CA 94109
Outstanding Balance$8,000,000
Interest Rate5.45%
Maturity Date11/6/2028
Most Recent Appraisal$12,500,000 ($607/sf)
Most Recent Appraisal Date7/26/2018

For full access to our loan database and valuation platform, sign up for a free trial below:

About CRED iQ

CRED iQ is a commercial real estate data, analytics, and valuation platform providing actionable intelligence to CRE and capital markets investors. Subscribers to CRED iQ use the platform to identify valuable leads for leasing, lending, refinancing, distressed debt, and acquisition opportunities. Our data platform is powered by over $2.0 trillion of CMBS, CRE CLO, SBLL, Ginnie Mae, FHA/HUD, and Freddie Mac loan and property data.

CMBS and Commercial Real Estate Implications of a Kohl’s Takeover

0

Key Takeaways:

  • Kohl’s plans to open smaller stores and transition away from department store format
  • The highest concentration of Kohl’s lease expirations occurs in 2024 impacting $815 million in CMBS debt
  • CMBS exposure to Kohl’s totals approximately $5 billion

Speculation surrounding Kohl’s and its future as a public company has been active during Q1 2022. In early-March 2022, Kohl’s provided updates on strategic initiatives for the company, which included a transition away from traditional department store operations. The retailer plans to open 100 new stores over the next four years with a smaller format than the 80,000 to 100,000-sf footprint of a Kohl’s legacy store layout. Kohl’s has reportedly faced pressure from activist investors to sell the company. Interested parties included hedge fund Starboard Value and private equity firm Sycamore Partners. Most recently, Hudson’s Bay — the former owner of failed department store Lord & Taylor — was reported to be considering a takeover bid for Kohl’s. The strategic objectives of Kohl’s management and external pressures from activist investors may lead to subsequent impacts in the commercial real estate sector.

In a takeover, many of Kohl’s owned real estate locations may be sold in a sale-leaseback transaction. Store closures or reduced footprints, in line with current management objectives, may also be possibilities for future operations. In all scenarios, retail landlords will need to adapt to the evolution of the retailer’s operational and real estate strategies.

Kohl’s operated approximately 1,165 stores as of January 2022 and owned 35% of the real estate for those locations. Kohl’s leased space for approximately 44% of its store locations. For 20% of the store locations, Kohl’s owned its building improvements and ground-leased the underlying land. Leased locations typically operate pursuant to a 20 to 25-year lease agreement with several five-year extension options.

Kohl’s has been historically more versatile than counterparts JCPenney and Macy’s with the location of its stores less reliant on regional malls. Only 5% of all stores are part of a community center or regional mall. Most locations, approximately 81%, anchor smaller strip centers. Kohl’s also operates freestanding locations, which make up 13% of the total store count.

CRED iQ leveraged its platform to identify properties leased to Kohl’s and properties that are shadow-anchored by a Kohl’s store. CRED iQ identified 230 properties with exposure to Kohl’s with actionable data including lease size, lease expiration date, property information, and borrower contact information. Most leases for this group of properties have expirations within the next 10 years. There were nine leases identified with expirations in 2022, including three active CMBS loans with $167.3 million in outstanding debt. The highest concentration of lease rollover is in 2024 with 23 leases scheduled to expire. Twenty-one of these properties secure active CMBS debt totaling $815 million. Classifying properties by lease expiration date, CRED iQ was further able to isolate properties with a Kohl’s lease expiration as shown Figure 1.

Figure 1

CRED iQ identified active CMBS exposure to Kohl’s as a tenant, which totaled approximately $5 billion in outstanding mortgage debt secured by 172 properties with Kohl’s as a leased tenant or shadow anchor. There were 13 properties with Kohl’s exposure, totaling $539.9 million, that were in special servicing and in need of workout. Eight of those properties were REO and had outstanding debt of $310.5 million. University Mall in Burlington, VT is the largest REO property by outstanding debt amount with $92 million in unpaid principal balance. Kohl’s leases 86,605 sf, equal to 14% of the property’s NRA, pursuant to lease that expires in February 2024. As of February 2022, University Mall was under contract to be sold.

The implications of near-term lease expirations coupled with initiatives by Kohl’s to reduce store layout sizes could have negative impacts on CMBS collateral if the tenant opts to downsize or move to a more favorable and strategic location.

Furthermore, sale-leaseback transactions have the possibility of converting complimentary retail space into competitive space for smaller shadow-anchored retail centers. Monitoring the various scenarios may be a complicated endeavor, but still not as complicated as figuring out how to use Kohl’s Cash (it’s probably expired).

For a copy of a comprehensive list of properties with exposure to Kohl’s — including CMBS exposure, please reach out to Shane Beeson (shane@cred-iq.com) or click the link below.

The list includes:

  1. a comprehensive list of 230 property records with Kohl’s exposure, including lease size and lease expiration date
  2. all CMBS exposure to Kohl’s, including shadow anchored properties and
  3. a complete list of all Kohl’s locations in the US (1,164 locations)

This week’s WAR Report focuses specifically on a few notable properties with Kohl’s exposure, including distressed regional malls. The third property is a freestanding single-tenant property in Tallahassee, FL that is leased to Kohl’s but went dark when the tenant vacated. CRED iQ provided updated real-time valuations for each of the properties.

CRED iQ valuations factor in a base-case (most likely), a downside (significant loss of tenants or 50% reduction in rent), and dark scenarios (100% vacant). For full access to the valuation reports as well as full CMBS loan reporting, with detailed financials, updated tenant information, and borrower contact information, sign up for a free trial here.

Kitsap Mall

715,255 sf, Regional Mall, Silverdale, WA  [View Details]

Kohl’s operates a 76,145-sf store at Kitsap Mall, a REO regional mall in Silverdale, WA with $74 million in outstanding debt. Kohl’s owns its improvements, located on the north side of the mall adjacent to JCPenney. The entire mall, including Kohl’s, measures approximately 715,255 sf in size. Only about 533,480 sf of the space is the portion that was foreclosed on in December 2021. The REO portion of the mall was formerly owned by Starwood Retail Partners. CRED iQ previously featured Starwood-affiliated malls in its March 8, 2022 WAR Report, which also mentioned Kitsap Mall as a comp for the Capital Mall located in Olympia, WA.

CW Capital is the appointed special servicer for the Kitsap Mall and has indicated plans to stabilize in-line occupancy and improve operations. The mall will need to be sold out of the CMBS trust at some point in the future. Kohl’s could potentially exit this location through a sale-leaseback; although the central location to Silverdale’s retail corridor may be the best option for the retailer if it wants to remain in the market. The nearest Kohl’s is located approximately 30 miles south in Gig Harbor, WA. For the full valuation report and property-level details, click here.

Property NameKitsap Mall
Address10315 Silverdale Way
Silverdale, WA 98383
Outstanding Balance$74,008,758
Collateral Size533,480 sf
Kohl’s Size76,145 sf
Kohl’s Lease ExpirationOwned – Non-Collateral
Most Recent Appraisal$32,000,000 ($60/sf)
Most Recent Appraisal Date10/5/2021

Indiana Mall

457,199 sf, Regional Mall, Indiana, PA  [View Details]

Kohl’s leases 40,516 sf at Indiana Mall, located approximately 50 miles east of Pittsburgh, PA. Similar to Kitsap Mall, the Indiana Mall is REO. LNR Securities foreclosed on the property in May 2021 and subsequently sold the asset via auction in March 2022. If the auction’s final bid is accepted, a sale of the property could close within 60 days.

Kohl’s operates pursuant to a lease that expires in January 2031. The retailer’s store layout at Indiana Mall is the smallest in CRED iQ’s database and likely aligns with the company’s initiatives for smaller store formats. However, the mall was only 49% occupied as of January 2022. Sales performance for Kohl’s is unavailable for this location, but there appears to be little benefit to the store’s attachment to a struggling mall in need of major redevelopment. For the full valuation report and property-level details, click here.

Property NameIndiana Mall
Address2334 Oakland Avenue
Indiana, PA 15701
Outstanding Balance$12,176,005
Collateral Size457,199 sf
Kohl’s Size40,516 sf
Kohl’s Lease Expiration1/31/2031
Most Recent Appraisal$4,300,000 ($9/sf)
Most Recent Appraisal Date10/6/2021

Kohl’s – Tallahassee, FL

100,000 sf, Freestanding Retail, Tallahassee, FL  [View Details]

Kohl’s leases 100,000 sf in this freestanding retail building at 6785 Thomasville Road in Tallahassee, FL. Kohl’s vacated the property in 2016, but has been honoring the lease, which expires in January 2029. Kohl’s appears to be paying approximately $6.10 per sf in rent under a NNN lease. Servicer commentary for the loan indicates that Kohl’s is in the process of sub-leasing the space and has engaged Colliers to facilitate a deal. The listing can be found here. Kohl’s operates a more favorable location in Tallahassee at 2010 Apalachee Parkway, nearby the Governor’s Square Mall. Despite Kohl’s commitment to its lease obligation at the Thomasville Road location, the mortgage secured by the property has a maturity date in June 2025. The presence of a dark building could cause complications in refinancing the debt. For the full valuation report and property-level details, click here.

Property NameKohl’s Tallahassee FL
Address6785 Thomasville Road
Tallahassee, FL 32312
Outstanding Balance$3,280,489
Collateral Size100,000 sf
Kohl’s Size100,000 sf (Dark)
Kohl’s Lease Expiration1/31/2029
Most Recent Appraisal$5,900,000 ($59/sf)
Most Recent Appraisal Date2/7/2015

For full access to our loan database and valuation platform, sign up for a free trial below:

About CRED iQ

CRED iQ is a commercial real estate data, analytics, and valuation platform providing actionable intelligence to CRE and capital markets investors. Subscribers to CRED iQ use the platform to identify valuable leads for leasing, lending, refinancing, distressed debt, and acquisition opportunities. Our data platform is powered by over $2.0 trillion of CMBS, CRE CLO, SBLL, Ginnie Mae, FHA/HUD, and Freddie Mac loan and property data.

2,085FollowersFollow
6SubscribersSubscribe